

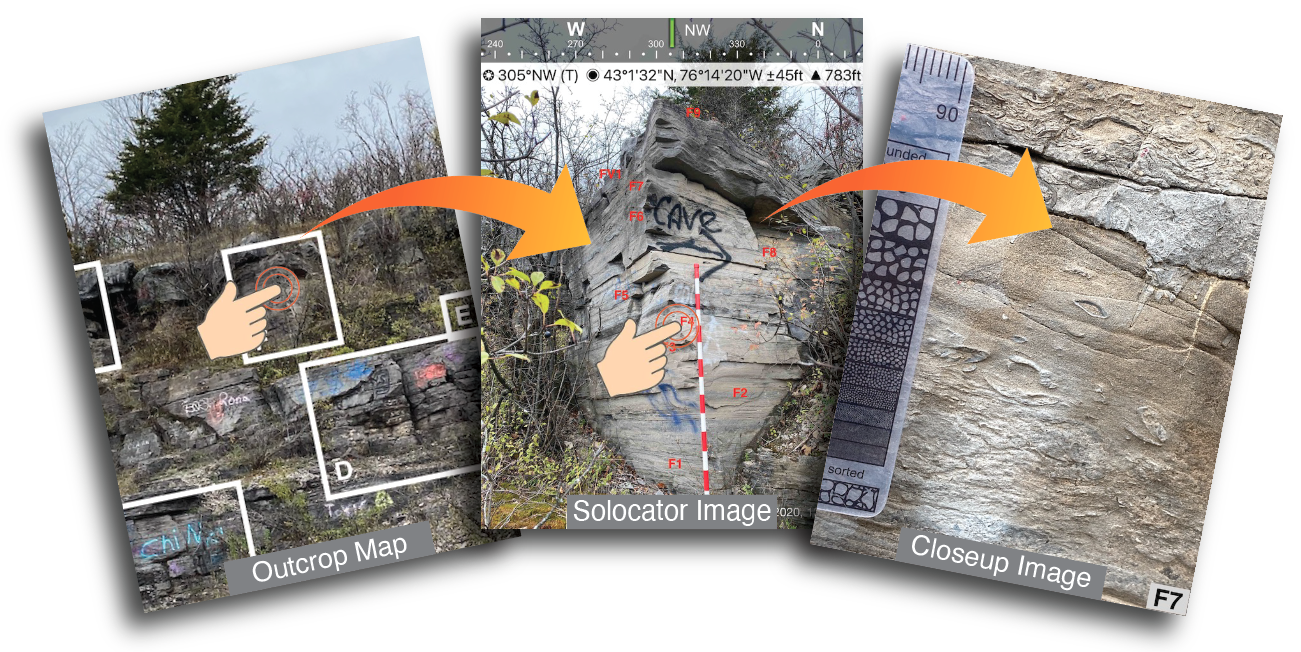
The primary source of outcrop data are 2-dimensional images taken across three different scales. The largest scale images, and the place to begin, are the Outcrop Map (North Side and South Side). The Outcrop Maps have rectangular hotspots that are linked to the corresponding Solocator Image (labeled A through P). The georeferenced Solocator Images have numbered hotspots which link to the closeup imagery (1 cm to 2 m in scale) as well as short video clips.
Additionally, the entire outcrop can be viewed as a zoomable Gigapan image or as a zoomable and rotatable 3D model (derived from video captured by UAV) which would provide large scale features (bedding and weathering profile) and provide for a means to measure stratigraphic thickness.
Begin by clicking on one of the graphics below.
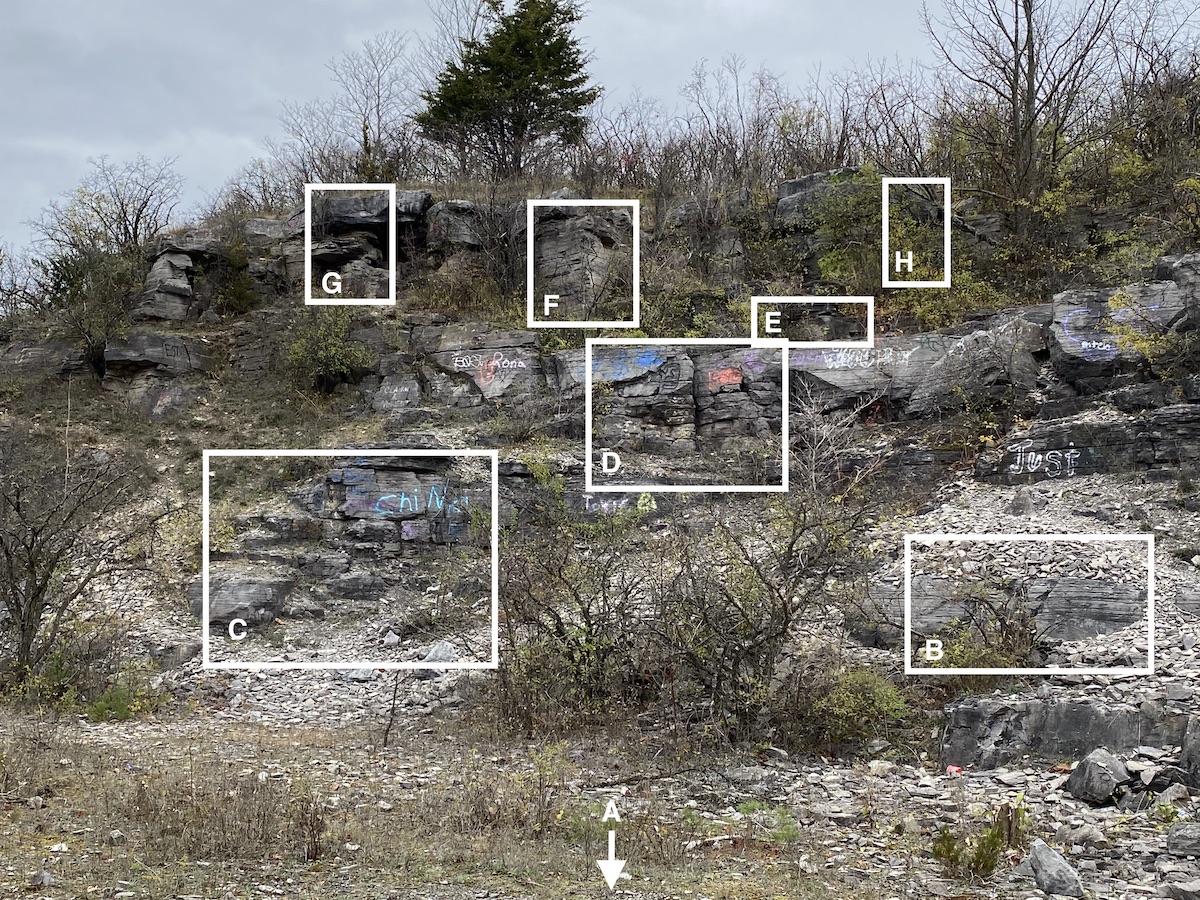
Click on the above image to go the North Side of the outcrop.
Click on the above image to go the the Gigapan image.
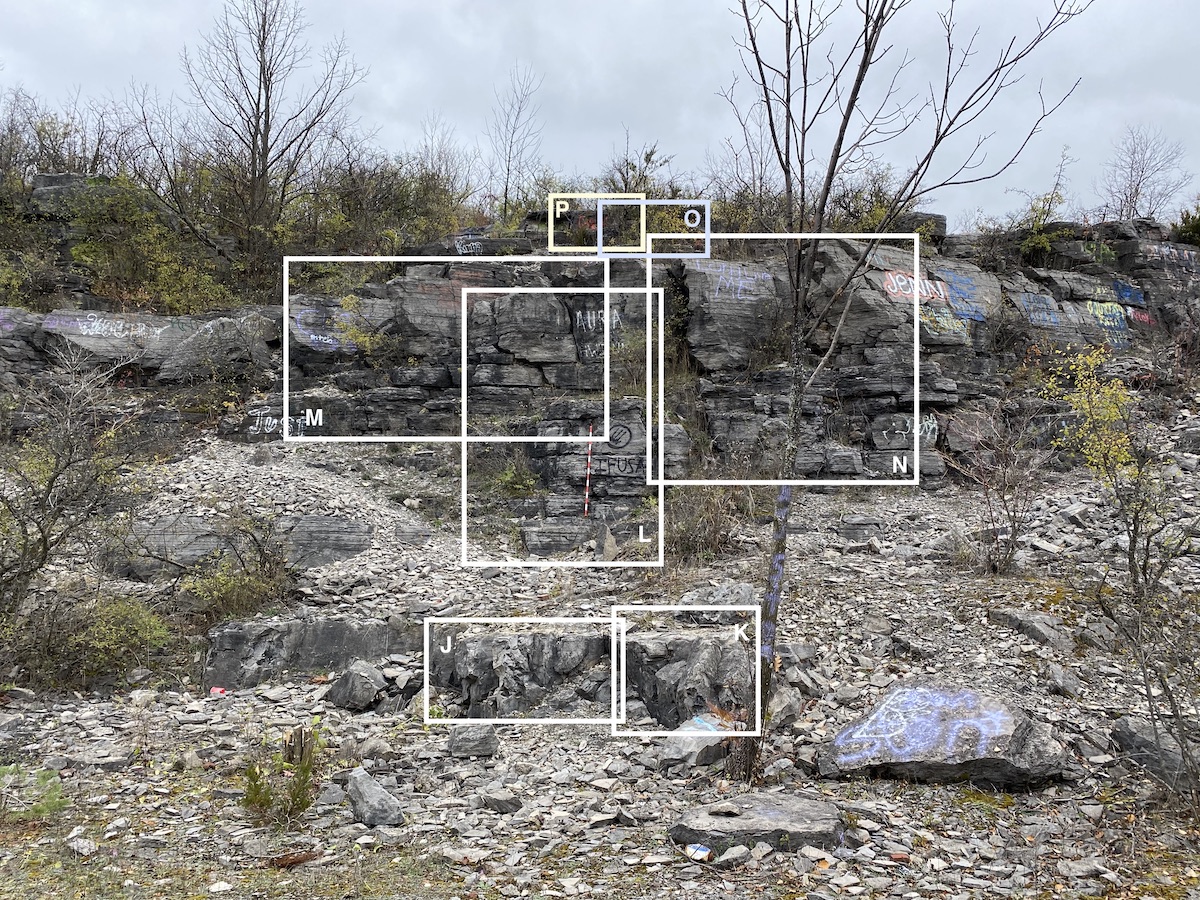
Click on the above image to go the South Side of the outcrop.

Click on the above image to go tp the 3D Model.

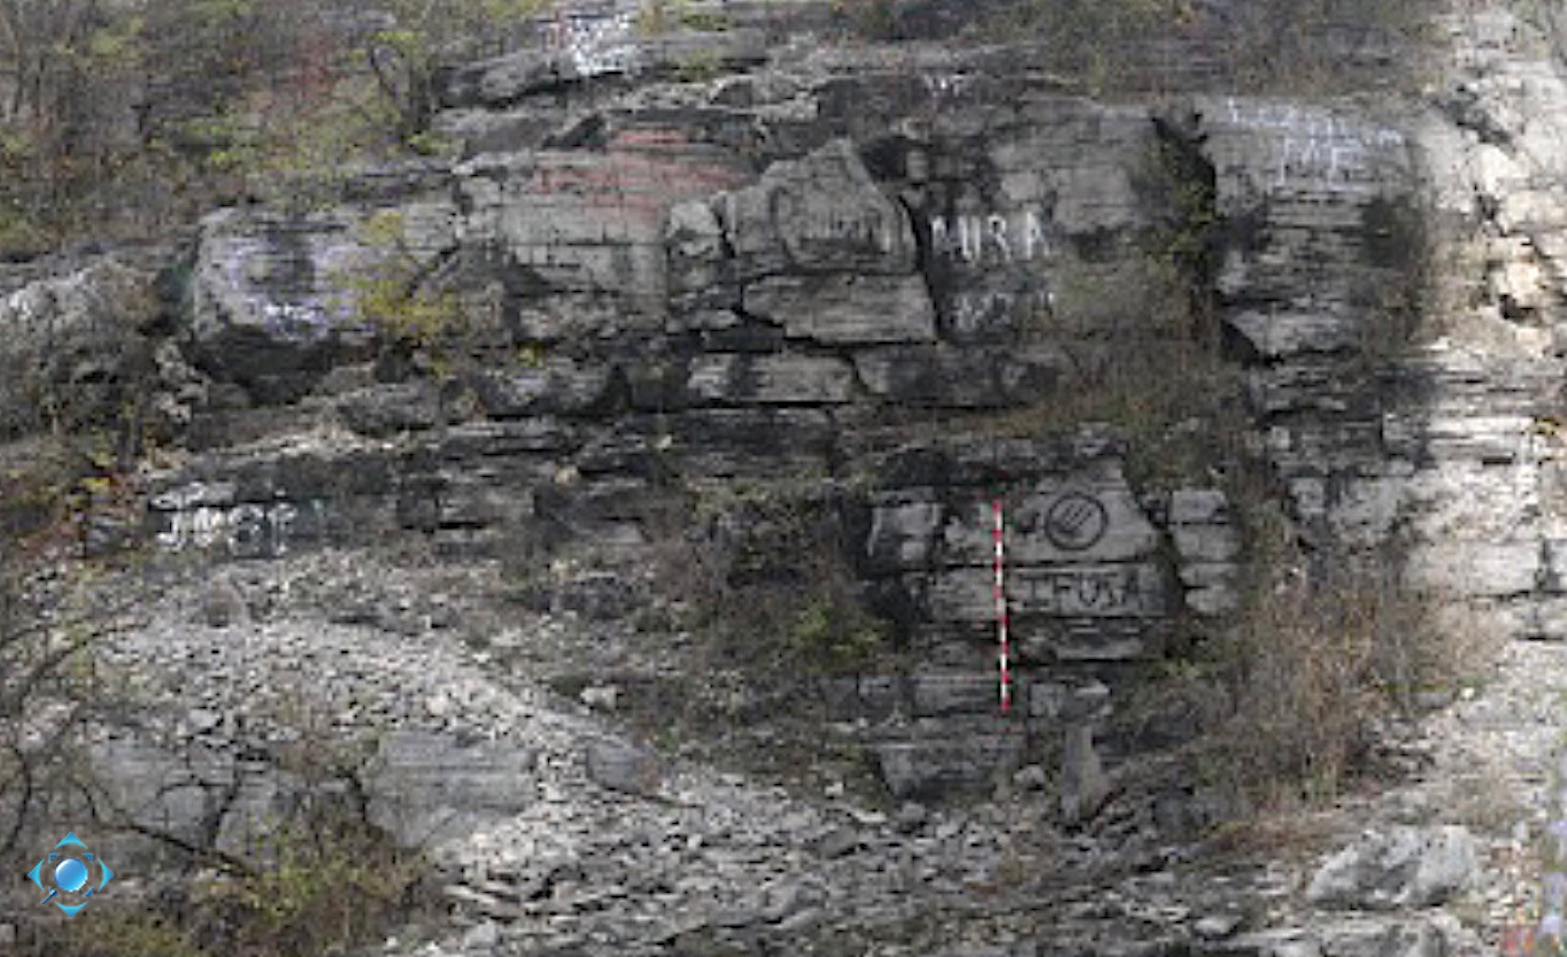
Panaorama image of the outcrop - useful for reference or note-taking (click image to open in a new tab).
Note about symbols used and scale
All images have some sort of scale. In outcrop and Solocator images, the Jacob staffs are 1.5 m in length with 10 cm divisions.
Close-up imagery usually has a grain-size comparator scale in view with mm scale and and/or graphic scale for grain size and roundness.
Most images are taken perpendicular to bedding. Images taken parallel to bedding are indicated by a bulls-eye graphic ![]()