


Chapter Contents
- What is Mitigation?
- Climate Change Mitigation Strategies
- Summary and Additional Resources
- Activities for Climate Change Mitigation Chapter
Image above by Maths Outreach (CC BY 2.0 via Wikimedia Commons)
Activity: Evaluating analogies to describe climate change adaptation and mitigation, and their relationship
Below are two analogies to describe responses to climate change. Evaluate the strengths and weaknesses of these analogies. Can you think of others?
Analogy 1: Credit Card Debt
Imagine climate change adaptation and mitigation to be like dealing with credit card debt. We’ve already put a lot of charges on our card, and we’re going to have to take some action to pay this off, that is, adapt to the situation. We might have to earn more money or spend less. If we keep making charges to the card without mitigating the situation by paying down the charges that have built up, it’s going to be harder to pay it off in the future. We might have to take on a second job or severely alter our lifestyle to cut expenses. If, on the other hand, we pay off some of the debt and we charge less to the card in the future, it will be easier to pay off the remaining debt.

Analogy 2: Laundry
Climate change adaptation and mitigation are like doing the laundry. If you let the laundry pile up for a while, you’ll have to adapt by maybe not wearing your favorite shirt if it’s not clean, or re-wearing clothes that are only a bit dirty. But if you don’t mitigate the problem, that is, if you continue to insist on not doing the laundry, eventually you’ll be left with some unpleasant choices: wear dirty, smelly clothes, wear no clothes, or go buy yourself an entirely new wardrobe. On Earth, of course, we can’t just buy another planet.
On the other hand, if you do the laundry pretty consistently, you may still have to adapt sometimes if your favorite shirt isn’t clean. But for the most part your adaptive actions and decisions will be small, and you can more easily get back to having enough clean clothes to wear.
Mitigation is like taking action to do the laundry regularly. Adaptation is like coming up with solutions to when the laundry isn’t done. Right now we’ve let the laundry pile up, and we’ve got to start cleaning up our act.
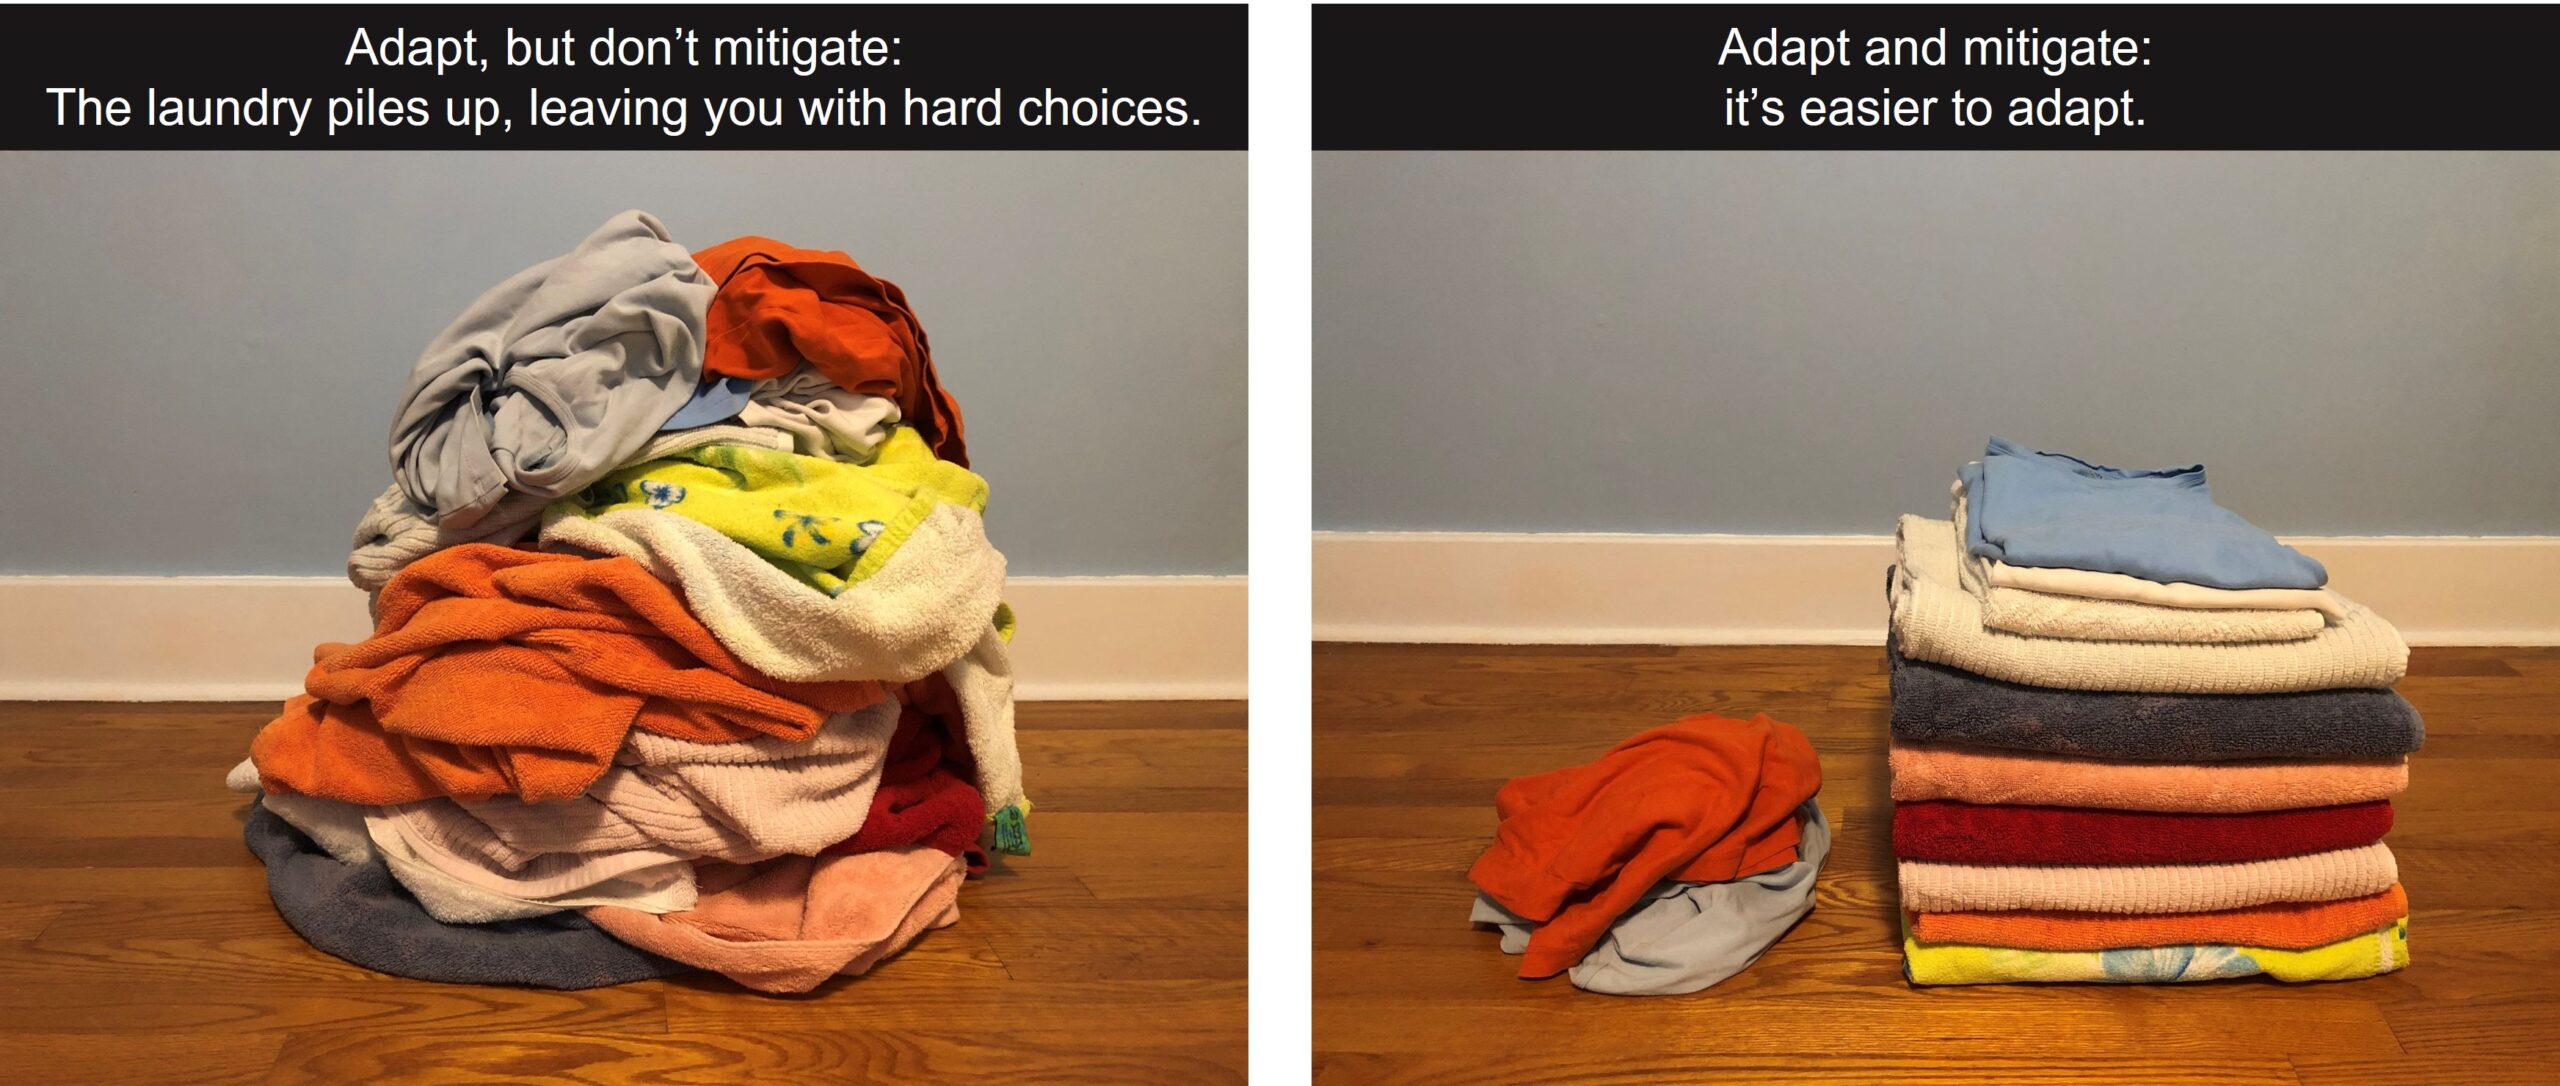
Figure created by Ingrid Zabel for PRI's Earth@Home project (CC BY-NC-SA 4.0 license).
Physics Connection: Calculating the electricity generation capacity of a large hydropower plant
Suppose the hydropower station at the Grand Coulee Dam has a flow rate of 2800 m³/s. That is, 2800 cubic meters of water flow through the station’s turbines in one second. If the height of the dam is h=170 m and the turbines are 100% efficient (an idealization), how much power does the station generate? Note: 100% efficiency means that we are ignoring energy losses due to friction in the turbines.
Ignoring frictional energy losses as the water drops down from the top of the dam, the kinetic energy of the water when it enters the turbines at the bottom of the dam is equal to the gravitational potential energy of the water at the top of the dam. One cubic meter of water has a mass m = 1000 kg. For one cubic meter of water, this potential energy is
mgh = (1000 kg) x (9.8 m/s2) x (170 m) = 1.67 x 10⁶ J
(g is the acceleration due to gravity at the Earth’s surface).
The kinetic energy of the water is used to do work, and power is the rate of
doing work. A flow rate of 2800 m³/s would generate a power of
P = (2800 m³/s) x (1000 kg/m³) x (9.8 m/s²) x (170 m) = 4.7 GW (gigawatts).
Follow-up question: How many homes can this dam power? Students will have to estimate the electricity use of a typical home.
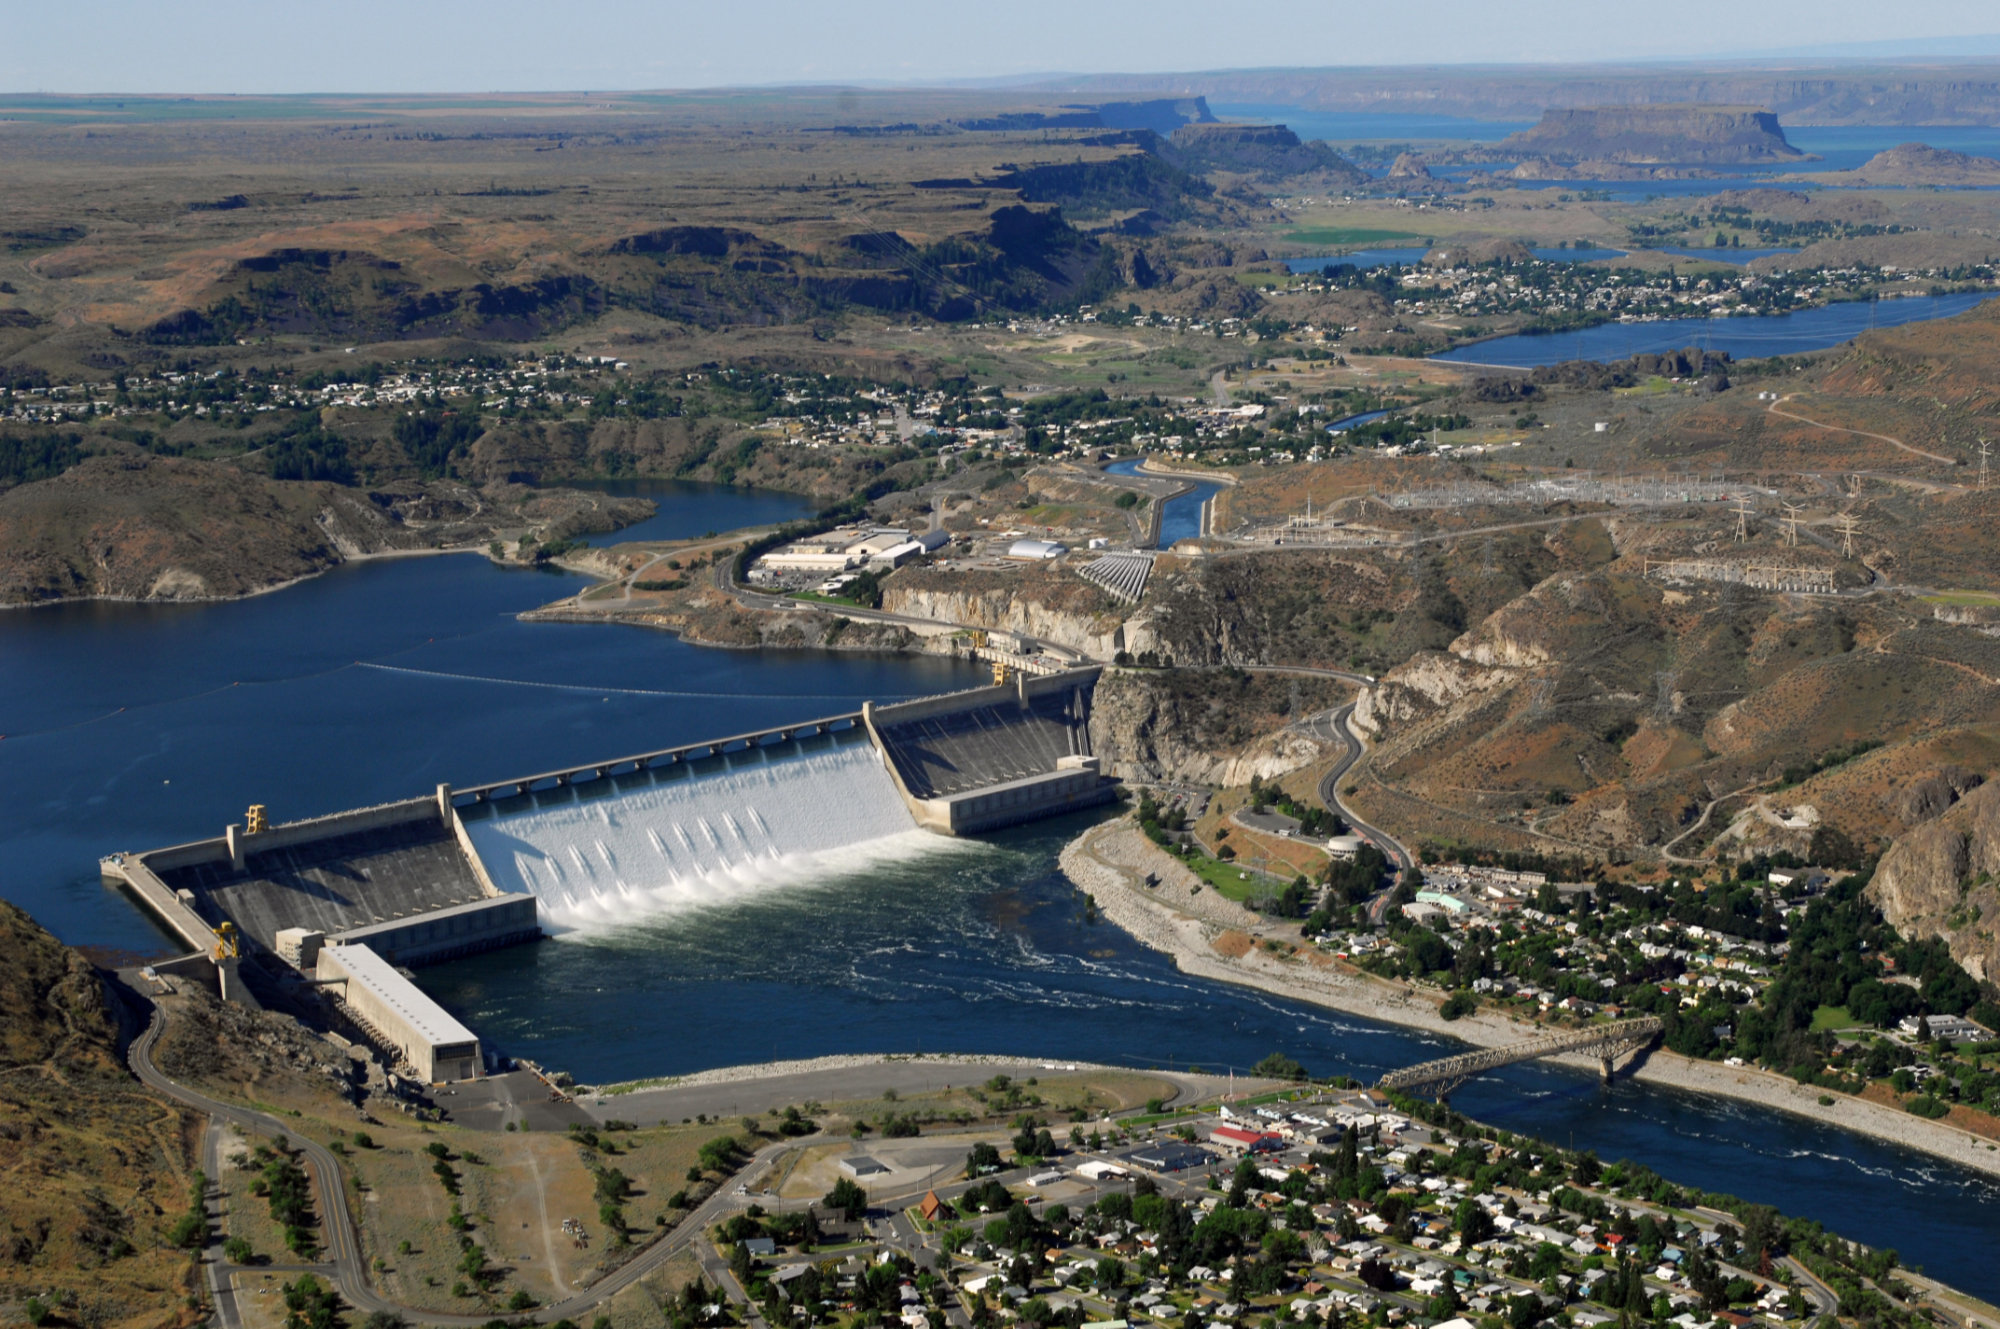
Aerial view of the Grand Coulee Dam taken in 2016, on the Columbia River in Washington. Photo by U.S. Bureau of Reclamation (public domain via Wikimedia Commons)
Activity: How do CO₂ Emissions from US Water Utilities Compare to Emissions from Cars?
The activities of drinking water and wastewater utilities in the US result in about 116 billion pounds of CO₂ emissions annually. For cars, burning one gallon of gasoline releases 19.64 pounds of CO₂. Assume a car is driven 10,000 miles annually and has a gas mileage of 25 miles per gallon (mpg). For this car, the number of gallons of gas used per year is
10,000 miles/25 mpg = 400 gallons.
This car thus releases
400 gallons x 19.64 lbs. CO₂/gallon = 7,856 pounds of CO₂ in one year.
The equivalent of CO₂ released from water utilities, expressed in terms of CO₂ released through driving cars, is
116 billion pounds / 7856 pounds per car = 14.8 million cars.
In other words, the annual CO₂ emissions from US water and wastewater utilities are equivalent to that of about 15 million cars.
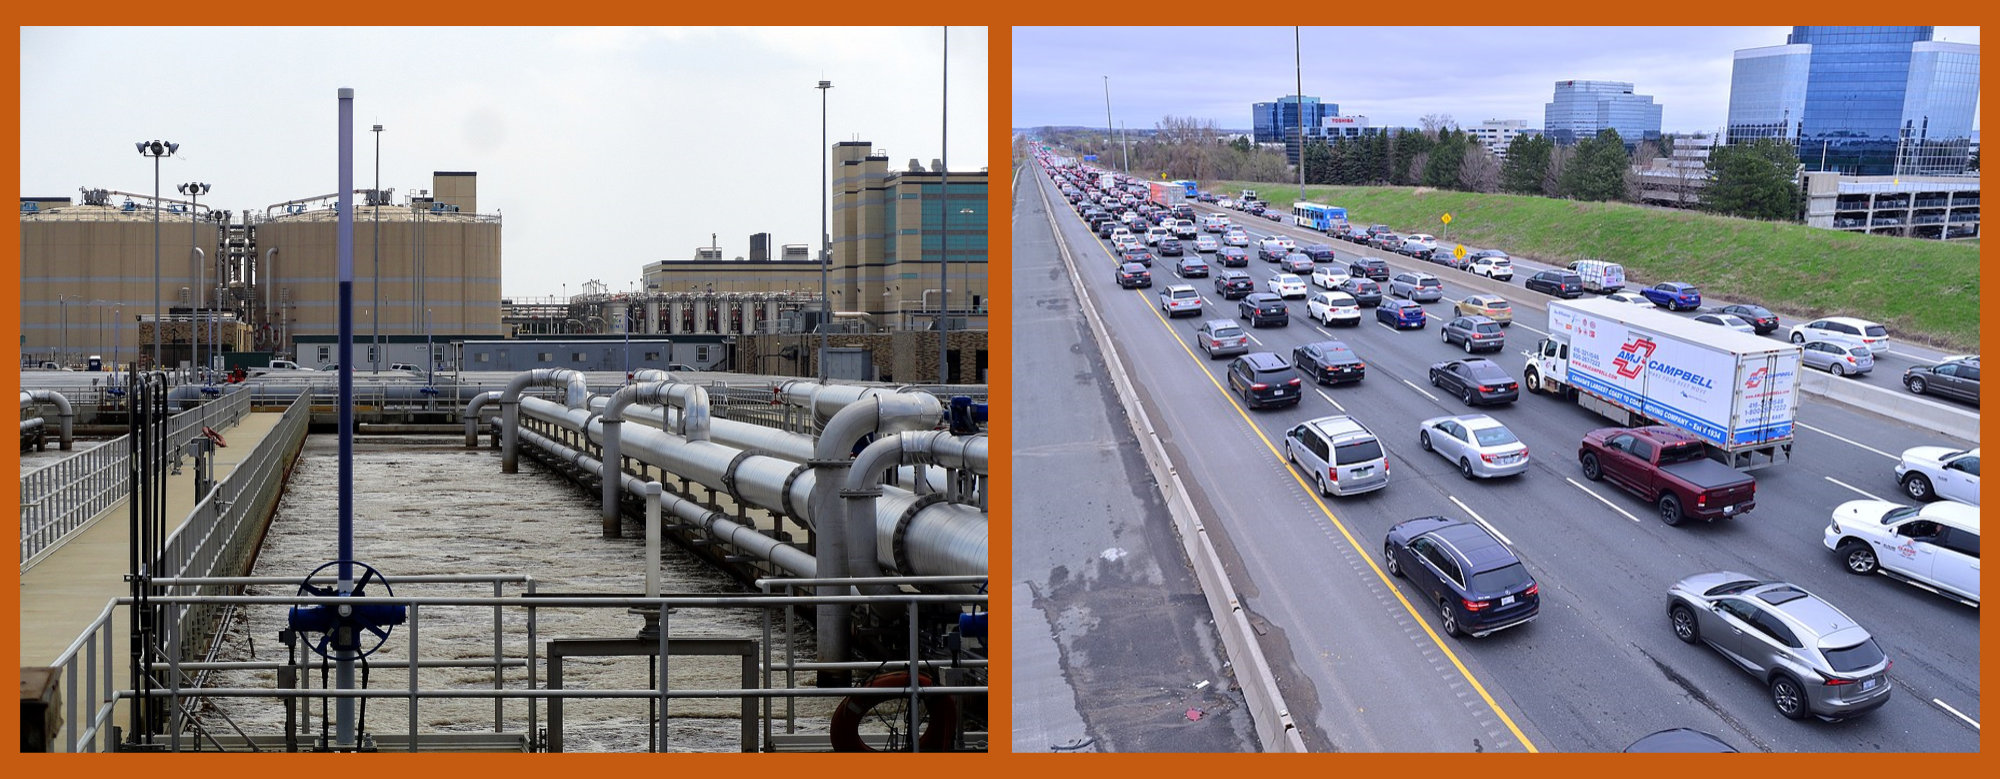
Photos: Wastewater treatment plant in Washington DC, photo by Moreau1 (public domain via Wikimedia Commons); Cars on highway, photo by Raysonho@Open Grid Scheduler/Scalable Grid Engine (public domain via Wikimedia Commons)
Physics Connection: Why Does Driving at Lower Speed on the Highway Save Energy?
In the 1970s, highway speed limits around the US were set to 55 mph in order to save energy. This has since changed, but it can be instructive to consider why this speed limit was set.
One of the main reasons is that cars are designed to perform optimally in a range of speeds, and pushing to high speeds beyond that range can reduce their efficiency. Friction from the air around the car also makes a difference. Aerodynamic drag is the force of air on a moving object. The drag force on a moving car resists the car’s motion, and the car has to use energy to overcome it. The faster the car goes, the higher the drag force. In fact, the drag force is proportional to the square of the relative velocity between the car and the air:
Fdrag ∝ vrel2.
Calculate how much higher the drag force is for a car traveling at 75 mph than for a car traveling at 55 mph. NOTE: this is a simple, “back-of-the-envelope" calculation that doesn’t account for all the complexities of the drag force on a car and all the differences between driving 55 and 75 mph. But, it can give students an idea of the issues involved.
Solution: The ratio of drag forces on a car traveling at 75 mph compared to that at 55 mph is
Fdrag,75/Fdrag,55 = (v75/v55)2 = (75 mph/55 mph)2 = 1.86.
That is, the drag force on a car traveling at 75 mph is 1.86 times higher than the drag force on a car traveling 55 mph. It costs energy to fight the drag force, and thus it is more energy efficient to drive at 55 mph than at 75 mph.

Discussion Activity: Commuting to School and Work
- What could adults learn from kids and from the way kids get to school, in terms of saving energy and reducing carbon emissions?
- What constraints do adults have that might limit them from using the same methods as kids?
- What are some solutions, and how can we implement them?
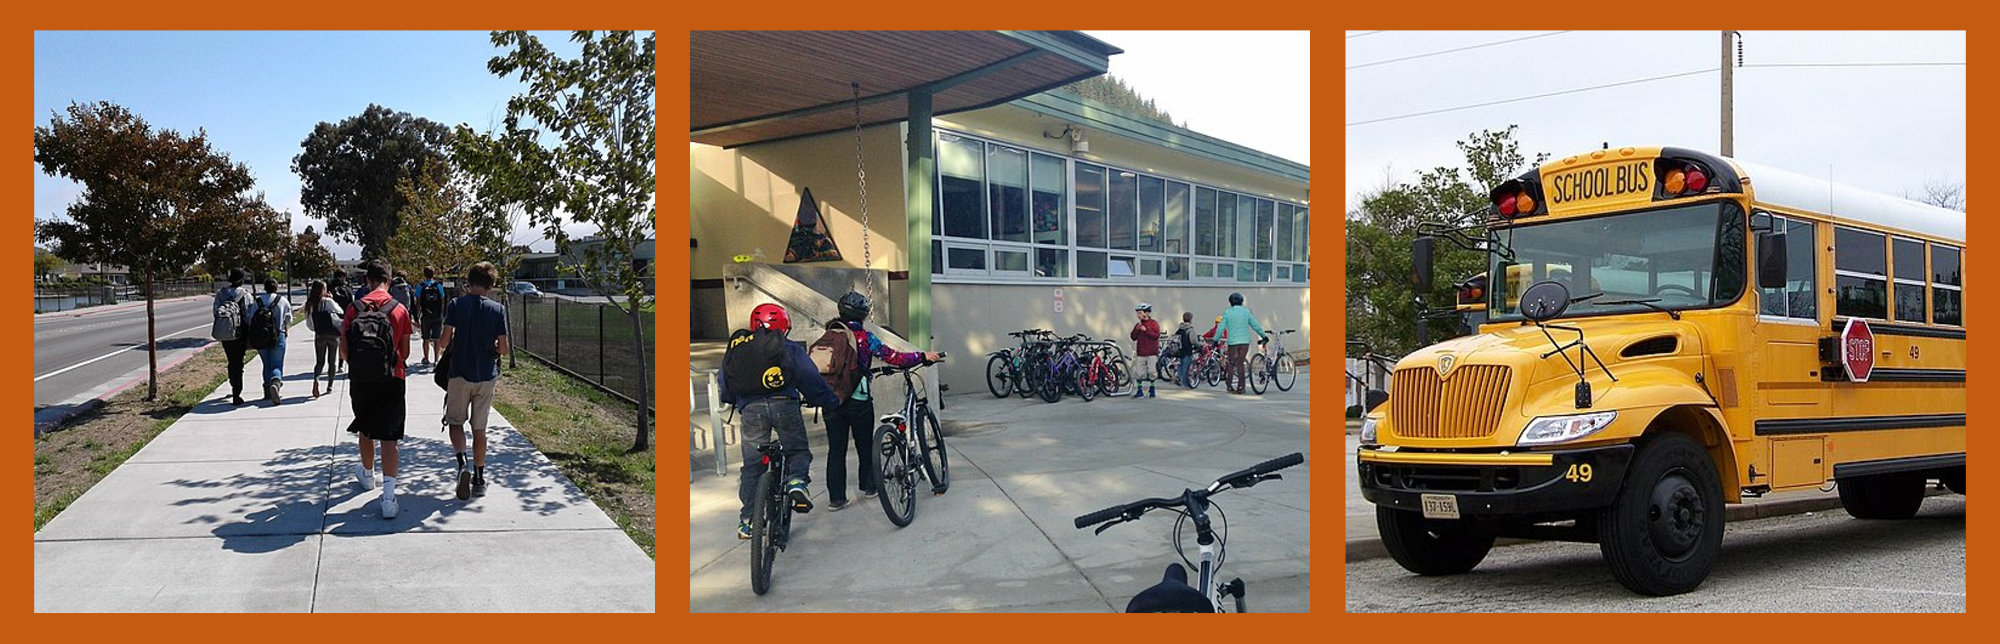
Photos: Kids biking to school, photo by Alaska DOT&PF (CC BY 2.0 via Wikimedia Commons); kids walking to school, photo by Nipponeselover (CC BY-SA 3.0 via Wikimedia Commons); school bus by William J. Grimes (public domain via Wikimedia Commons).
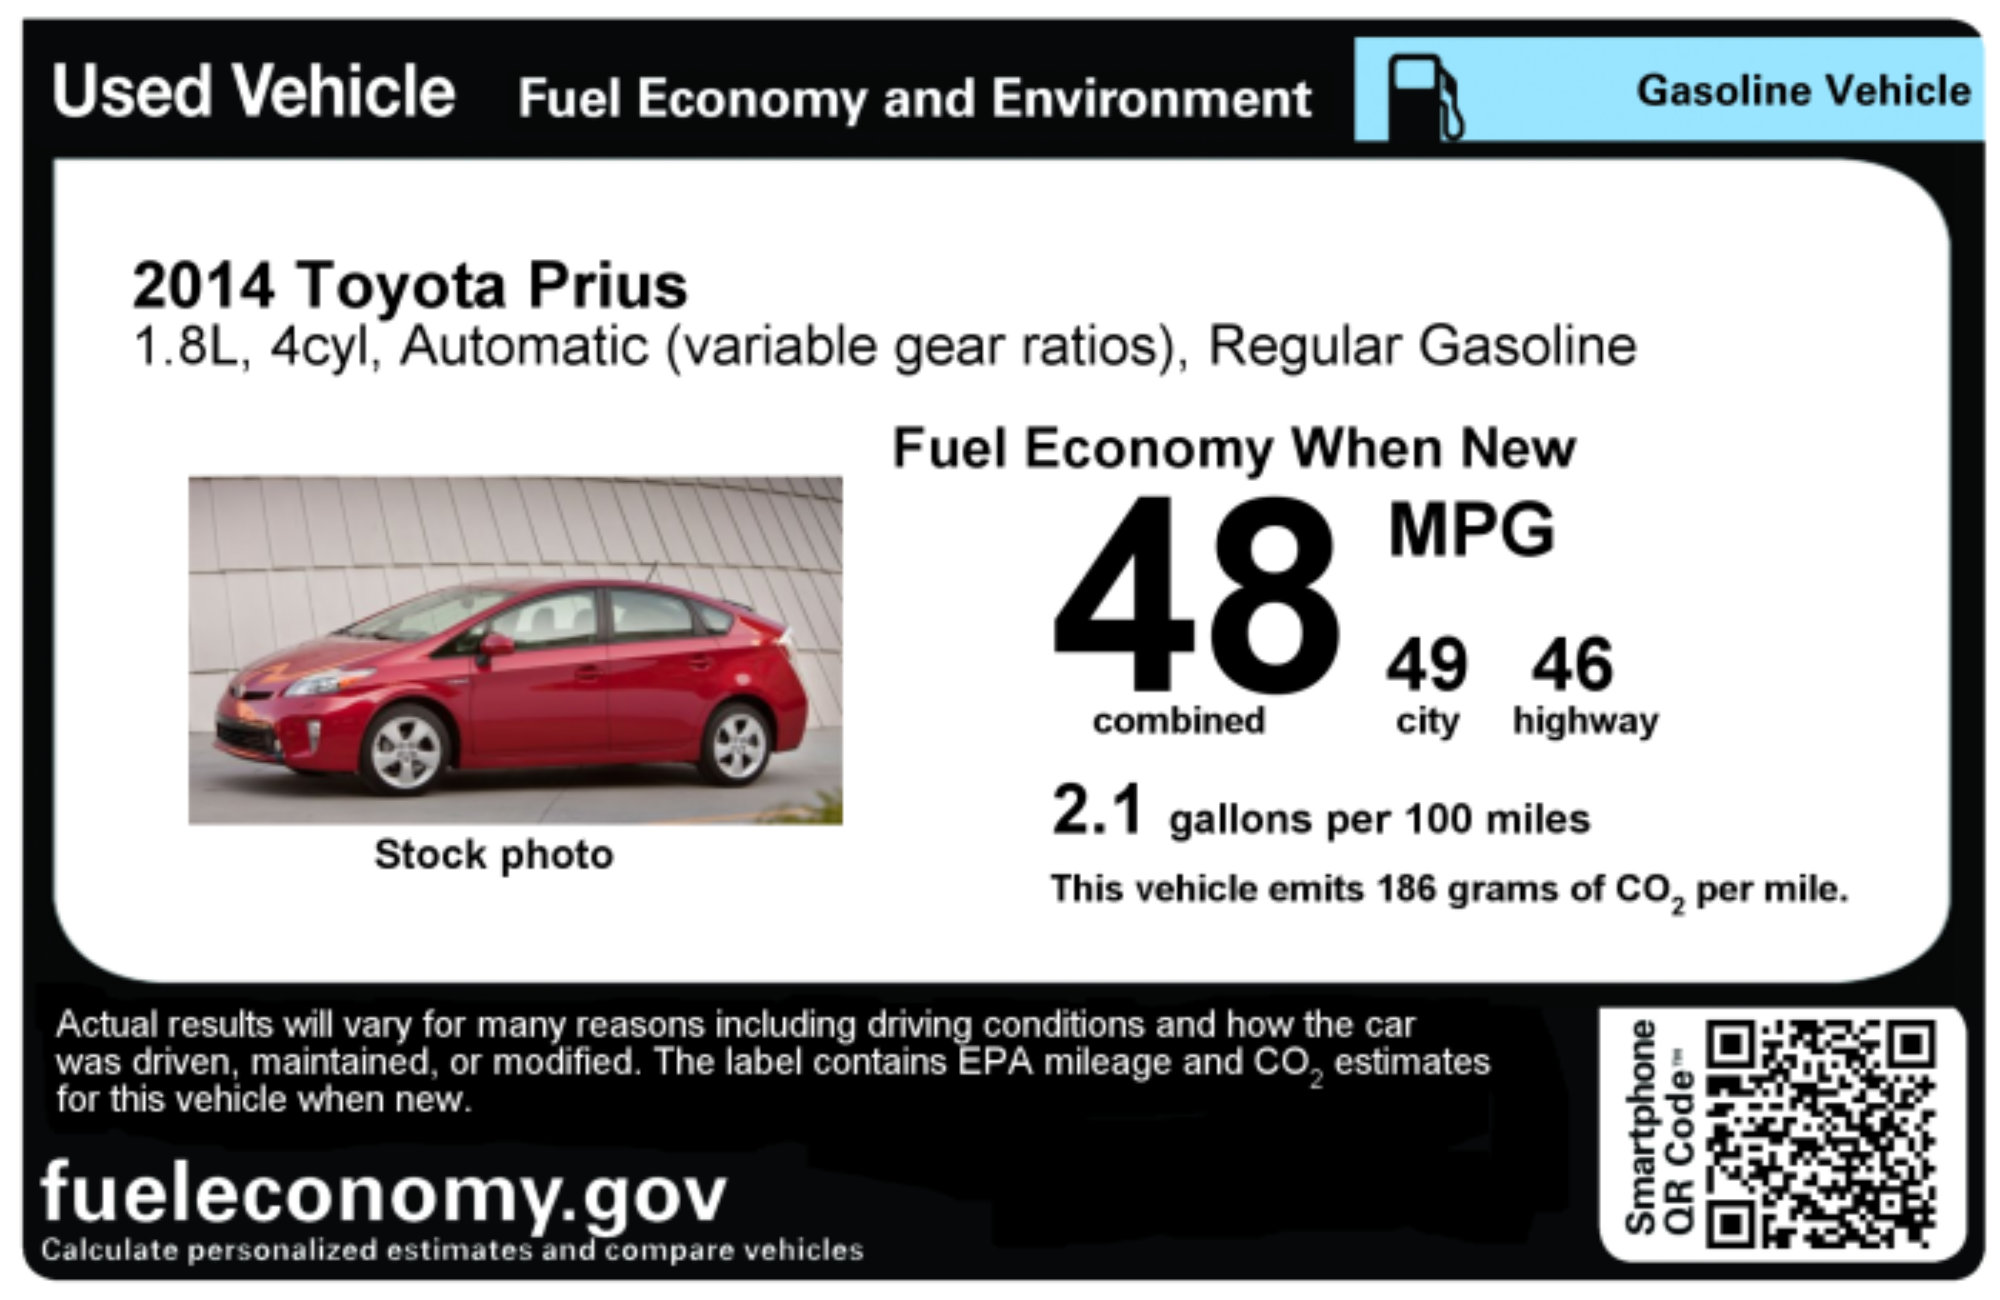
Exercise: What difference do Vehicle Fuel Efficiency Improvements Make?
Compare a car that gets 28 miles per gallon and a light truck that gets 23 miles per gallon. If each is driven 10,000 miles per year, the car uses
10,000 miles/28 mpg = 357 gallons of gas in a year
and the truck uses
10,000 miles/23 mpg = 434 gallons of gas in a year.
In 2013, US auto dealers sold 7.9 million new light duty trucks and 7.6 million new cars. [National Automobile Dealers Association] Assuming that these vehicles have the gas mileages above, the new light trucks would burn about 482 million more gallons of gas than the new cars. That releases about 9.5 billion pounds more CO2 into the air, and that difference is just from new vehicles sold in one year in the US.
Chemistry Connection: Chemical reactions in carbon capture systems
There are three main methods of capturing carbon in a CCS system. A post-combustion method called flue gas separation uses a liquid solvent to chemically remove the CO2 molecules as they make their way through a column. The chemical reaction with the solvent monoethanolamine is shown below.
C2H4OHNH2 + H2O + CO2 → C2H4OHNH3+ + HCO3- .
In the next step, the solvent passes through a unit where it is heated and the reaction runs in reverse, releasing condensed water vapor, the original solvent (to be reused), and concentrated CO2. This CO2 can then be compressed for storage or reuse.
A second method of carbon capture, oxy-fuel combustion, burns the fossil fuel in pure or enriched oxygen instead of in air. This results in mostly CO2 and H2O as combustion products, instead of a waste gas that contains only 3 – 15% CO2. Condensing out the water vapor leaves behind CO2, which can then be compressed and stored or reused. This process still requires a lot of energy to separate gases, but the separation takes place on incoming air before combustion—to produce the pure or enriched oxygen—instead of in the flue after combustion.
The third method, pre-combustion, captures CO2 before burning the fossil fuel. With coal, the process begins with gasifying the coal by reacting it with oxygen and steam at high pressure and temperature, producing a gas of mostly CO and H2. The next step uses water to react with the CO to produce CO2 and more H2.
CO + H2O → CO2 + H2
In the final step, the CO2 is captured and the H2 is used as fuel for a turbine, to generate electricity.
Discussion Activity: Carbon Offset Programs
Air travelers may see signs at airports offering purchase of carbon offsets to offset the carbon emissions associated with air travel, which are large. Some people think this is a good idea, because the money from these purchases goes to real actions to mitigate climate change, like establishing forests, supporting energy efficiency projects in low-income households, and setting up renewable energy installations. Others think that these carbon offset programs just encourage people to fly more, increasing their carbon emissions, because travelers feel they can buy their way out of environmental responsibility.
- What do you think?
- What would be required of a carbon offset program to really make it have the intended effect of reducing carbon emissions?

Exercise: Ways to Lock Carbon in Biomass
An idea for removing carbon from the atmosphere is to grow a lot of trees, cut them down, put the biomass from these trees into buildings or structures that will be around for decades or centuries, and then grow more trees. How many trees would be required to make a difference? What might be the impact on total carbon uptake of replacing larger mature trees with smaller young ones? What are some other ways you can think of to “lock up” carbon?

Brock Commons Tallwood House on the campus of the University of British Columbia, a tall building built with wood instead of steel and concrete. Photo: UBC Media Relations (CC BY-NC 2.0 via Flickr)
In the Greenhouse Videos with Climate Change Mitigation Activities
PRI's video series In the Greenhouse: Exploring Climate Change features experiments and activities that students and others can do in a classroom, outdoors, and at home. The following videos show climate change mitigation activities.
"Kitchen Climate Science (In the Greenhouse #15)" by Paleontological Research Institution (YouTube). This video features a do-it-yourself activity on the science of wind power, using simple materials.
"Sunlight Stored in Soil (In the Greenhouse #7)" by Paleontological Research Institution (YouTube)
"DIY Solar Energy: Photosynthetic Solar Cells (In the Greenhouse #17)" by Paleontological Research Institution (YouTube)
"Actions to Fight Climate Change (In the Greenhouse #14)" by Paleontological Research Institution (YouTube)
"Trees From Thin Air (In the Greenhouse #9)" by Paleontological Research Institution (YouTube)