

Chapter Contents
- What is Mitigation?
- Climate Change Mitigation Strategies
- Summary and Additional Resources
- Activities for Climate Change Mitigation Chapter
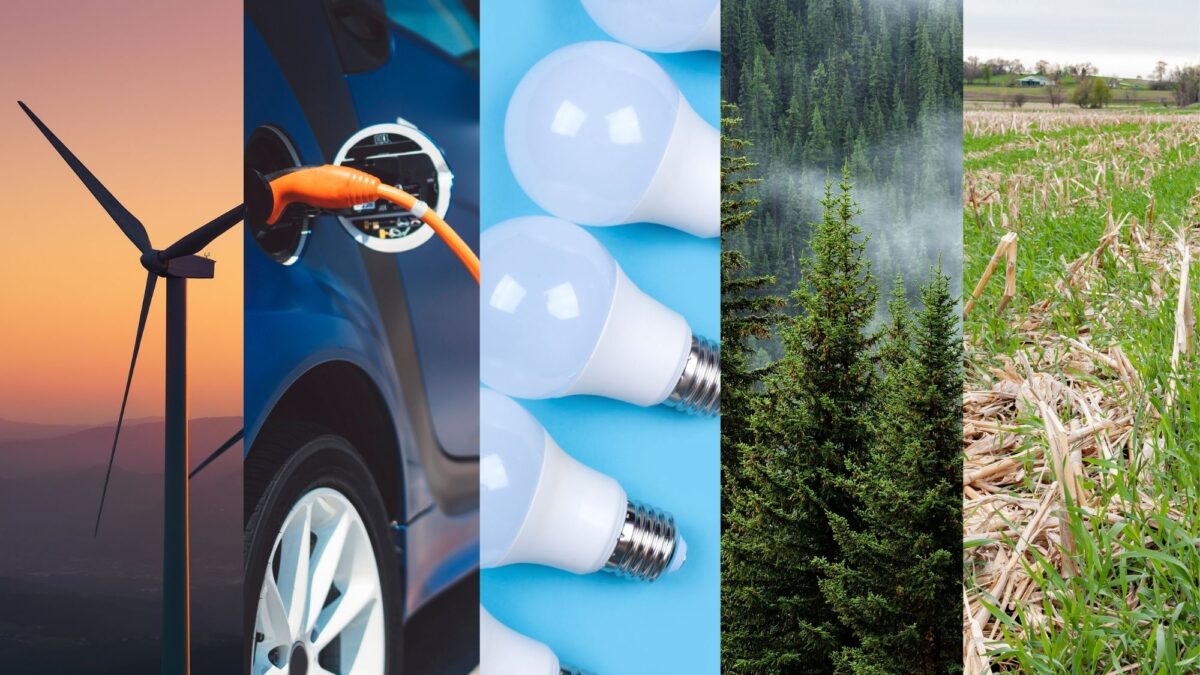
Figure above created by Ingrid Zabel for PRI's Earth@Home project (CC BY-NC-SA 4.0 license) with photos from Pixabay and Canva
Climate change mitigation strategies vary, and they can involve different levels of effort and scope, from broad-ranging actions taken at the government level to actions by specific industries or companies, and to behavior changes made by individuals. A successful mitigation pathway will involve combinations of these strategies.
On This Page:
Renewable Energy
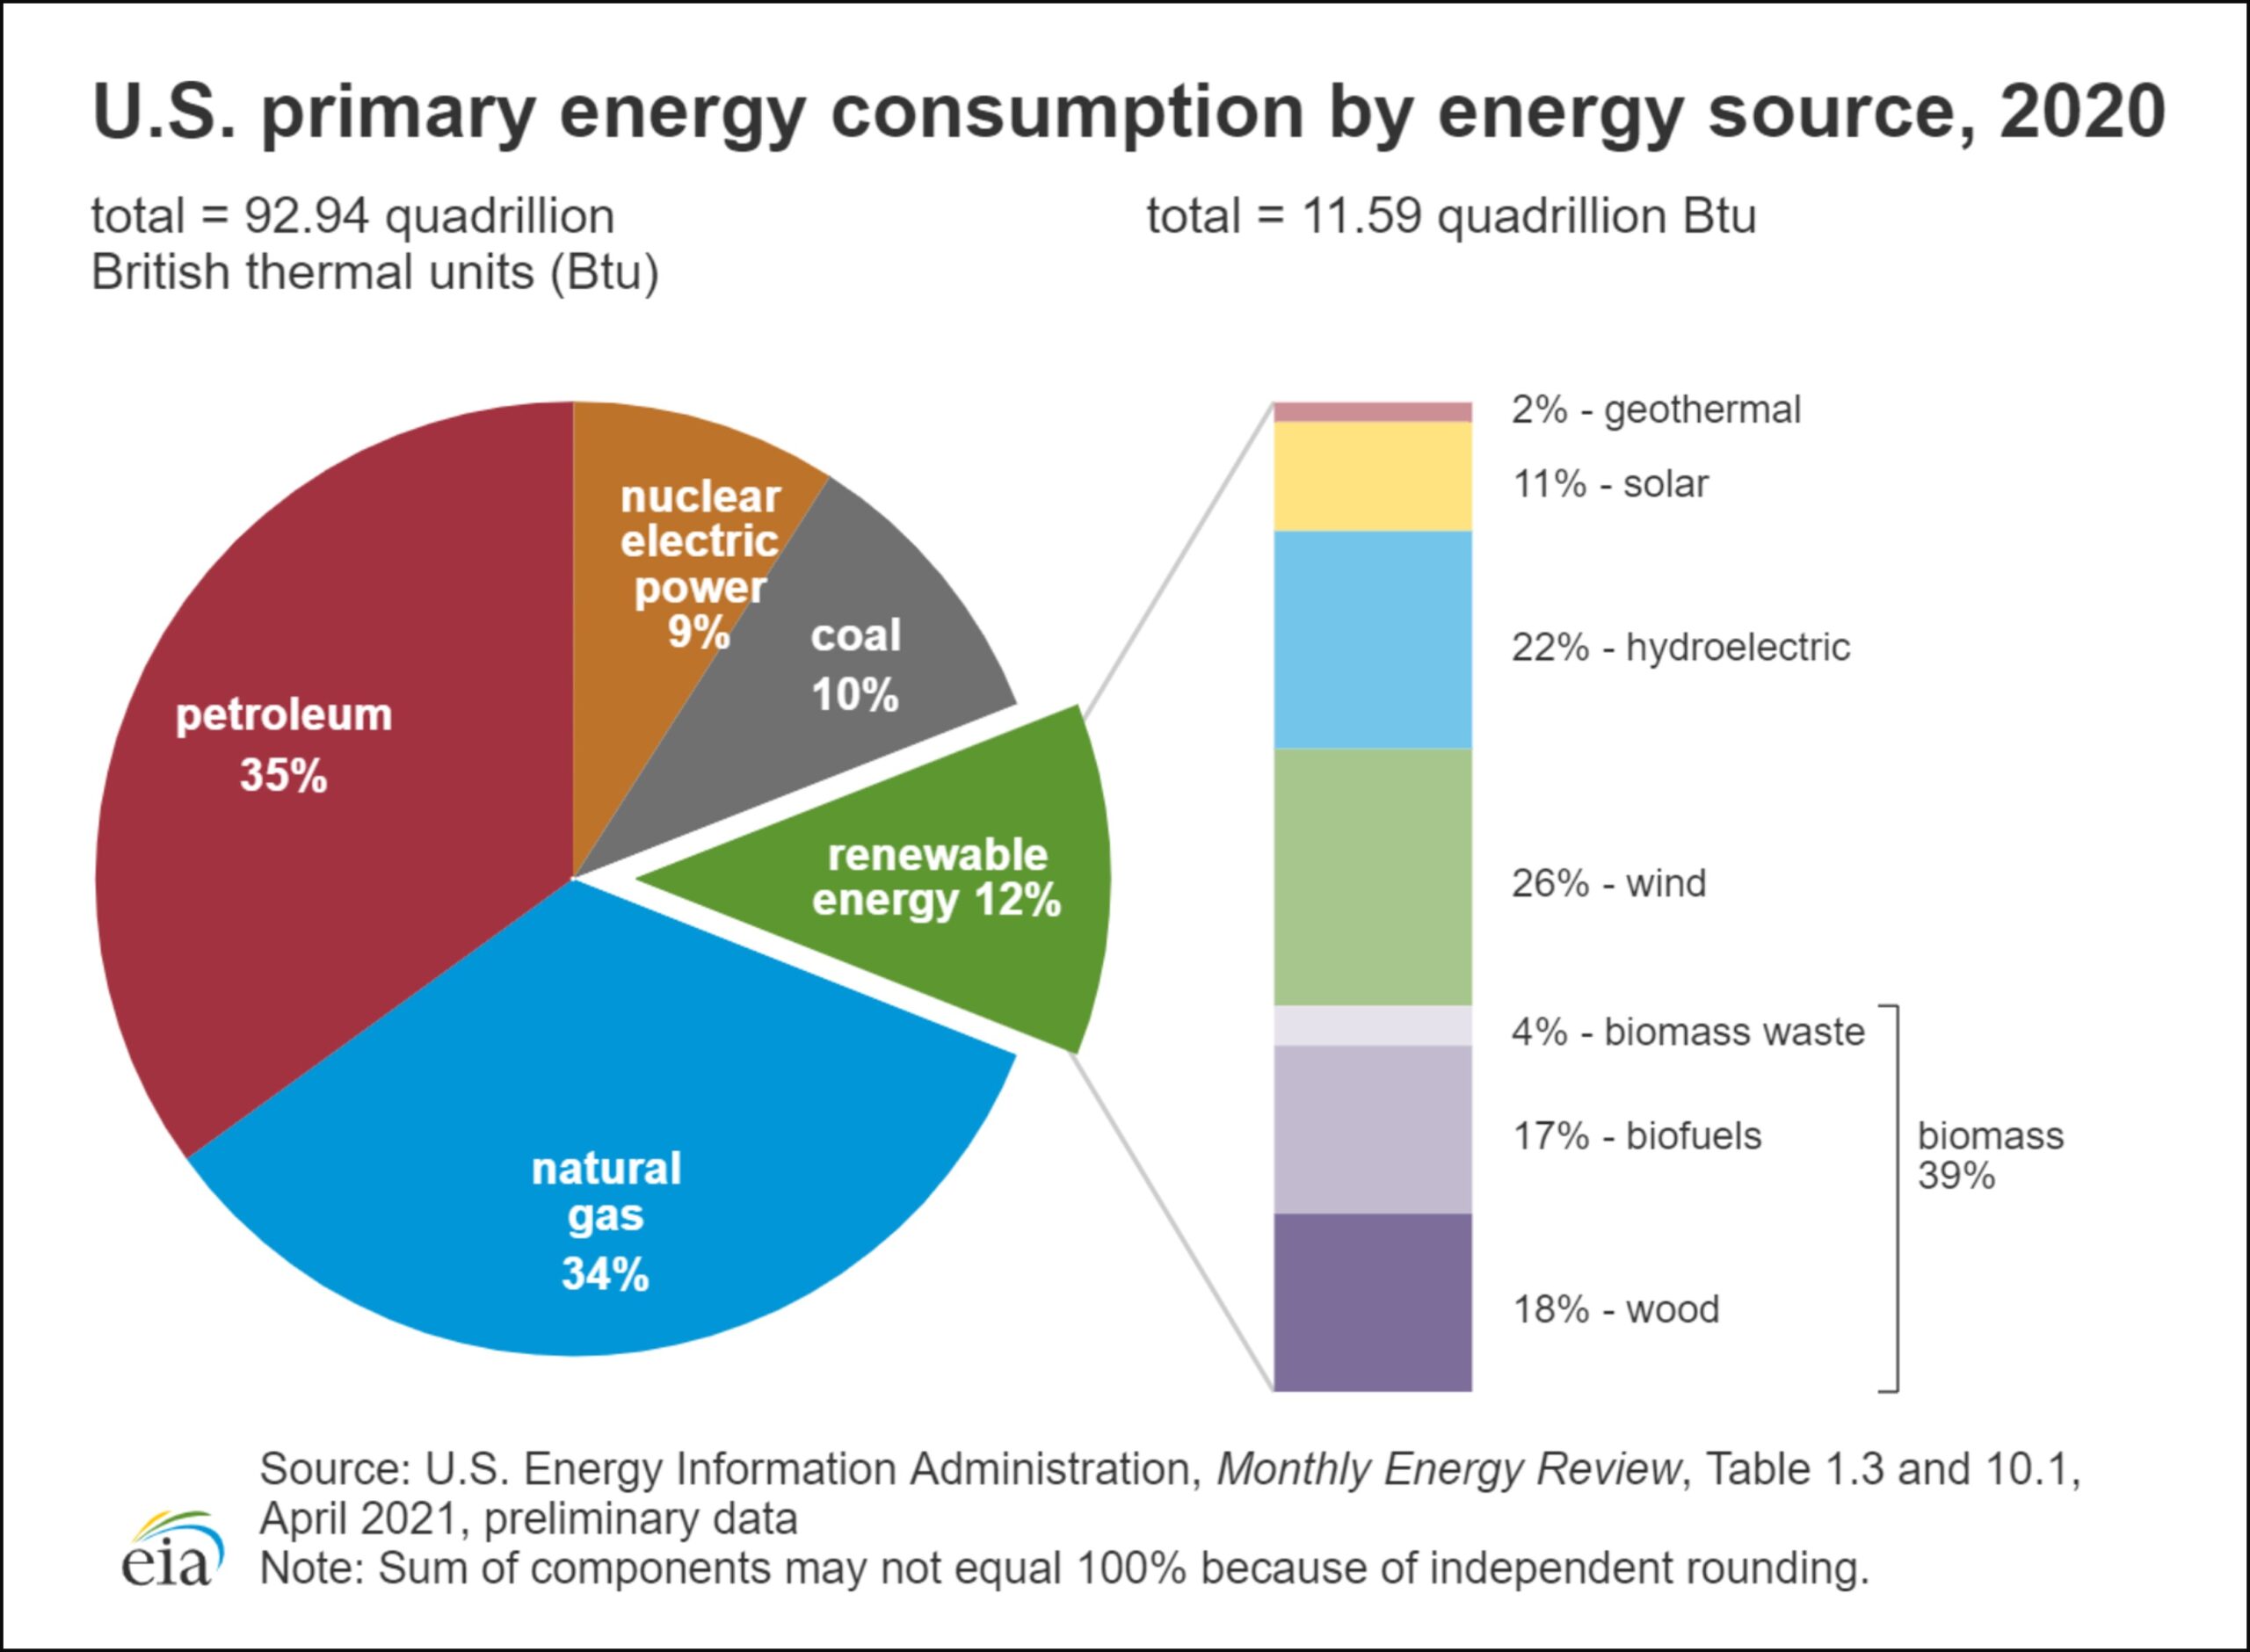
Renewable energy is energy that comes from sources that are naturally replenished. In 2020, renewable energy accounted for about 12% of US energy consumption, and it comes in many forms (see figure below).
Consumption of renewable energy has increased dramatically in the 21st century, and renewable energy consumption surpassed coal consumption in the U.S. in 2019 for the first time in over 130 years; see the figure below. Businesses and governments are discovering new methods of capturing, storing, and distributing renewable energy.
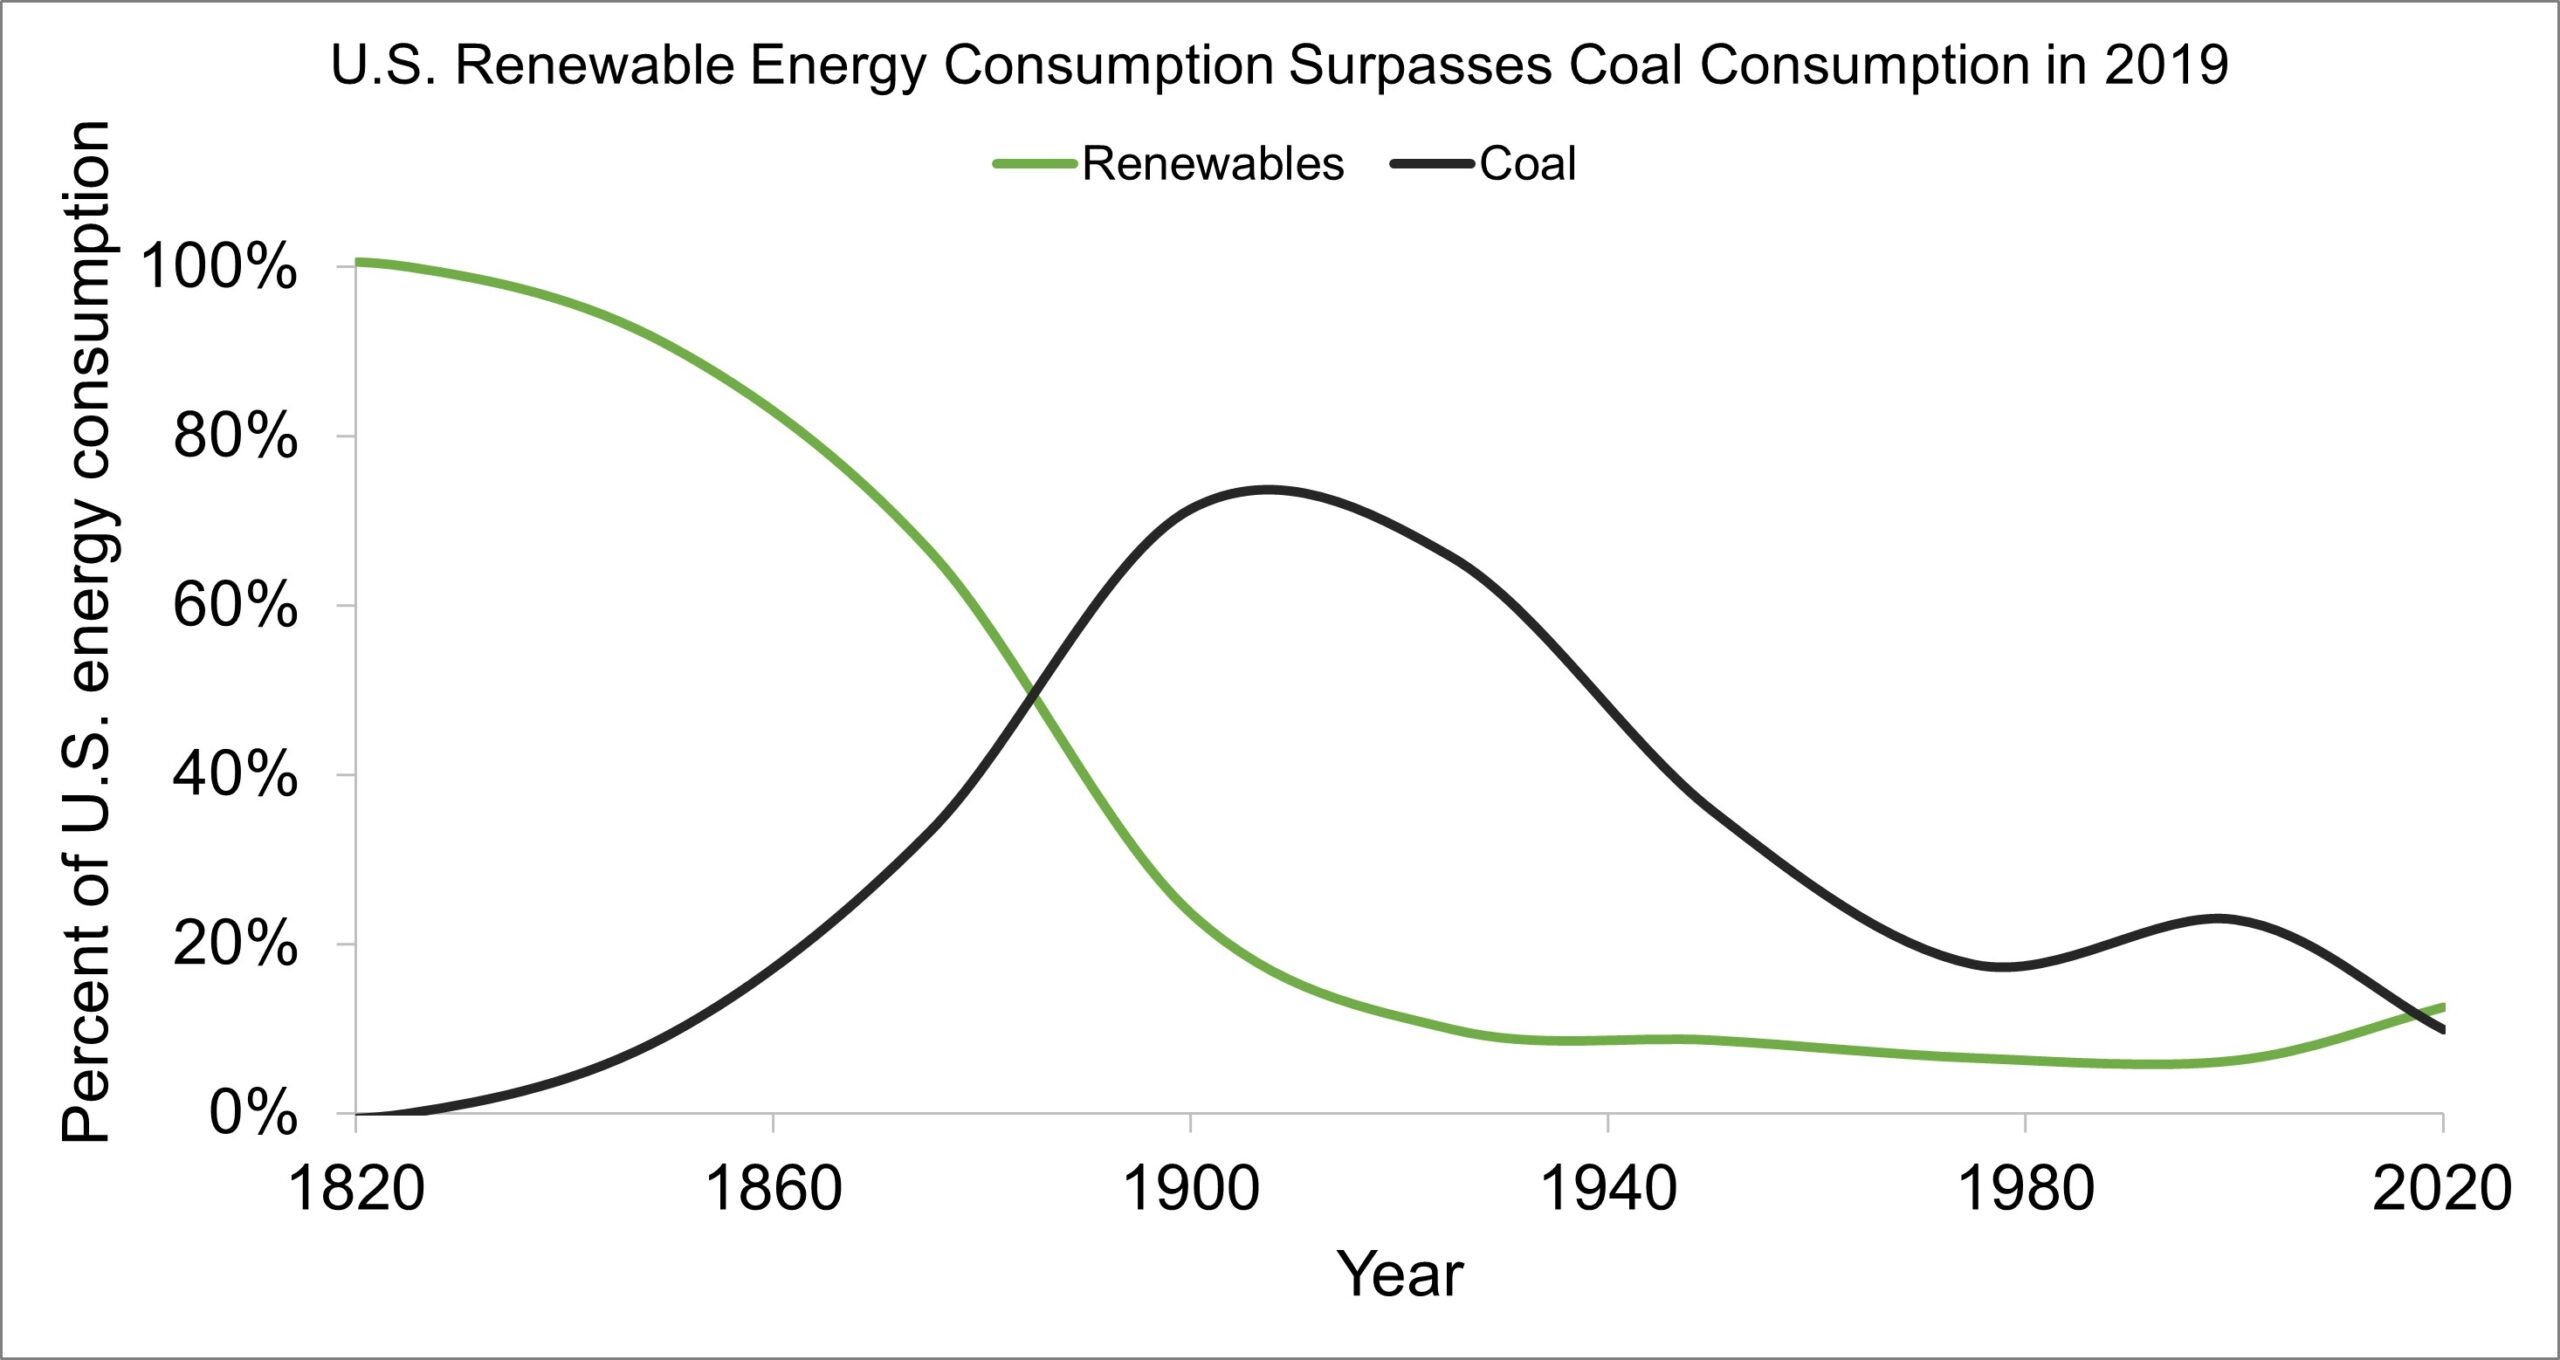
Image by Ingrid Zabel for PRI's Earth@Home project (CC BY-NC-SA 4.0 license), with data from the U.S. Energy Information Administration (eia.gov)
Biomass Energy
Biomass (see figure below) has many thousands (if not millions) of years of history as an energy source and as of this writing (2021) it is still the largest renewable source of energy. Wood and wood products account for just under half of US commercial biomass energy production, but it is now nearly equaled by biofuels (ethanol and biodiesel). Estimates of amount of wood used for commercial energy do not take into account home heating provided by wood burning. Energy from waste, including landfill gas, is also included as biomass. Landfill gas is a mixture of methane and other gases produced by microorganisms breaking down biomass within a landfill.
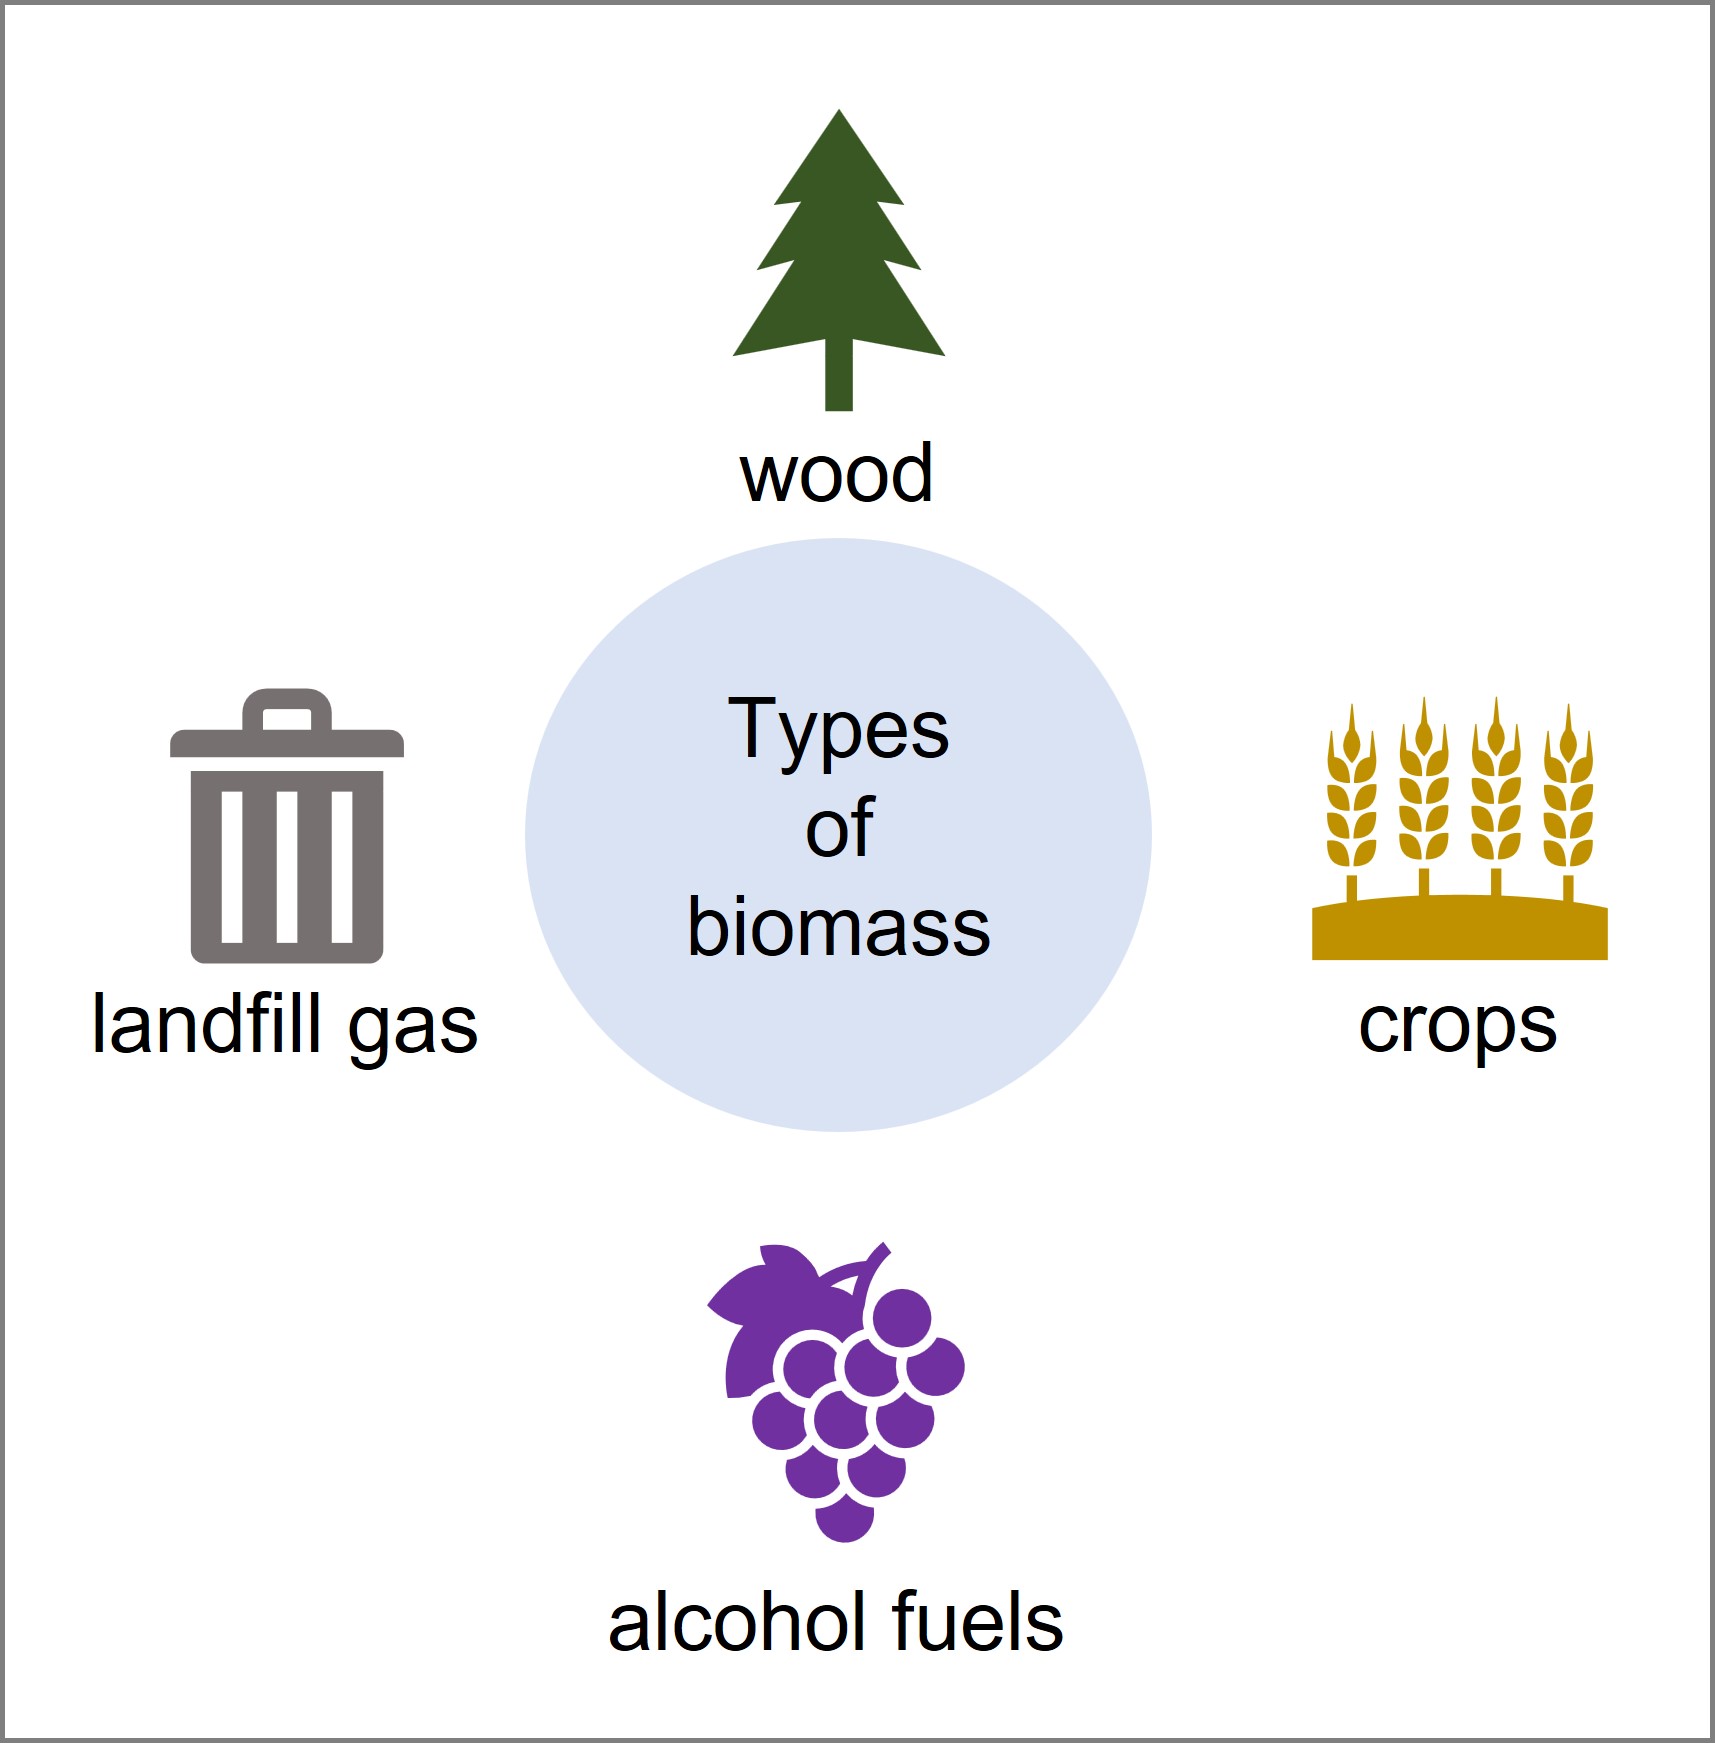
Diagram by Ingrid Zabel for PRI's Earth@Home project (CC BY-NC-SA 4.0 license), adapted from a diagram from the National Energy Education Development Project.
The burning of biomass, like fossil fuels, yields carbon dioxide and often other emissions, although in theory the carbon emitted into the atmosphere during the burning of biomass is balanced out by the carbon removed from the atmosphere during the growth of the biomass itself. This is because growing plants take in carbon dioxide from the atmosphere through photosynthesis. Not accounted for in this balance are greenhouse gas emissions associated with biomass production and transportation. Studies [Bond et al., 2013, Jacobson, 2014] suggest that the net effect of biomass burning is warming. This is because biomass burning releases soot and other particles— also known as black and brown carbon — that reduce sunlight-blocking cloud cover and make icy and snowy surfaces absorb more heat, warming the Earth.
Hydropower
Hydropower is the longest established renewable energy source used for electricity production, and still accounts for the largest portion of renewable electric generation in the US. The world’s first commercial-scale hydropower plant began operation at Niagara Falls, New York, in 1881. Hydropower accounts for about 7% of US electricity use, and because most substantial river systems have already been dammed for electricity use or their damming has been deemed too environmentally costly to pursue, there is little likelihood that the US can obtain much more energy from traditional hydropower [Manahan & Verville, 2005] The environmental costs include habitat destruction from flooding of gorges or valleys typically required for hydropower generation. Indeed, many hydropower plants have been removed in recent decades because of their impact on wildlife, particularly fish migration.
Hydropower works by converting the kinetic energy of falling water into mechanical energy to operate a turbine, which then generates electricity. Most hydropower is produced at large dams such as the Grand Coulee Dam in Washington (photo above), but hydropower generation is possible on a small scale from undammed streams and rivers. The calculation below gives an estimate of the power generated in a large dam.

Aerial view of the Grand Coulee Dam taken in 2016, on the Columbia River in Washington. Photo by U.S. Bureau of Reclamation (public domain via Wikimedia Commons)
Wind Power
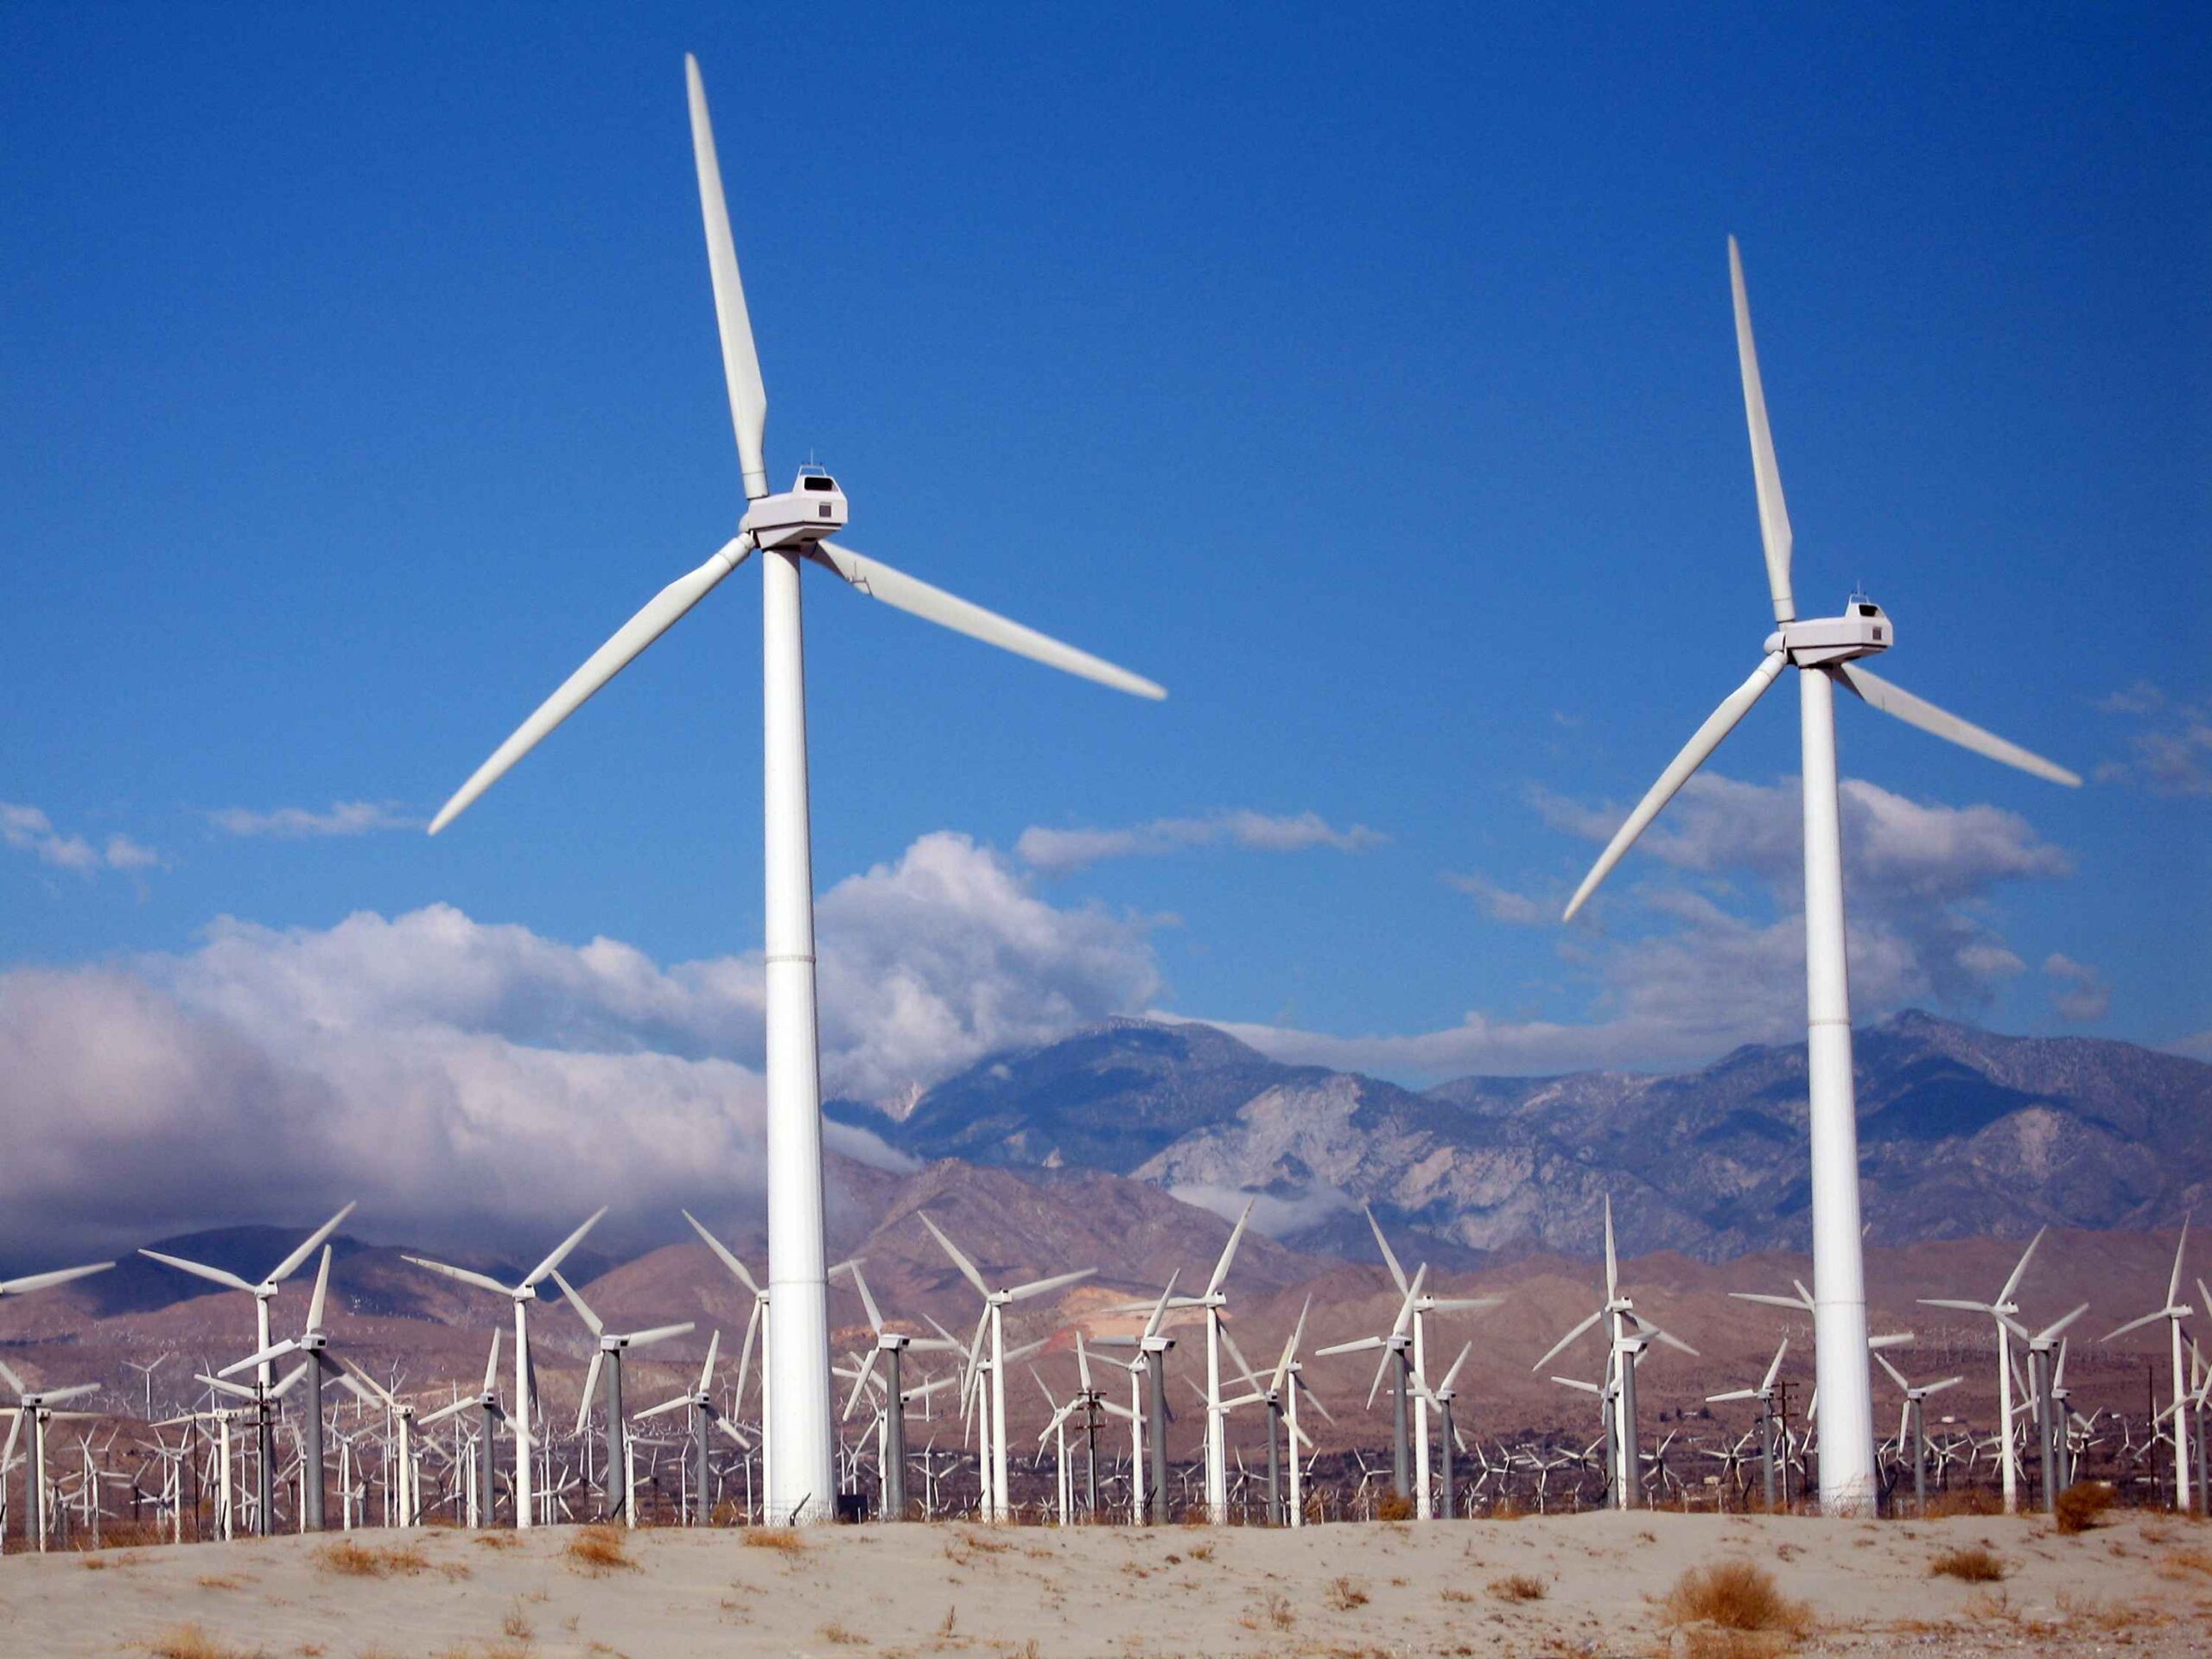
Wind power generation in the US rose from 6 billion kilowatthours in the year 2000 to 338 billion kilowatthours in 2020 [US Energy Information Administration]. Despite this rapid growth, wind power represented only 8.4% of all US electricity generation in 2020. Wind power generation is not uniformly distributed across the country; in 2020, just five states accounted for 58% of the US’s wind power generation—Texas, Iowa, Oklahoma, Kansas, and Illinois.
Wind power can be generated from land-based or offshore installations. Offshore wind power benefits from winds that are typically stronger over the ocean than on land, and installations can be built relatively close to big cities on the coast that use a lot of power, minimizing energy losses from transmission over long distances.
Wind power works by using the force of wind to rotate turbine blades, and the turbine converts rotational mechanical energy to electrical energy. The physics and economy of wind turbines favors the construction of large diameter blades. This brings permanent structures to rural landscapes that are scores to hundreds of feet high. Although impacts upon bird populations appear smaller than initially believed, current designs of turbines could have substantial impacts on bat populations.
"Kitchen Climate Science (In the Greenhouse #15)" by Paleontological Research Institution (YouTube). This video features a do-it-yourself activity on the science of wind power, using simple materials.
Geothermal Energy
Deep geothermal energy provides both direct heat and generates electricity, using Earth’s internal heat as an energy source. It has long been used on a small scale for heating where the heat release is high—at hot springs, for example. In recent decades, capturing Earth’s heat for power production has grown substantially, but it remains a small part of the global energy portfolio. Such deep geothermal energy systems sometimes use hydraulic fracturing to increase the flow of water through the rock, which regulates heat and controls energy production.
The use of small-scale, relatively shallow (less than 300 feet, or 91 meters) geothermal heat pumps is increasing for heating and cooling buildings. Many of these heat pumps are very shallow, placing fluid-filled pipes only about 6 feet (2 meters) down into the earth. These heat pumps, often called ground-source heat pumps, effectively preheat air in winter or precool cool it in summer, reducing heating and air conditioning costs in homes and other buildings. Heat pumps use a small amount of electricity to run their pumps and compressors, and if that electricity comes from zero-carbon sources, then heat pumps produce no greenhouse gas emissions. A typical ground source heat pump can be 400% efficient, meaning that the heat energy coming out of a heat pump is four times that of the input electrical energy required to run it. This efficiency is much higher than that of a very high-efficiency gas-burning furnace (~95%). These systems take advantage of nearly constant temperature (approximately 50–60°F) below the surface and do not require fracturing bedrock.
The video below delves into the science of how solar energy diffuses into and is stored in the Earth's subsurface, and how we can take advantage of this energy source.
Solar Energy
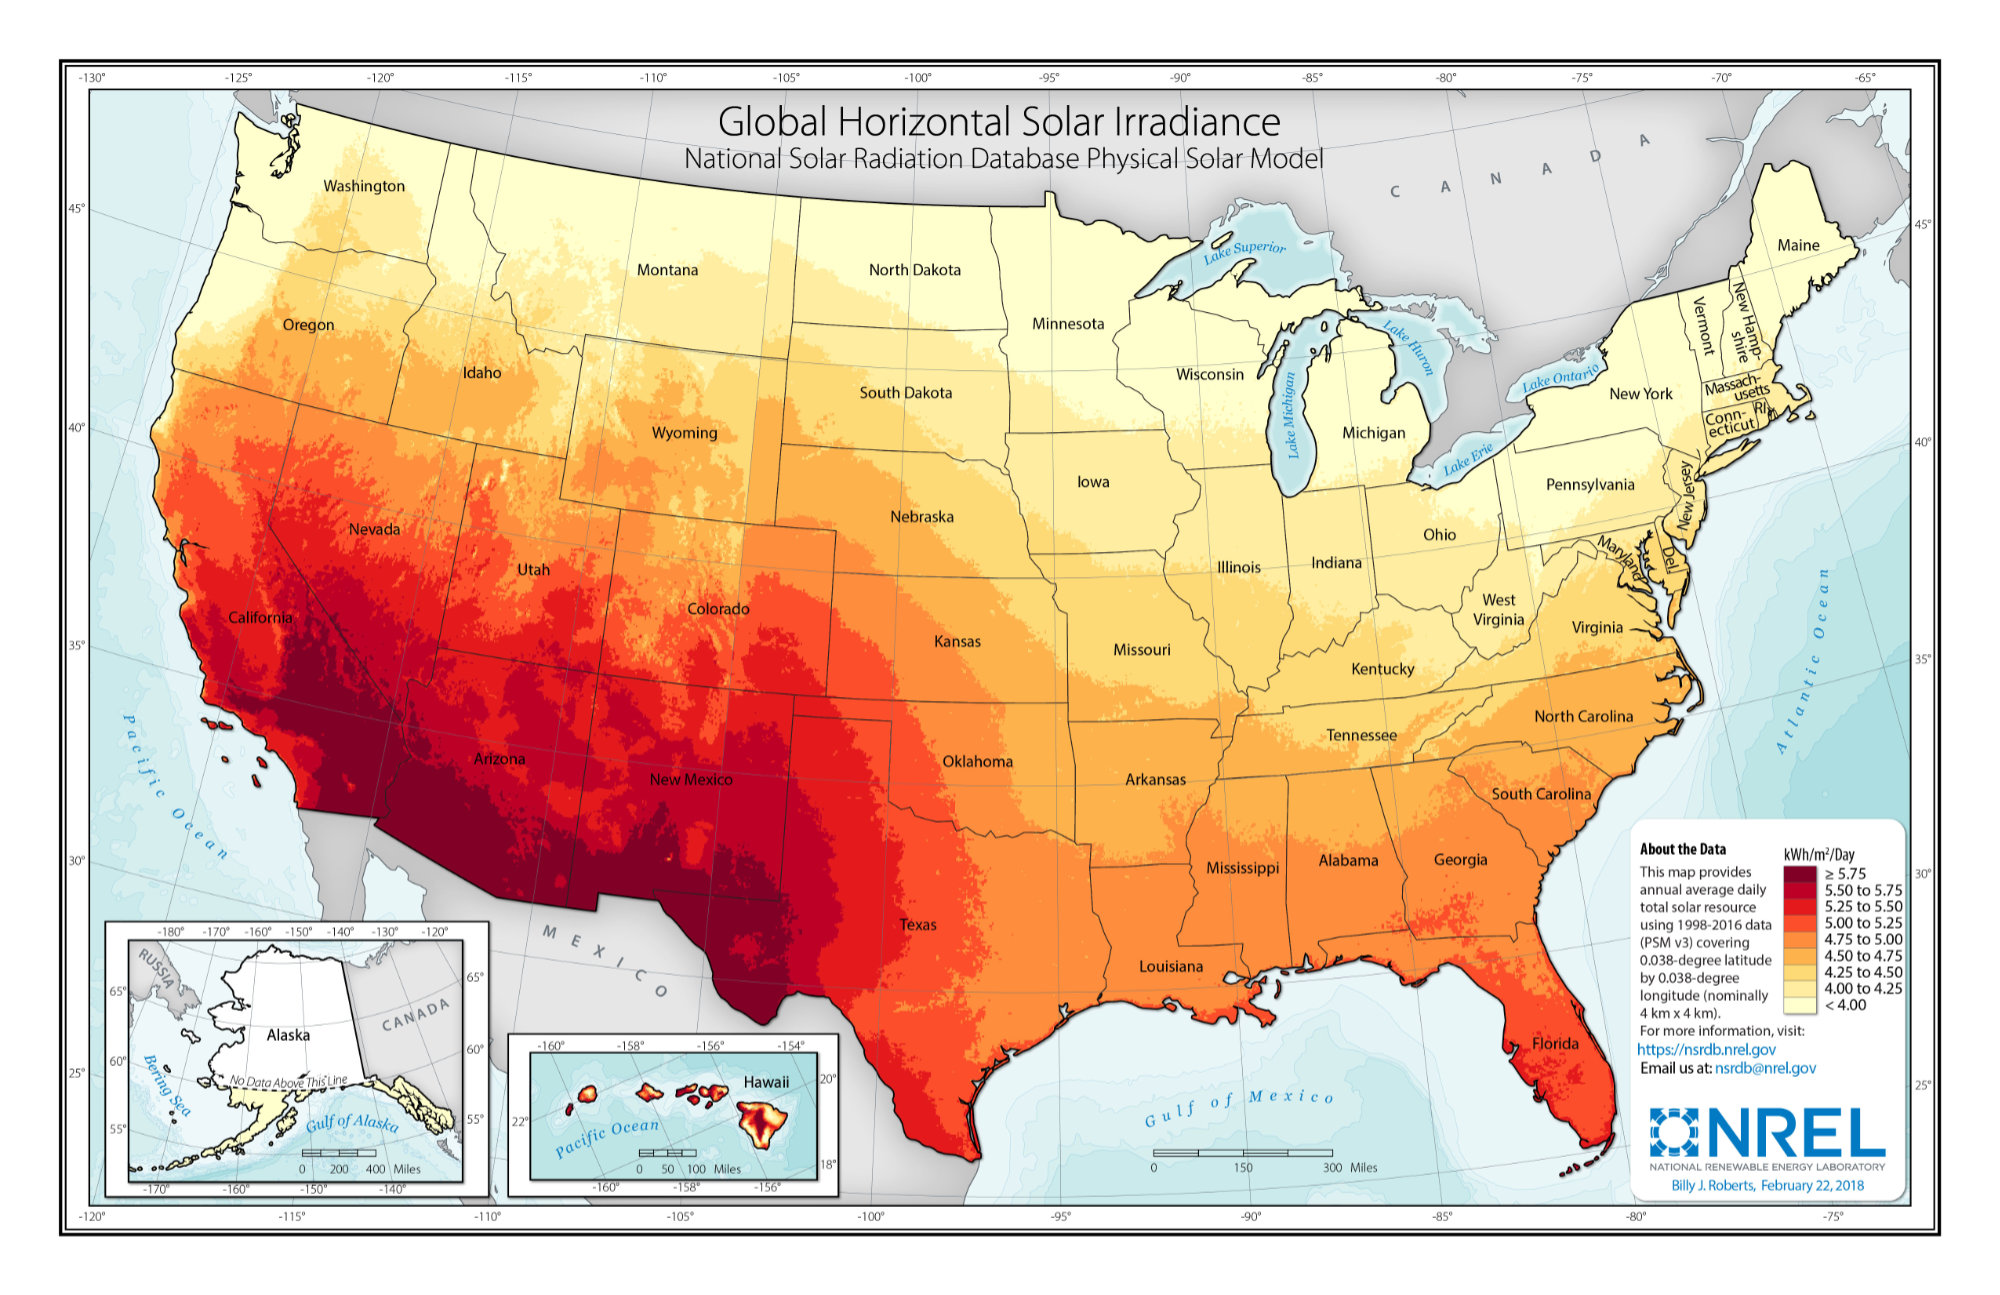
Solar power works in two ways: solar thermal uses the sun for heat, and photovoltaic cells (PV) convert light into electric current. Both types are growing rapidly, with U.S. solar energy consumption increasing by a factor of almost 20 from the year 2000 to the year 2020 [US Energy Information Administration]. The map below shows the solar energy potential for the United States. Not surprisingly, the southwest US, Florida, and Hawaii are the sunniest regions, but even northern states have potential for solar energy.
Both solar thermal and PV systems can range in scale from very small household systems to very large power plants. Further, passive solar building design coupled with good insulation and control of airflow can eliminate or practically eliminate the need for heating systems. Options such as community solar now exist, where people who cannot put solar PV panels on their roof or in their yard can still access solar-generated electricity through a subscription plan or purchasing a panel at a solar farm. This option is excellent for people who rent their homes.
Accessible solar energy? Community solar! #shorts (Climate Solutions, in No Particular Order: 3. Community Solar) by Paleontological Research Institution (YouTube)
Energy independence and big savings! #shorts (Climate Solutions, in No Particular Order: 13. Rooftop Solar) by Paleontological Research Institution (YouTube)
Solar energy produces no emissions once systems are installed, but there are concerns about the manufacture and disposal of photovoltaic solar cells, and related to the mining practices that harm people and the environment—particularly outside the US—of rare earth metals used in PV and battery production. Whether a commercial-scale solar energy installation generates heat or electricity, it must cover and industrialize considerably more physical area compared to other kinds of power plants that generate the same amount of energy, although smaller-scale solar energy systems can be roof-mounted, reducing these concerns.
"NREL Energy Basics: Solar," about the history of solar power. National Renewable Energy Laboratory (NREL) (YouTube)
Nuclear Energy
Carbon emissions from nuclear energy are very low compared with fossil fuel sources, and are comparable to those from renewable energy technologies such as solar and wind. It is important to consider the greenhouse gas emissions across all stages of a method’s or product’s life cycle when making comparisons. The US National Renewable Energy Laboratory (NREL) provides a comparison of life cycle greenhouse gas emissions for different types of electricity generation in this handout. As with renewable energy technologies, most of the emissions come from processes that occur ahead of operating a power plant, i.e., from extracting and transporting raw materials and constructing the plant.
Nuclear power is produced by the fission (“splitting”) of the nuclei of relatively heavy atoms, such as uranium (see figure below). Nuclear fusion, a different form of nuclear energy, is still under development and is unlikely to operate at a large scale until the second half of the 21st century, if even then.
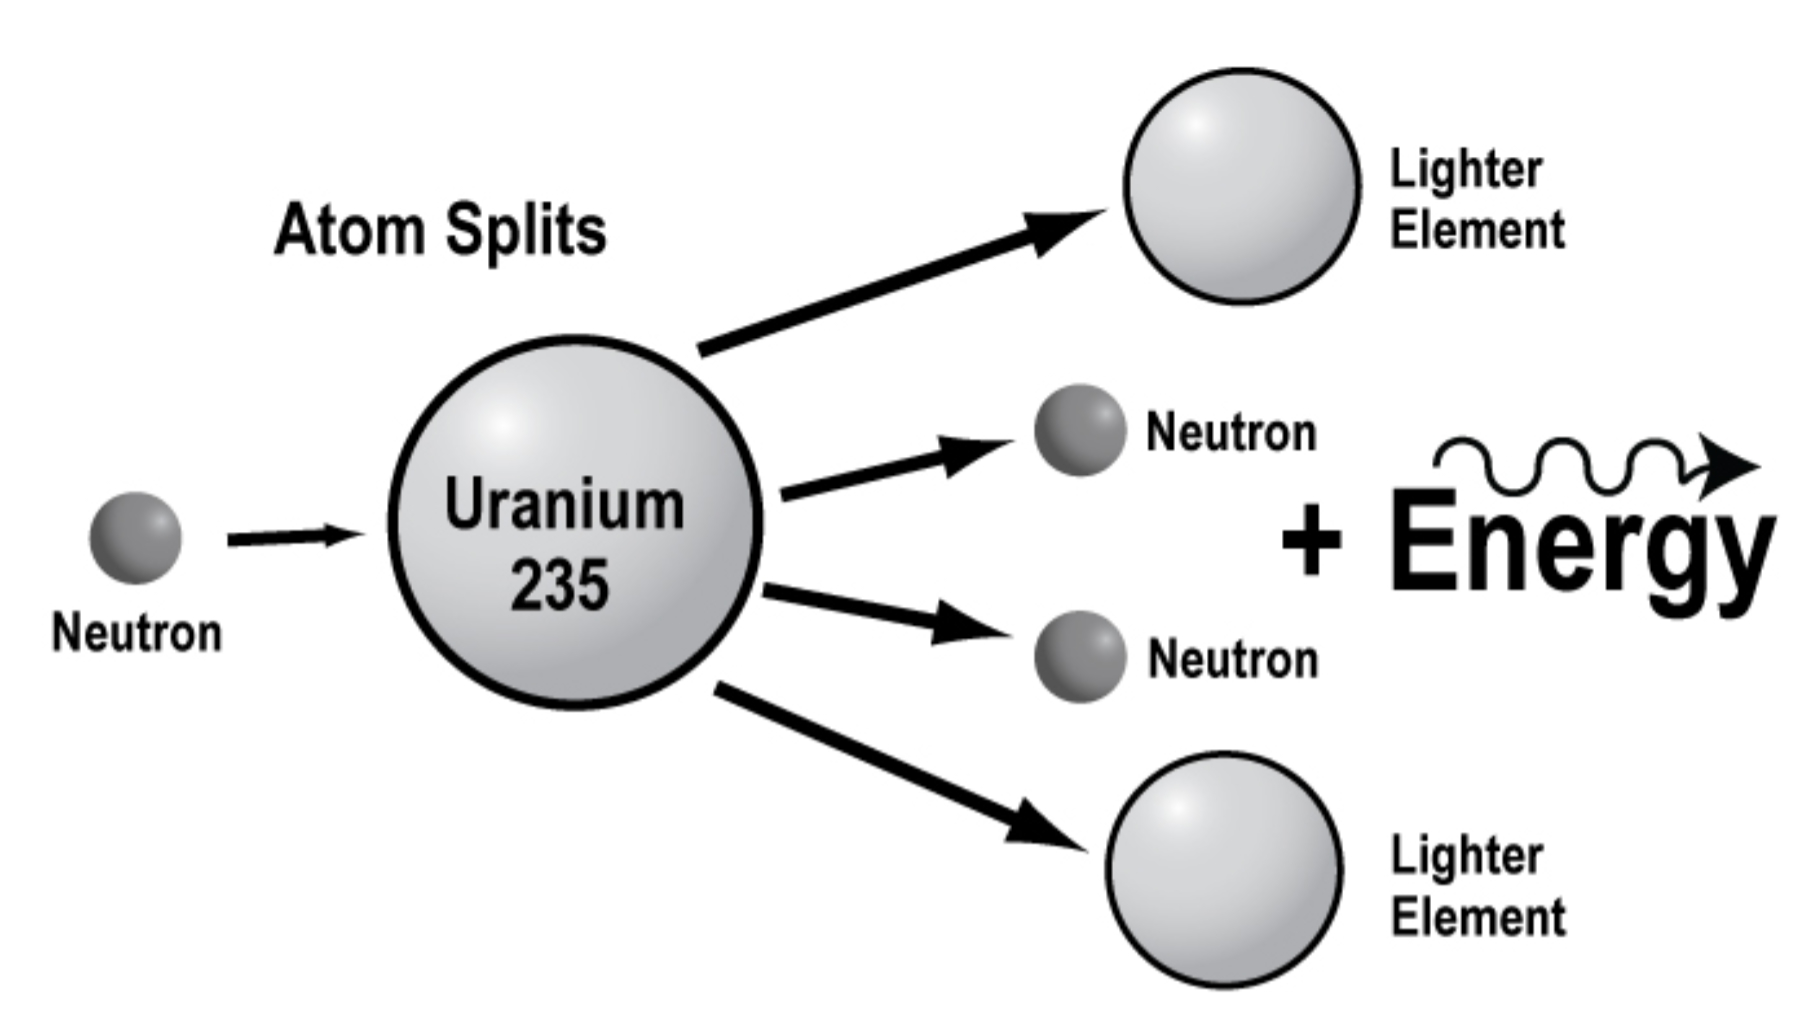
Diagram of the process of nuclear fission. A neutron is fired into the nucleus of a uranium atom, which then splits into nuclei of lighter elements and additional neutrons. Energy is released in this process. The additional neutrons then collide with other uranium nuclei and the process repeats in a chain reaction. Source: National Energy Education Development Project
Typically, the method for electricity production from nuclear fission is similar to that from fossil fuel power plants—the energy from nuclear reactions (rather than fossil fuels) is used to boil water that produces steam to turn turbines. In 2020 nuclear power accounted for 20% of US electricity generation.
Nuclear power has only been a commercial source of electricity since 1957 and its substantial growth stopped (or paused) in the United States in the late 1970s as a result of a combination of prohibitive economic costs and environmental concerns. These concerns were highlighted by the 1979 accident at Pennsylvania’s Three Mile Island nuclear generating station, and the ongoing problem of long-term management of highly toxic, long-lived nuclear waste. There were no documented deaths associated with Three Mile Island, the US’s best-known nuclear accident, but later catastrophic nuclear power plant accidents at Chernobyl, Soviet Union and Fukushima, Japan have continued to raise concern about nuclear power.
While accidents in the nuclear industry are rare, the ones that have happened have been extremely dangerous. And while technological advances have drastically cut the amount of radioactive waste used by newly designed nuclear power plants, there are still many costs and environmental concerns. An interesting analysis and comparison of the safety and carbon emissions from different energy sources is found at Our World in Data: What are the safest and cleanest sources of energy?
Humans are not always good at analyzing and comparing risks at different scales. For instance, would you rather live near a nuclear power plant that produces 100% clean energy, but has a one-in-a-million chance of having a meltdown, or would you ban all nuclear power plants, but rely on fossil fuels that are changing the entire planet’s climate? This is a difficult problem to quantify and compare: the risk of a nuclear meltdown is catastrophic for the people who live nearby, while the risk of burning fossil fuels is applied around the world, gradually over time.
There's No Such Thing as a Free Megawatt!
One large nuclear plant produces the same amount of electricity as 545 large, offshore wind turbines or a solar farm that covers a land area of 170 square kilometers (65 square miles, the equivalent of 31,500 football fields.)* It is not a simple question to determine the most environmentally benign energy source, and the answer can vary depending on local contexts. There is no such thing as a free megawatt, which is why efforts to increase our energy efficiency are so important. The environmental impact of an energy source is a complicated issue, and although it is clear that some energy sources are more environmentally friendly than others, all commercial-scale energy production has negative environmental impacts. For any energy source, there is a wide range of factors to consider and those factors should be considered not in isolation but in contrast to current or likely future energy practices.
To dive deeper into these ideas, see a presentation by Don Haas published in the Journal of Sustainability Education Vol. 8, Jan. 2015, and freely available online here.
* These numbers assume that a large nuclear plant produces 6 GW of power (similar to the Bruce Nuclear Generating Station in Ontario, Canada), an offshore wind turbine produces 11 MW, and 7 acres of land (0.028 km2) are needed for each 1 MW of power produced by a solar farm.
Energy Efficiency and Conservation
Energy efficiency and energy conservation measures may be the most important and effective mitigation actions we can take. Energy production and use are by far our biggest contributors to greenhouse gas emissions. According to the US Energy Information Administration (eia.gov),
Our success in mitigating climate change will depend on finding ways to use less energy and different energy. This section explores strategies for using less energy.
Buildings
Buildings are one of the sectors with the biggest potential for energy savings. Buildings use energy for heating, cooling, lighting, and other electrical systems, and, according to the US Energy Information Administration, residential and commercial buildings accounted for 38% of the US’s total energy consumption in 2017.
One large-scale mitigation initiative that addresses energy use in buildings is the 2030 Challenge. Launched by a group of architects, the 2030 Challenge asks the building design and construction community to set a series of goals for new buildings and major renovations. The final goal is to design buildings so that by the year 2030 they use no fossil fuel energy to operate. Strategies for doing this include innovations in design that reflect heat away from buildings in the summer or trap heat in the winter, generating power on-site using renewable sources, or purchasing renewable energy (up to a 20% limit). Many cities, including large ones such as Seattle, Pittsburgh, Denver, Dallas, Cleveland, and Los Angeles, have set up 2030 Districts within their boundaries where they have committed to meeting their goals.
The use of green infrastructure is a mitigation strategy for buildings and communities. Green infrastructure refers to structures that use plants, soil, and other natural features to perform functions such as providing shade, absorbing heat, blocking wind, or absorbing stormwater. Green infrastructure can also help us adapt to climate change hazards such as heat waves and heavy rainfalls. As a mitigation tool, green infrastructure helps to reduce energy use.
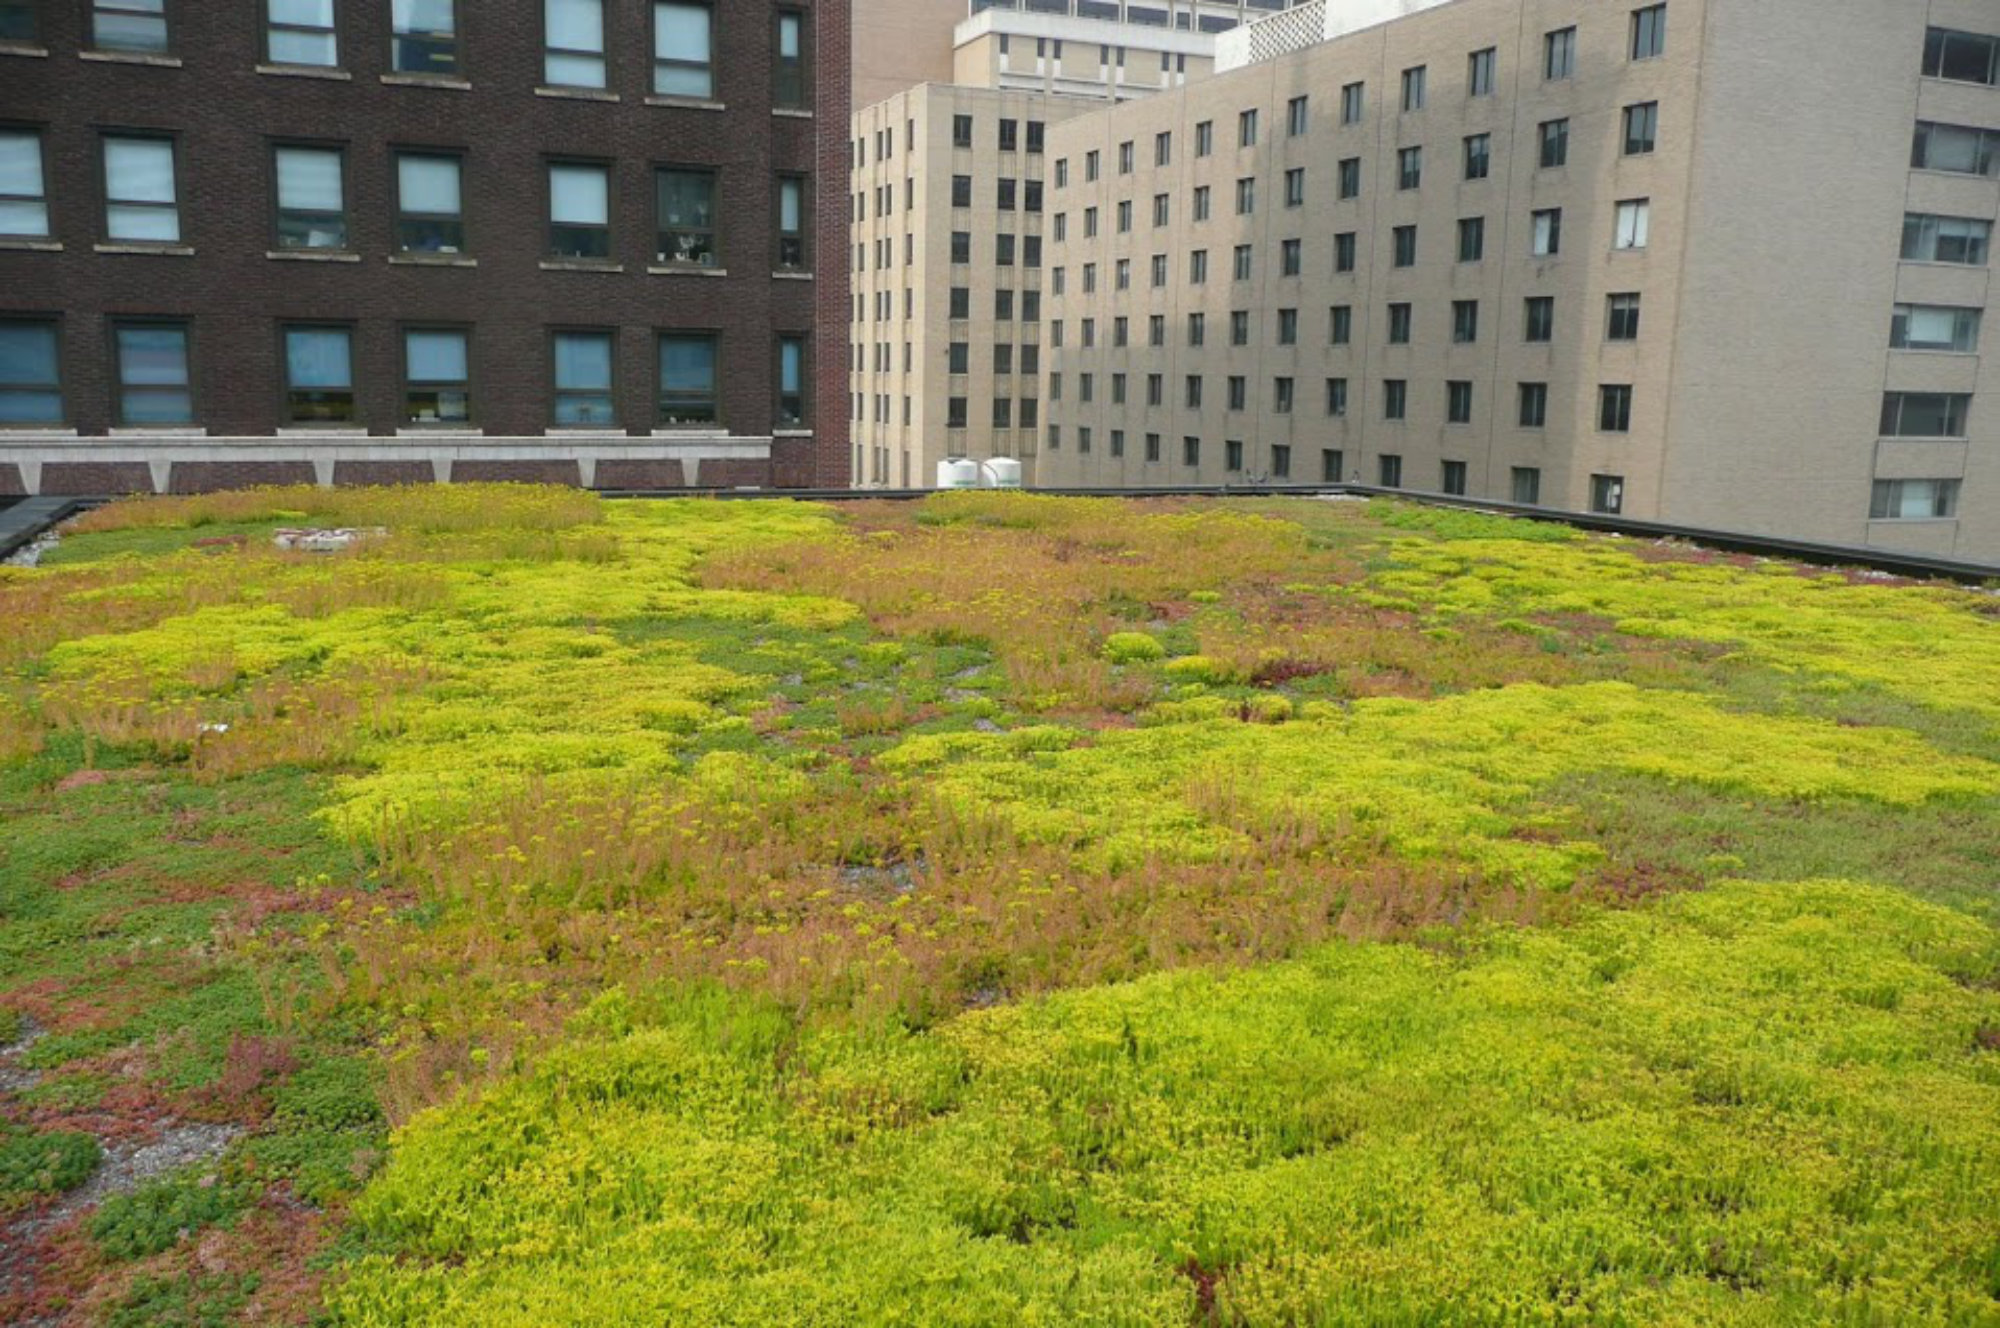
Anyone who has walked through a neighborhood with tree-lined streets on a hot summer day has felt the cooling effect of plants. Trees reduce the need for air conditioning by providing shade. Trees and other plants also cool the air itself through evapotranspiration. Studies have shown that the presence of mature trees in a suburban neighborhood can have a cooling effect of 4 to 6°F (2 to 3°C). Another energy-saving type of green infrastructure is a green roof—a roof with a layer of plants growing on it. The plants shade the underlying roof and the layer insulates the building, reducing energy costs for cooling and heating.
Green infrastructure can also save energy when it is used to conserve water, recharge groundwater, and prevent sewer system overflows during storms, because managing water uses energy. In most cities electric water pumps are the largest portion of municipal electric use; the exceptions are cities with electrified mass transit, which uses a lot of electrical energy. A Congressional Research Service Report [Energy-Water Nexus: The Water Sector's Energy Use] found that estimates for water-related electric use ranged from 4% to 13% of US electric generation, depending on different factors included in the analyses, and demand varies substantially with geography. According to the EPA, the activities of drinking water and wastewater utilities in the US result in about 116 billion pounds of CO2 emissions annually.
Certification and ratings systems can be very useful for architects and builders as well as for consumers in figuring out how to save energy in buildings. LEED (Leadership in Energy & Environmental Design) is a green building certification program that provides guidance and recognition for those wanting to create energy-efficient buildings. ENERGY STAR ratings help consumers choose appliances such as dishwashers, refrigerators, computers, and furnaces that use less energy. The US EPA reports that between 1993 (when the ENERGY STAR program began) and 2012, the program prevented the emission of 1.9 GtCO2eq of greenhouse gases.
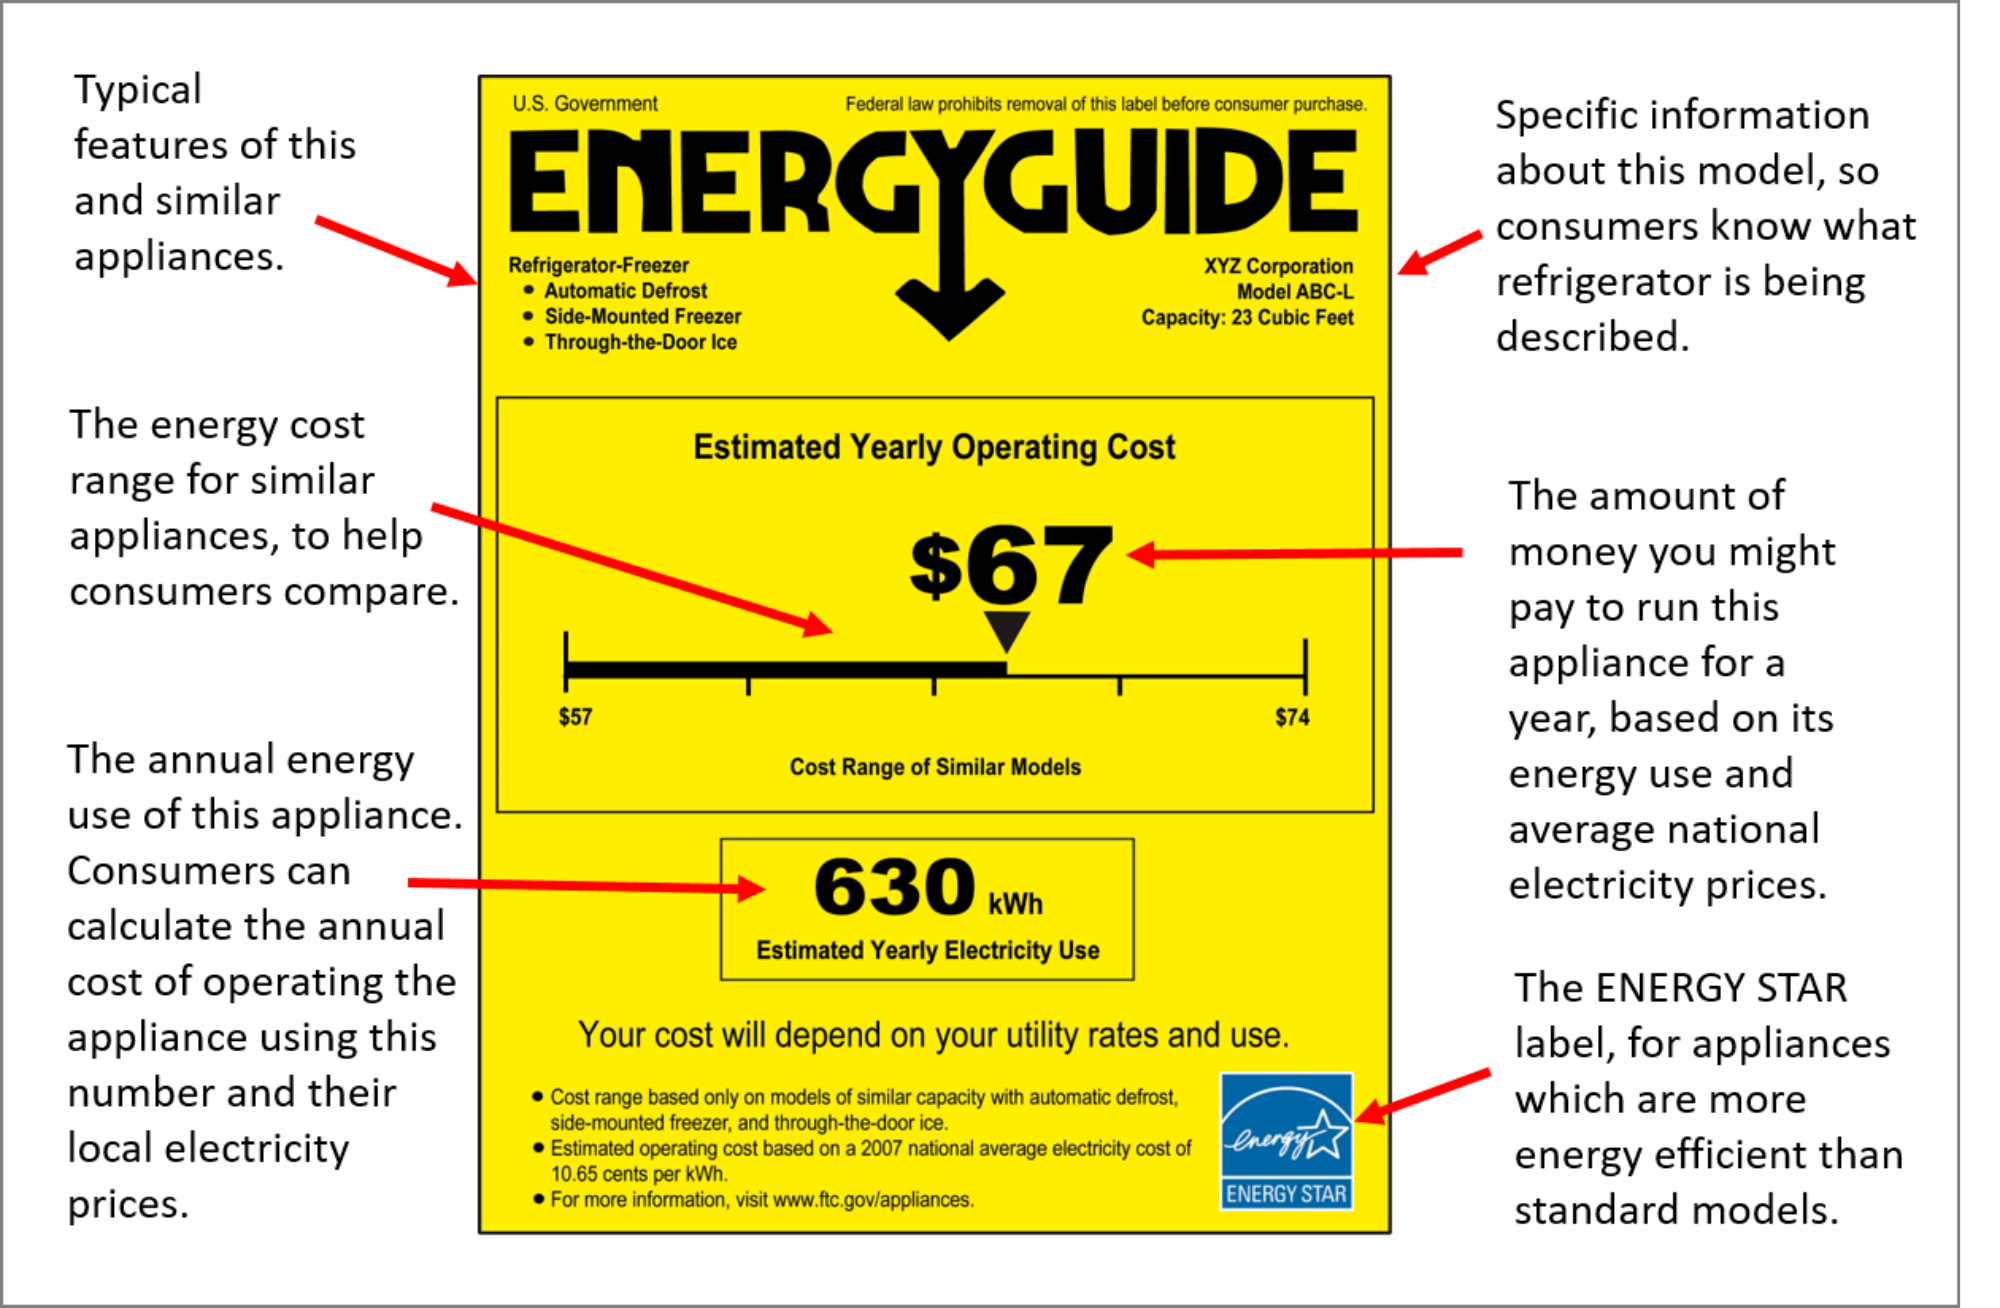
The US Federal Trade Commission runs a program that provides Energy Guide labels for many types of appliances, to help consumers make purchasing decisions that lead to energy savings. Above is an example of an Energy Guide label for a refrigerator.
Transportation
In 2020, the transportation sector was the biggest contributor to the US’s energy-related greenhouse gas emissions, accounting for 36% of the total [eia.gov]. The transportation sector also is a primary source of other kinds of emissions that degrade air quality and threaten human health. Reducing transportation emissions will both mitigate future climate change and improve air quality and human health. Such benefits that go beyond reducing emissions are sometimes referred to as a co-benefits. Increasing efficiency and reducing emissions in the transportation sector has tremendous potential.
We can save energy at the individual level by driving less: carpooling, combining errands into fewer trips, and walking, biking, or taking public transportation instead of cars. The vast majority of adult Americans drive to work alone, as illustrated in this visualization. We can also choose to buy products that involve less transportation, such as buying locally- or regionally-grown produce instead of imported fruits and vegetables. When we do drive, we can use less energy by not idling, driving at lower speeds on the highway, keeping tires properly inflated, and doing regular maintenance. We can choose to buy more fuel-efficient cars. Sometimes we can choose to live in neighborhoods where employers, services, and activities are close by and require less driving. Sometimes some of us can choose to work from home.
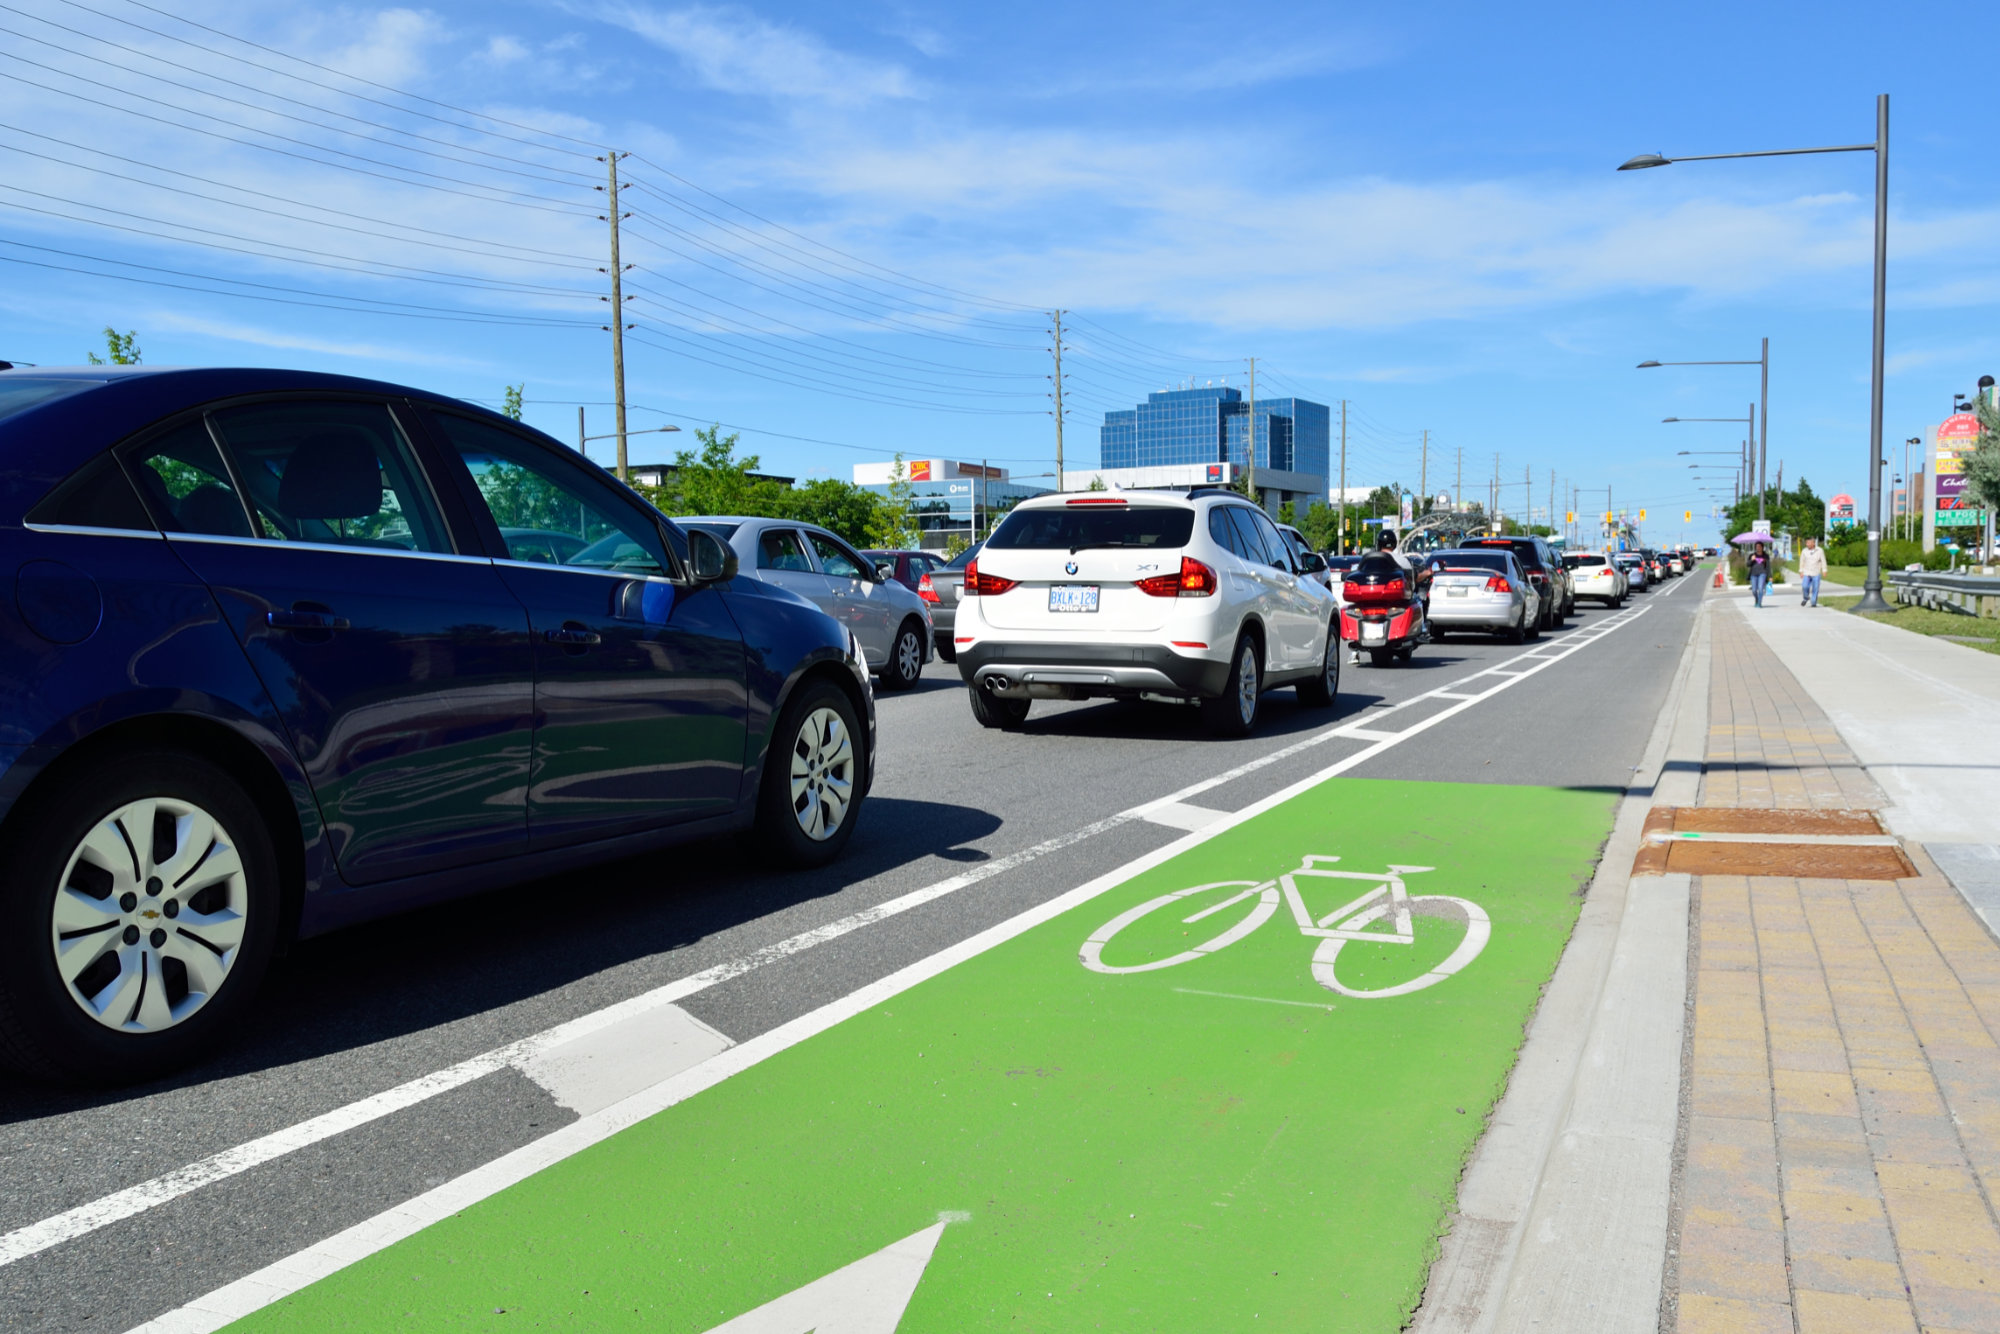
On a larger scale, we can make societal decisions to reduce our transportation energy use. For example, cities can choose to build public transportation networks so we use less energy driving individual cars, or cities can build infrastructure that makes it easier to ride a bicycle (see photo below). Cities such as Minneapolis, MN, San Francisco, CA, and Portland, OR, are often at the top of lists of bike-friendly cities in the US, because they have built infrastructure to make bike riding easier and safer. Communities can choose to develop neighborhoods where jobs and stores are close to where people live. Businesses can create incentives and mechanisms for employees to telecommute and carpool. Governments can set fuel efficiency standards for vehicles. Most of these changes, both on the small and large scale, not only reduce energy demand and therefore emissions, but also contribute to good health and save money.
Many technologies exist today that can increase the fuel efficiency of vehicles. One example is turbocharging, where engine exhaust is re-used to run a fan that blows compressed air back into the engine’s cylinders. Combustion requires air and fuel, and the addition of more fuel together with the compressed air results in combustion that generates more power with each explosion in the car’s cylinders. Technological advancements together with policies that set fuel economy standards could lead to passenger cars that achieve 53 miles per gallon (mpg) and light trucks that reach 38 mpg before the year 2030. [US Energy Information Administration]
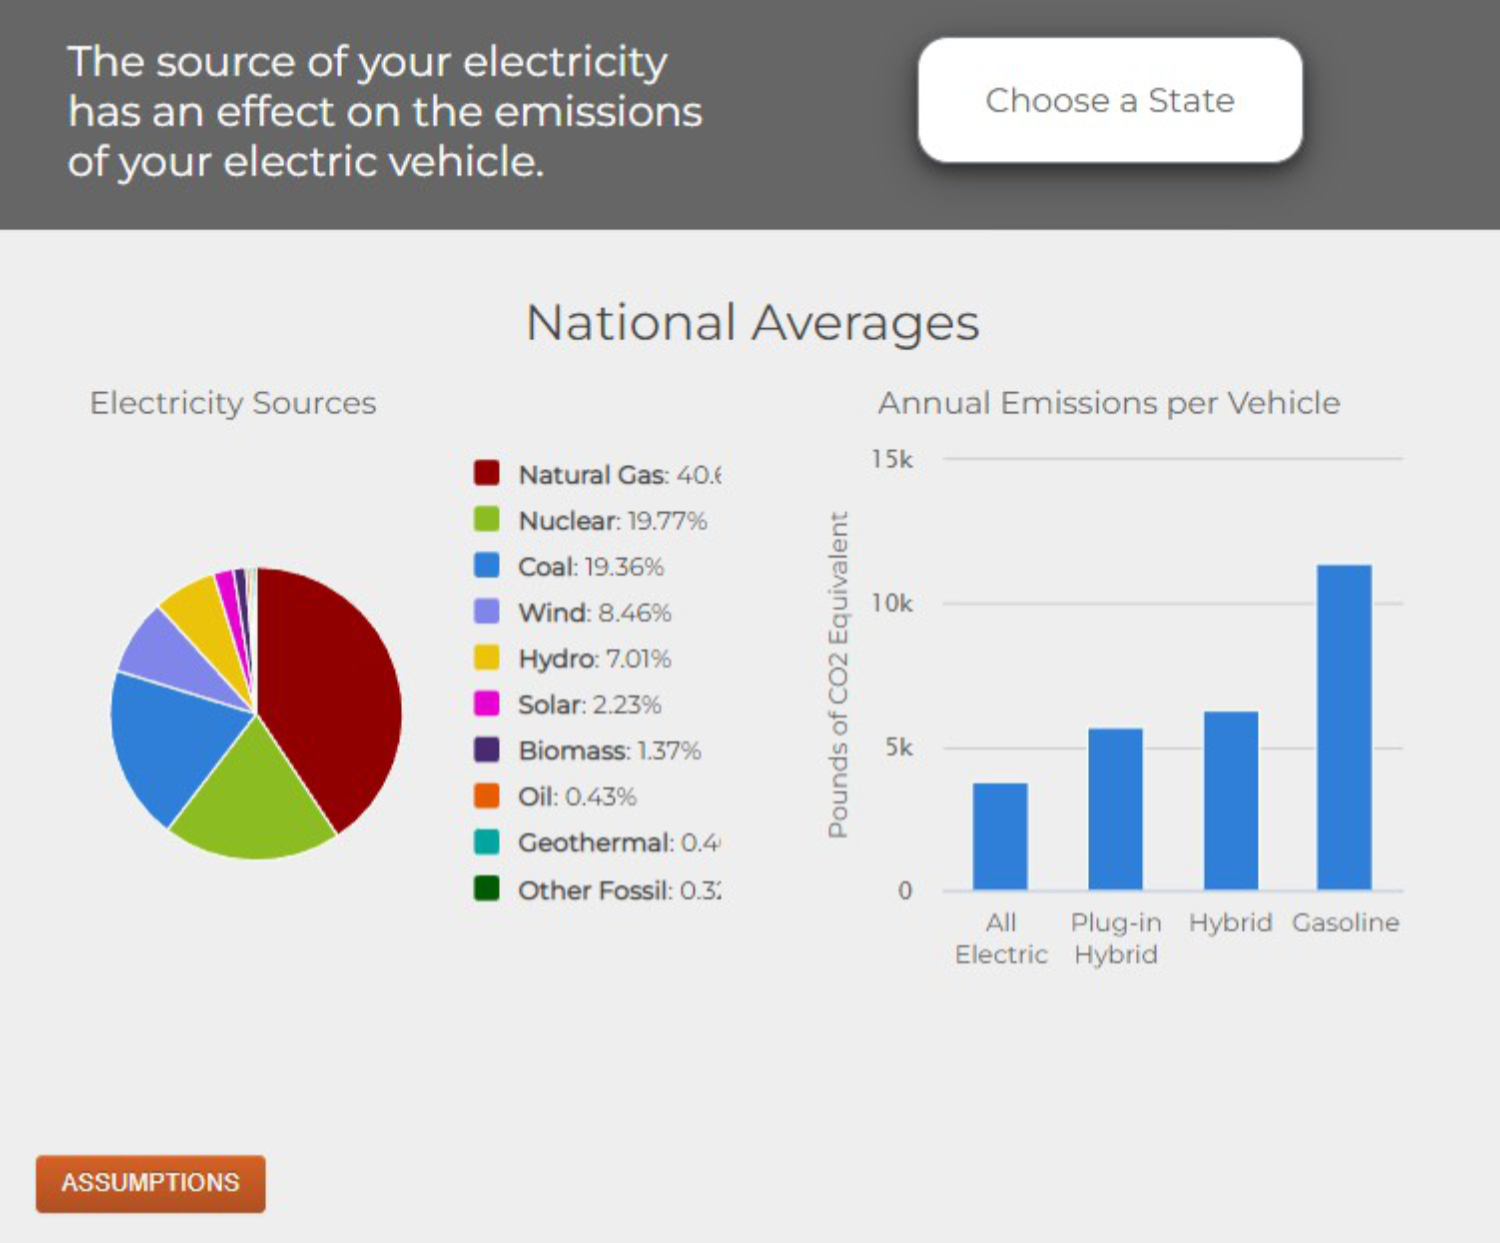
Electric cars (EVs) are much more energy-efficient than gasoline-powered cars. According to the US Department of Energy,
An interesting technology to consider when discussing reduced energy use in transportation is driverless cars. Driverless cars on a smart transportation network might use less energy for several reasons. Because they remove human error they presumably wouldn’t require as many safety features and could be built out of lighter materials, and a lightweight car needs less energy to run than a heavier one. They can be programmed to drive in ways that minimize energy use, unlike human drivers. Groups of driverless cars could take advantage of aerodynamic advantages like drafting, where cars following close behind a lead car benefit from reduced air resistance. Driverless cars also have the potential to reduce the demand for everyone to own their own vehicles, not only reducing the energy use for vehicle production, but also allowing the conversion of parking spaces to other uses. On the other hand, people might use driverless cars more than they use conventional cars because of the benefits and conveniences, and this could cancel out energy savings (this dilemma is sometimes called Jevon's Paradox.) It remains to be seen whether driverless car networks will come into existence and what their energy impact will be.
Efficiency improvement efforts in air travel include changing the shape of airplanes and their wings to reduce drag, using lighter materials to reduce weight, and designing improved engines. Boeing’s 787 Dreamliner aircraft used these strategies, and reduced fuel use and carbon dioxide emissions by 20 to 30% compared with its predecessors. In addition to energy efficiency improvements, the aviation industry is also exploring alternative fuels with lower net carbon emissions, and electric motors. On the consumer side, flying less and purchasing fewer goods that need to be transported by air will save energy and reduce greenhouse gas emissions.
Industry
Industrial production is energy-intensive. Industries use energy for processes that students learn about in chemistry and physics classes: driving reactions, producing heat, and doing mechanical work. An extensive review of industrial processes and the potential for lowering their energy use and emissions is found in a report from the Intergovernmental Panel on Climate Change (IPCC.) The industrial sector has potential for reducing energy use. According to the IPCC,
The energy intensity of the industry sector could be directly reduced by about 25% compared to the current level through the wide-scale upgrading, replacement and deployment of best available technologies.
Industries and businesses are motivated to reduce energy use because this reduces their energy costs. They may be deterred by upfront costs for more energy efficient systems and not enough information about options. Examples of industrial systems with potential for energy efficiency improvements are electrical motors and systems that produce steam and heat.
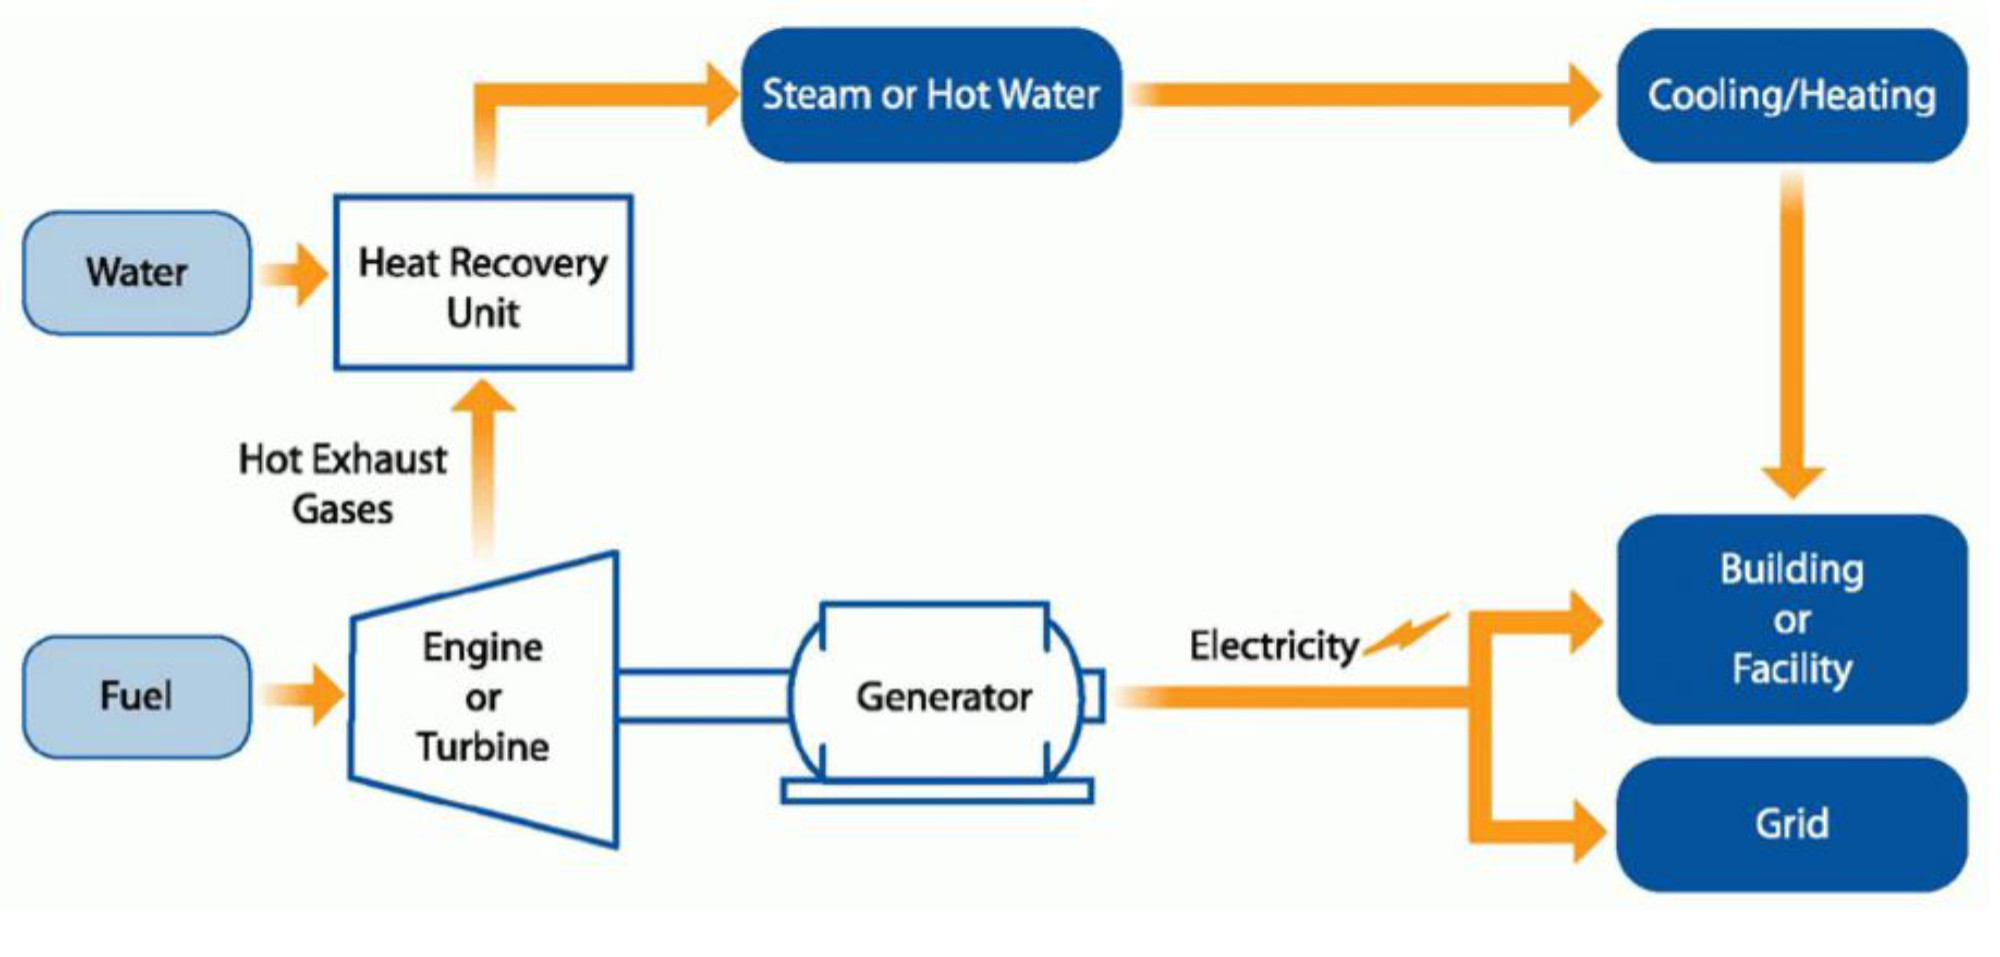
One example of an industrial energy efficiency improvement is the use of onsite combined heat and power (CHP). Conventional electricity generation produces heat that is simply wasted, released to the atmosphere. With an onsite CHP system, a facility produces its own electricity instead of buying it from the grid, and it uses the heat generated instead of wasting it. The heat can be used to produce steam or hot water to drive industrial processes or heat and cool buildings (Note: it may seem obvious to students how steam can heat a building, but not how steam can cool a building. To learn more, students can research steam turbine chillers and/or steam absorption chillers.)
The energy efficiency gain, and thus energy savings, of combined heat and power can be tremendous—from about 50% efficiency for a conventional system to over 80% efficiency for a CHP system. The diagram below shows an example of a CHP system.
Finally, industrial processes can produce greenhouse gases not only through their energy use but from the processes themselves. One example is the production of cement, where limestone is heated, breaking down calcium carbonate and releasing CO₂. Worldwide, about 5% of CO₂ emissions come from cement production. Carbon emissions have risen dramatically since the beginning of industrialization, and changes in the industrial sector — in the way we produce things — are an important part of climate change mitigation. We may need to find different ways to product cement, or find other materials to use instead.
Carbon Capture and Storage
Imagine a coal-fired power plant or oil reinery where CO₂ was removed from the final waste products. After removal, the CO₂ could be stored away or reused for other purposes. A technological solution that could achieve this for power plants would be a huge step, because energy production is the world’s largest source of greenhouse gas emissions.
This solution, carbon capture and storage (CCS), exists today although it is mostly used in fossil fuel refining and extraction. It is not in wide use in power plants for economic and environmental reasons. The world’s first large-scale, coal-burning power plant with a CCS system — the Boundary Dam plant in Saskatchewan, Canada — began operations in October, 2014. This plant has a CCS facility, built at the cost of about $1.5 billion (US dollars). It was hoped to capture 90% of emissions, but since it opened it has captured less than 65%.
The CCS process can work in several ways, and each way has a financial and an energy price tag. For a power plant, the energy cost is taken out of the output and can be substantial. For example, a coal-fired power plant might need to use 20 to 30% of its electrical output to power its CCS system.
Carbon Capture Costs and Benefits
The IPCC reports that carbon capture technologies can reduce CO₂ emissions from new power plants by 81 – 91%, depending on the method. [Carbon Dioxide Capture and Storage, IPCC, 2005] This reduction comes at a cost, however, ranging from a 33 to 57% increase in the cost of electricity production and a 37 to 76% increase in the capital cost. While these seem like significant costs that will lead to higher energy costs, this may be a more realistic representation of the actual cost of using energy that emits CO₂ . Economists often refer to this as “internalizing the externalities.” These numbers do not include any costs associated with transporting and storing the CO₂ after it has been captured. The tradeoffs between emissions reductions, financial costs, and environmental costs need to be evaluated when deciding whether CCS makes sense as a mitigation option.
Carbon Storage
Storing the captured CO₂ involves transporting it to a site where it can be injected into the Earth to be trapped under an impermeable rock layer, injected into the ocean where it would either dissolve in seawater or form a slowly-dissolving CO₂ lake at the sea floor, or injected together with water into rock such as basalt where it would mineralize and remain underground. All of these methods have environmental concerns and require more research. Storage under an impermeable rock layer has the risk of leakage, especially with seismic activity. It would require long-term monitoring (and the associated costs) to test whether leaks are occurring. Dissolution in the ocean only adds to the problem of ocean acidification that is taking place from atmospheric CO₂ dissolving in the ocean, affecting aquatic life. Carbon mineralization is appealing in that once completed there’s no risk of leakage, but it requires large amounts of water.
Carbon Reuse
Carbon reuse is an alternative to carbon storage, and one example already taking place on an industrial scale is a process called Enhanced Oil Recovery. In this process, captured CO₂ is injected underground into an oil reservoir in which the oil is difficult to extract through other means. The CO₂ mixes with or dissolves in the oil and makes it low more readily. A full-cycle analysis of Enhanced Oil Recovery is necessary to determine whether it is a mitigation option, since the end product is a fossil fuel which, when burned, releases more CO₂.
Other ways to reuse captured CO₂ are under research or are viable at a small scale. One example comes from the lab of Cornell University professor Geoffrey Coates, whose research group is working on creating polymers from CO₂ and limonene, an extract found in orange peels and other plants. These polymers can be used to make plastic, a product typically made from petroleum. Other research groups are exploring synthetic photosynthesis, a way to produce energy and materials in a laboratory using sunlight and CO₂, mimicking the process occurring naturally within a leaf.

Polymers created using carbon dioxide and limonene oxide derived from orange peels. Photo courtesy of Professor Geoffrey Coates, Cornell University.
Land Use: Forests, Soils, and Agriculture
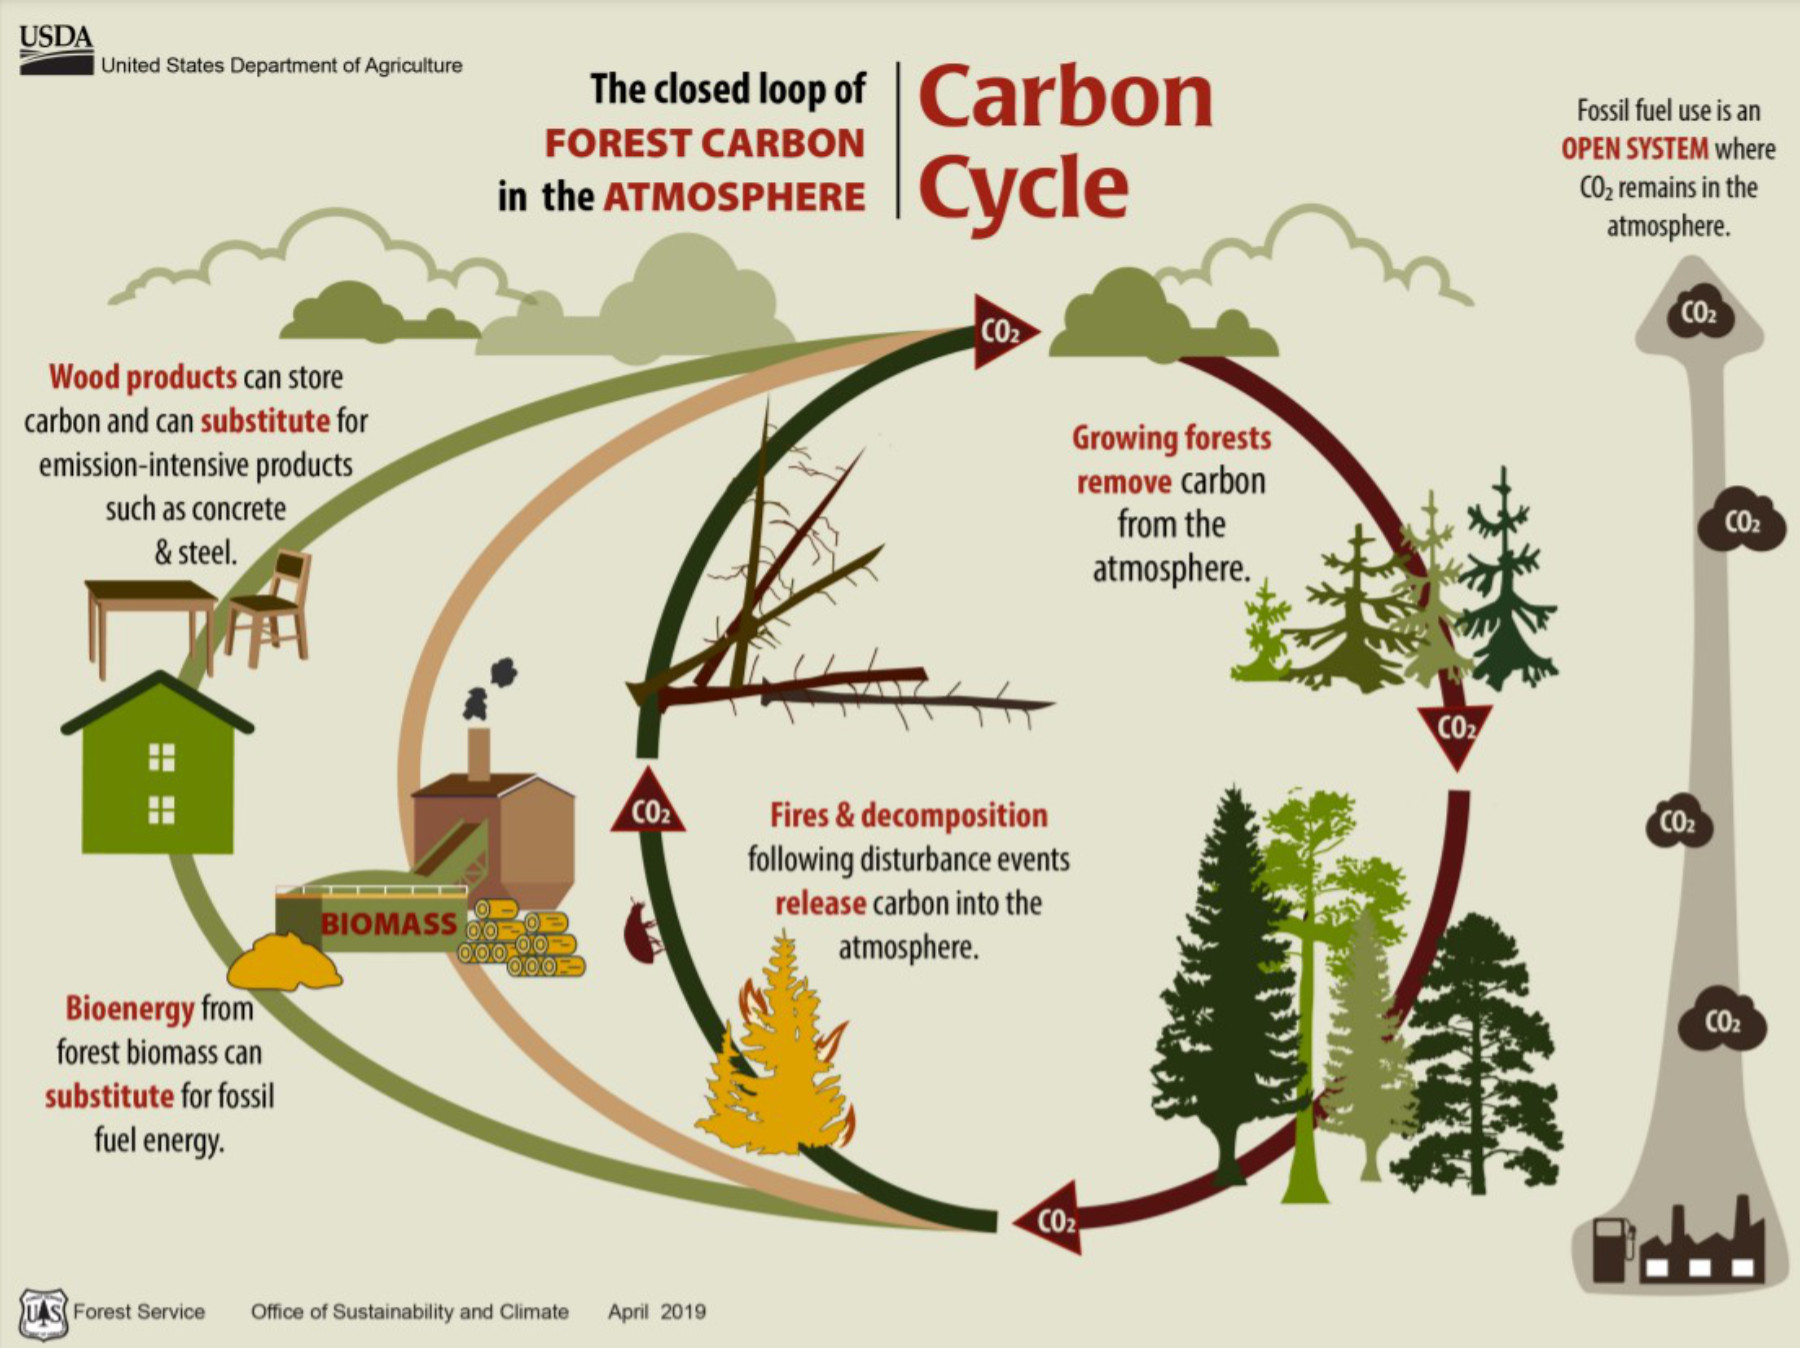
Plants and soils sequester (take in and hold) carbon when left untouched by large-scale human activity, and when treated carefully with techniques such as prescribed burning that some indigenous peoples have practiced for thousands of years. [Pellegrini et al., 2021] Plants take in carbon through photosynthesis, release some to the atmosphere through respiration and some to the soil through their roots, and store the remainder in their tissues. A tree’s dry weight is almost half from carbon. The video below discusses how trees take in CO₂, and how a simple measurement can help us estimate the CO₂ that a tree has sequestered during its lifetime.
The soil takes in carbon when plants die and decompose, although some is released to the air. When people burn forests or till soil, carbon is released into the atmosphere. The practices we use in managing forests and land can have a big impact on carbon emissions. Perhaps in the context of mitigating climate change, we should think of land use as land care. This mindset could apply to other aspects of humans interactions with land as well.
"Trees From Thin Air" by Paleontological Research Institution (YouTube)
Forests
The story of human impacts on the world’s forests over the last few centuries has mainly been one of deforestation. Even the Northeastern United States, whose forests have grown back significantly after a period of extensive deforestation in the 18th and 19th centuries, is not covered with as much forested land as it was before European settlement. Today, tropical forests in the Amazon River basin, Indonesia, and central Africa are being cut and burned at a rapid rate.
Some forestry options for mitigating the release of carbon are afforestation, reforestation, reducing deforestation, and planting forests that grow rapidly. A report from The Royal Society of the United Kingdom estimated that the combination of these actions could sequester 3 to 18 billion tons of CO₂ from the atmosphere each year. [The Royal Society, 2018] These estimates take into account land availability, economic and ecological constraints, and maintaining land for food and fiber production.
Afforestation is the process of planting trees on land that was not previously covered by a forest, or was only covered by a forest a long time ago. It would not make sense to do large-scale tree planting in ecosystems where they don't naturally grow, such as prairies—the trees wouldn't grow well there to begin with, and the natural grasslands, if conserved and cared for, are effective at taking in carbon. But afforestation may be a reasonable solution in some circumstances.
Reforestation is the rebuilding of forests that have recently been cut down. Ideally it should be done with a variety of native trees that provide wildlife habitat as well as taking in CO₂. Trees planted in tropical regions tend to grow the fastest. Conserving forests (reducing deforestation) is a vital part of reducing climate change as well as protecting habitat and biodiversity. In 2021, at the 26th annual United Nations Conference of the Parties (COP26), over 100 countries pledged to halt and reverse deforestation by 2030. Pressures are strong, however, to deforest land for agriculture and other development, especially in the tropics. As the climate warms, the huge boreal forests of the Northern Hemisphere may face more development pressure as well.
Some forestry projects are supported through carbon offset programs: systems set up so that actions that release carbon into the atmosphere (such as air travel or industrial production) are offset by paying to support actions that take in carbon, such as reforestation.
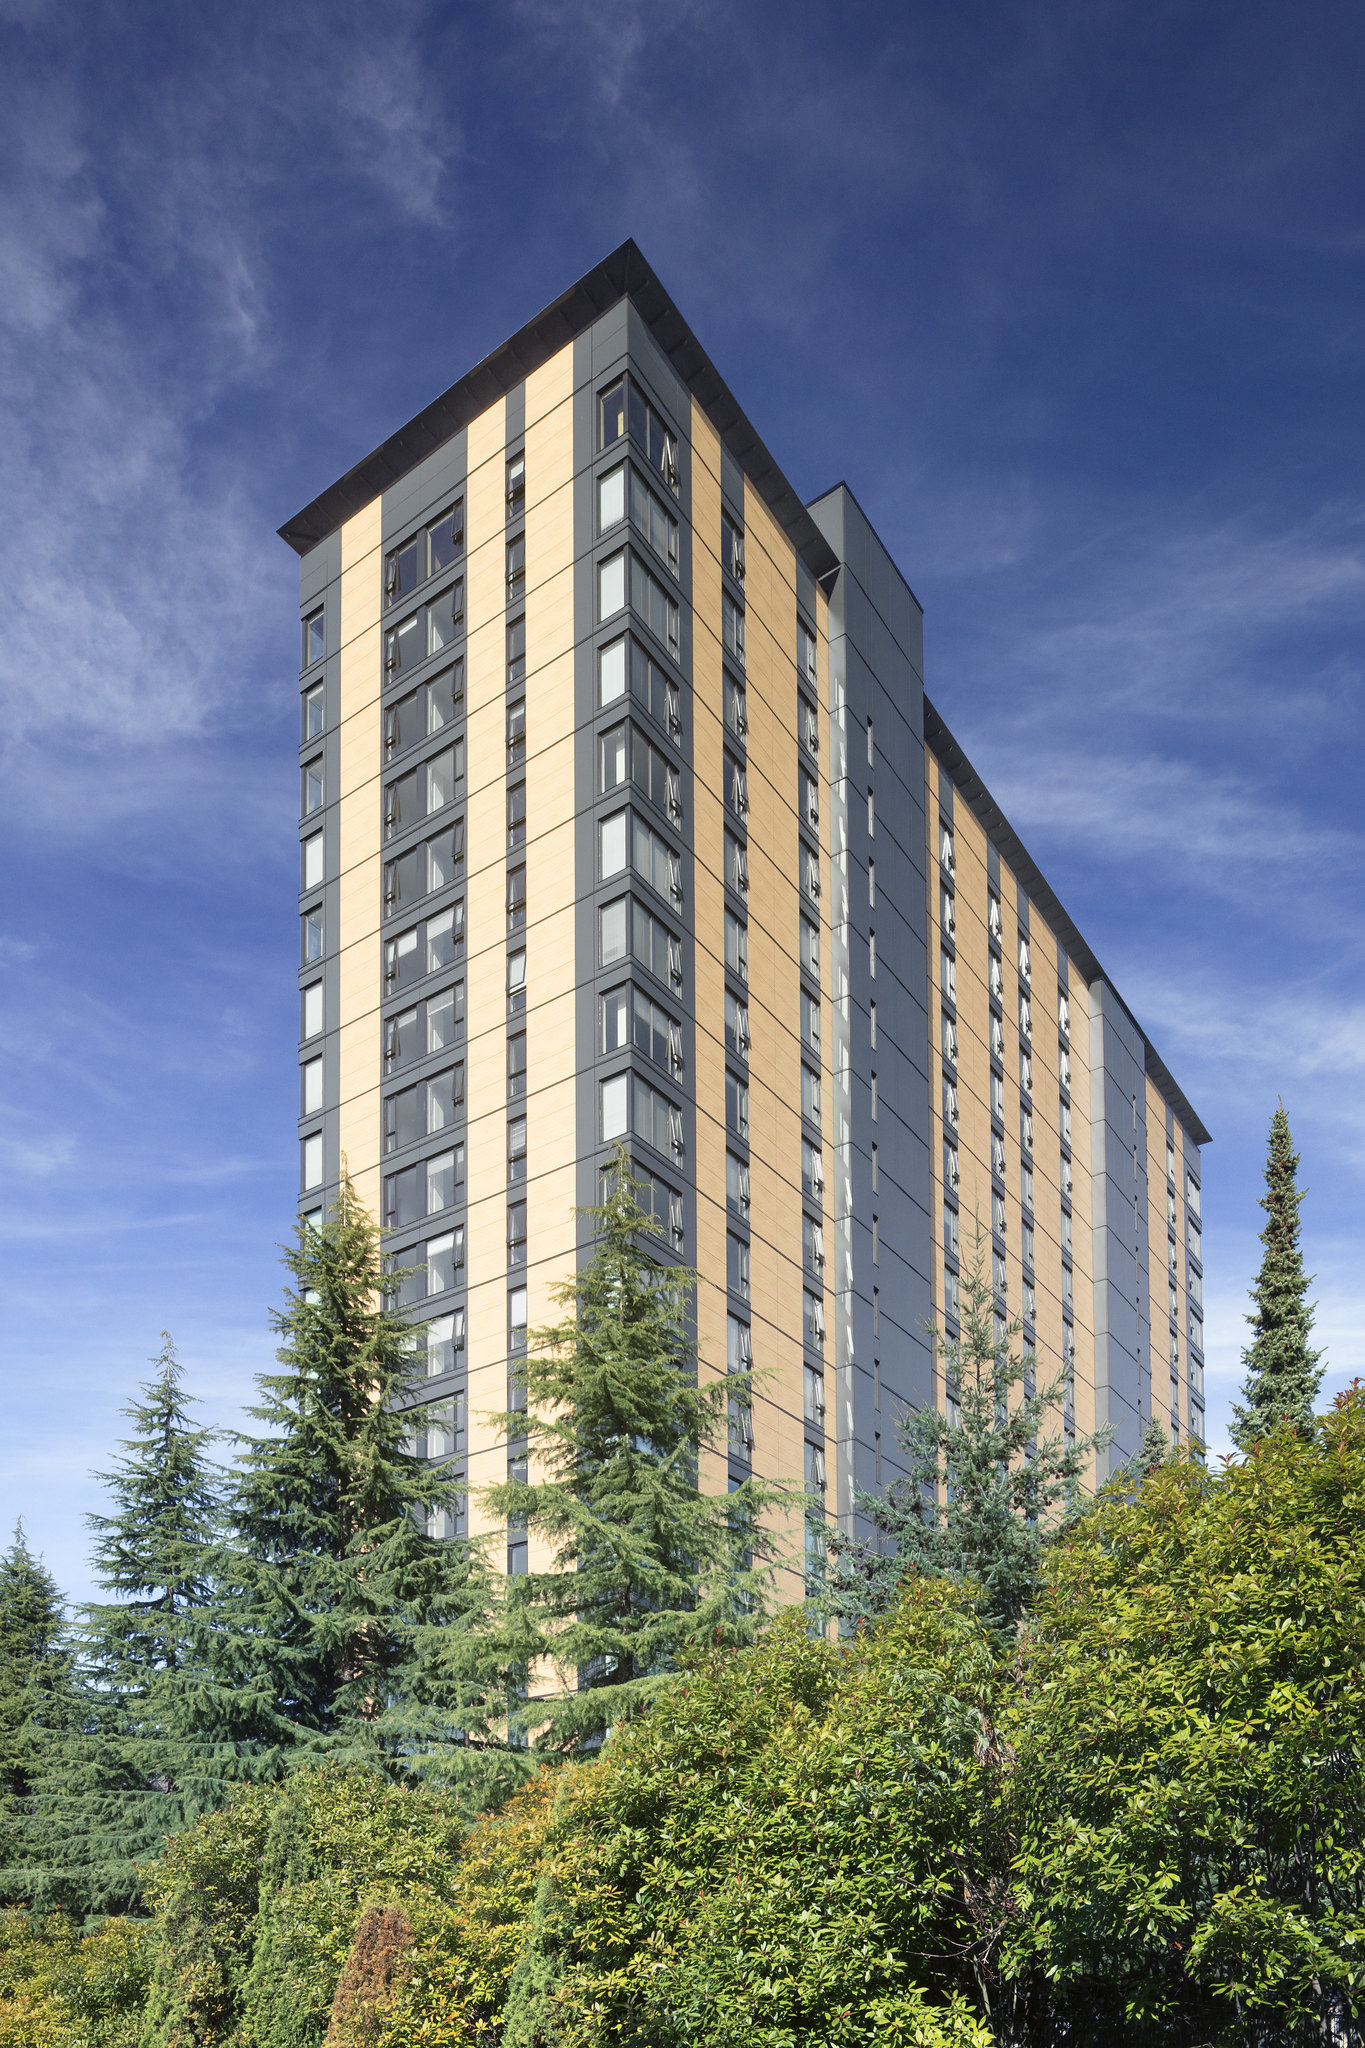
Brock Commons Tallwood House on the campus of the University of British Columbia, a tall building built with wood instead of steel and concrete. Photo: UBC Media Relations (CC BY-NC 2.0 via Flickr)
Soil and Agriculture
Soils lose carbon from natural processes such as weathering, erosion, and leaching over very long time scales. Soils that have been exposed over many thousands of years contain much less carbon than younger soils. For example, the soils of the northern Great Plains and Northeastern US are relatively young, having been scraped away by continental ice sheets and redeveloped since retreat of glaciers about 14,000 and 11,000 years ago. In contrast, the soils of the southern Appalachian Mountains have been not been stripped away by glaciers, so have been in a constant state of erosion and renewal by new weathering over spans of millions of years. The northern Great Plains soils contain about 4 to 7% organic matter (that is, materials that were carbon-containing organic tissues of organisms), whereas soils in the southern Appalachian Mountains typically contain less than 1% organic matter.
Modern human activity depletes soil carbon at a much faster rate than these long-term natural processes do. Most soils in the Midwest retain only 50 to 70% of the carbon that they contained before European settlers began building farms on the prairie. Tilling the soil exposes organic matter to the air where it can oxidize, releasing carbon. Carbon is also lost through wind erosion, leaching, and water runoff, processes that are accelerated when the soil is disturbed by agricultural practices.
Agricultural practices can also play a role in returning carbon to the soil; these practices are often called regenerative farming. For example, instead of leaving a field fallow over the winter, farmers may plant a cover crop: a crop of rye, alfalfa, or some other plant that will prevent erosion of exposed soil and loss of carbon through water runoff. The crop adds carbon to the soil through its roots, and in the spring the crop is used as mulch or plowed under the soil instead of being harvested, adding more carbon. Another example of regenerative agriculture is holistic planned grazing, in which farmers plan their livestock grazing so that plants have time to recover after being grazed on. The plants benefit from the nutrients provided by manure, the livestock benefit from healthy vegetation to eat, and farmers and the climate benefit from more carbon in the soil.

These ways of increasing soil carbon are biochemical. A different practice is physical in origin—it involves planting trees around fields as windbreaks, which slow the wind locally and reduce wind erosion of the soil. This reduces soil carbon losses from erosion. The photo below illustrates this.
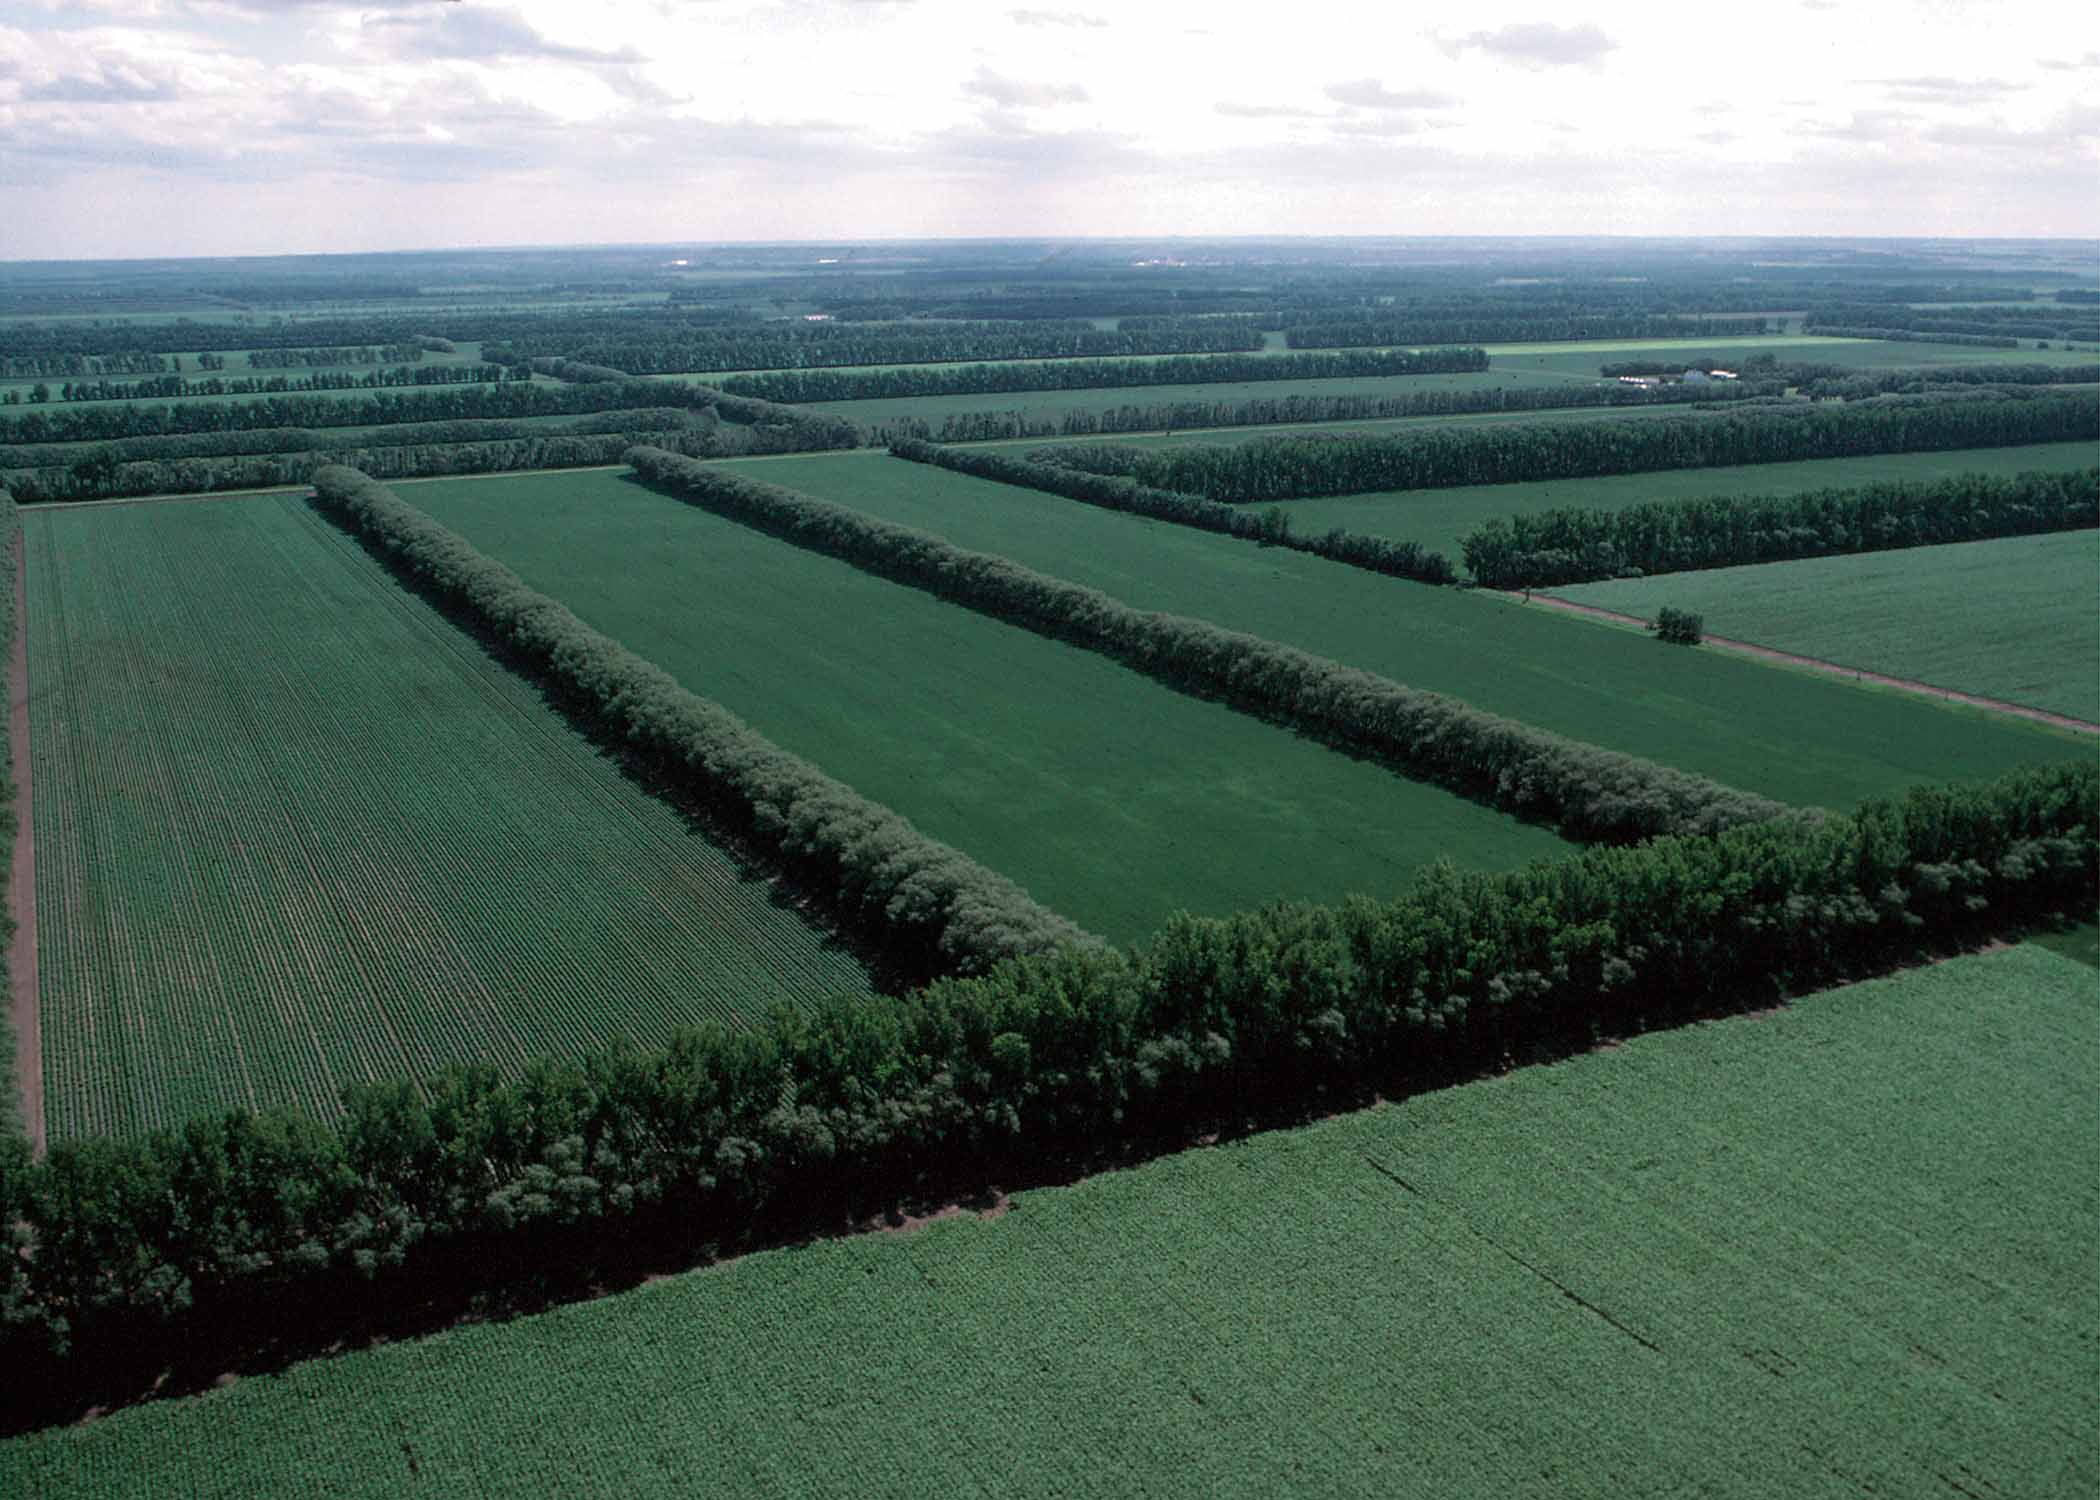
Trees planted as field windbreaks in North Dakota protect the soil against wind erosion. Photo: Erwin Cole, USDA Natural Resources Conservation Service (public domain via Wikimedia Commons)
Waste Management
Garbage is something most people would rather not think about, and yet the ways we manage waste products in society have significant environmental impacts, including on greenhouse gas emissions. Wastes generated by human activity are classified as pre-consumer or post-consumer. Our household garbage is an example of post-consumer waste. Water use also leads to postconsumer waste that needs to be treated at wastewater facilities. Pre-consumer wastes include those from manufacturing, energy production, agriculture, and forestry.
Post-consumer waste accounts for less than 5% of global greenhouse gas emissions. Although this is a small fraction of total greenhouse gas emissions, pursuing proper waste management makes sense because technologies exist today to mitigate much of the emissions, and mitigation has co-benefits such as reducing pollution that is harmful to human health and providing renewable energy. Landfills, which produce methane and carbon dioxide, are the main source of greenhouse gas emissions from waste. The second largest source is wastewater, particularly from sewer systems, which can emit methane and nitrous oxide.
Solid Waste in Landfills
The best way to reduce greenhouse gas emissions from landfill waste is to not generate it in the first place. This can be done by keeping organic matter such as food scraps out of landfills, and composting them instead. A study from 2020 showed that composting raw organic material resulted in the lowest greenhouse gas emissions when compared with other alternatives for dealing with organic municipal solid waste. [Nordahl et al., 2020]
How does putting organic waste into landfills create a problem? When bacteria in a landfill decompose food scraps and plant matter anaerobically (without the presence of oxygen) they generate methane. That methane can leak into the atmosphere, where it acts as a powerful greenhouse gas. Organic matter in a well-tended compost pile, with access to oxygen, will decompose aerobically and produce carbon dioxide instead of methane. In an accounting of greenhouse gas emissions this carbon dioxide is balanced by the carbon dioxide taken in to grow the organic matter, resulting in net zero emissions. In practice, compost piles can emit methane and nitrous oxide, formed in parts of the pile that are low in oxygen and high in nitrogen, respectively. However, the amounts are small compared with the methane that would have been generated from the organic matter in a landfill.
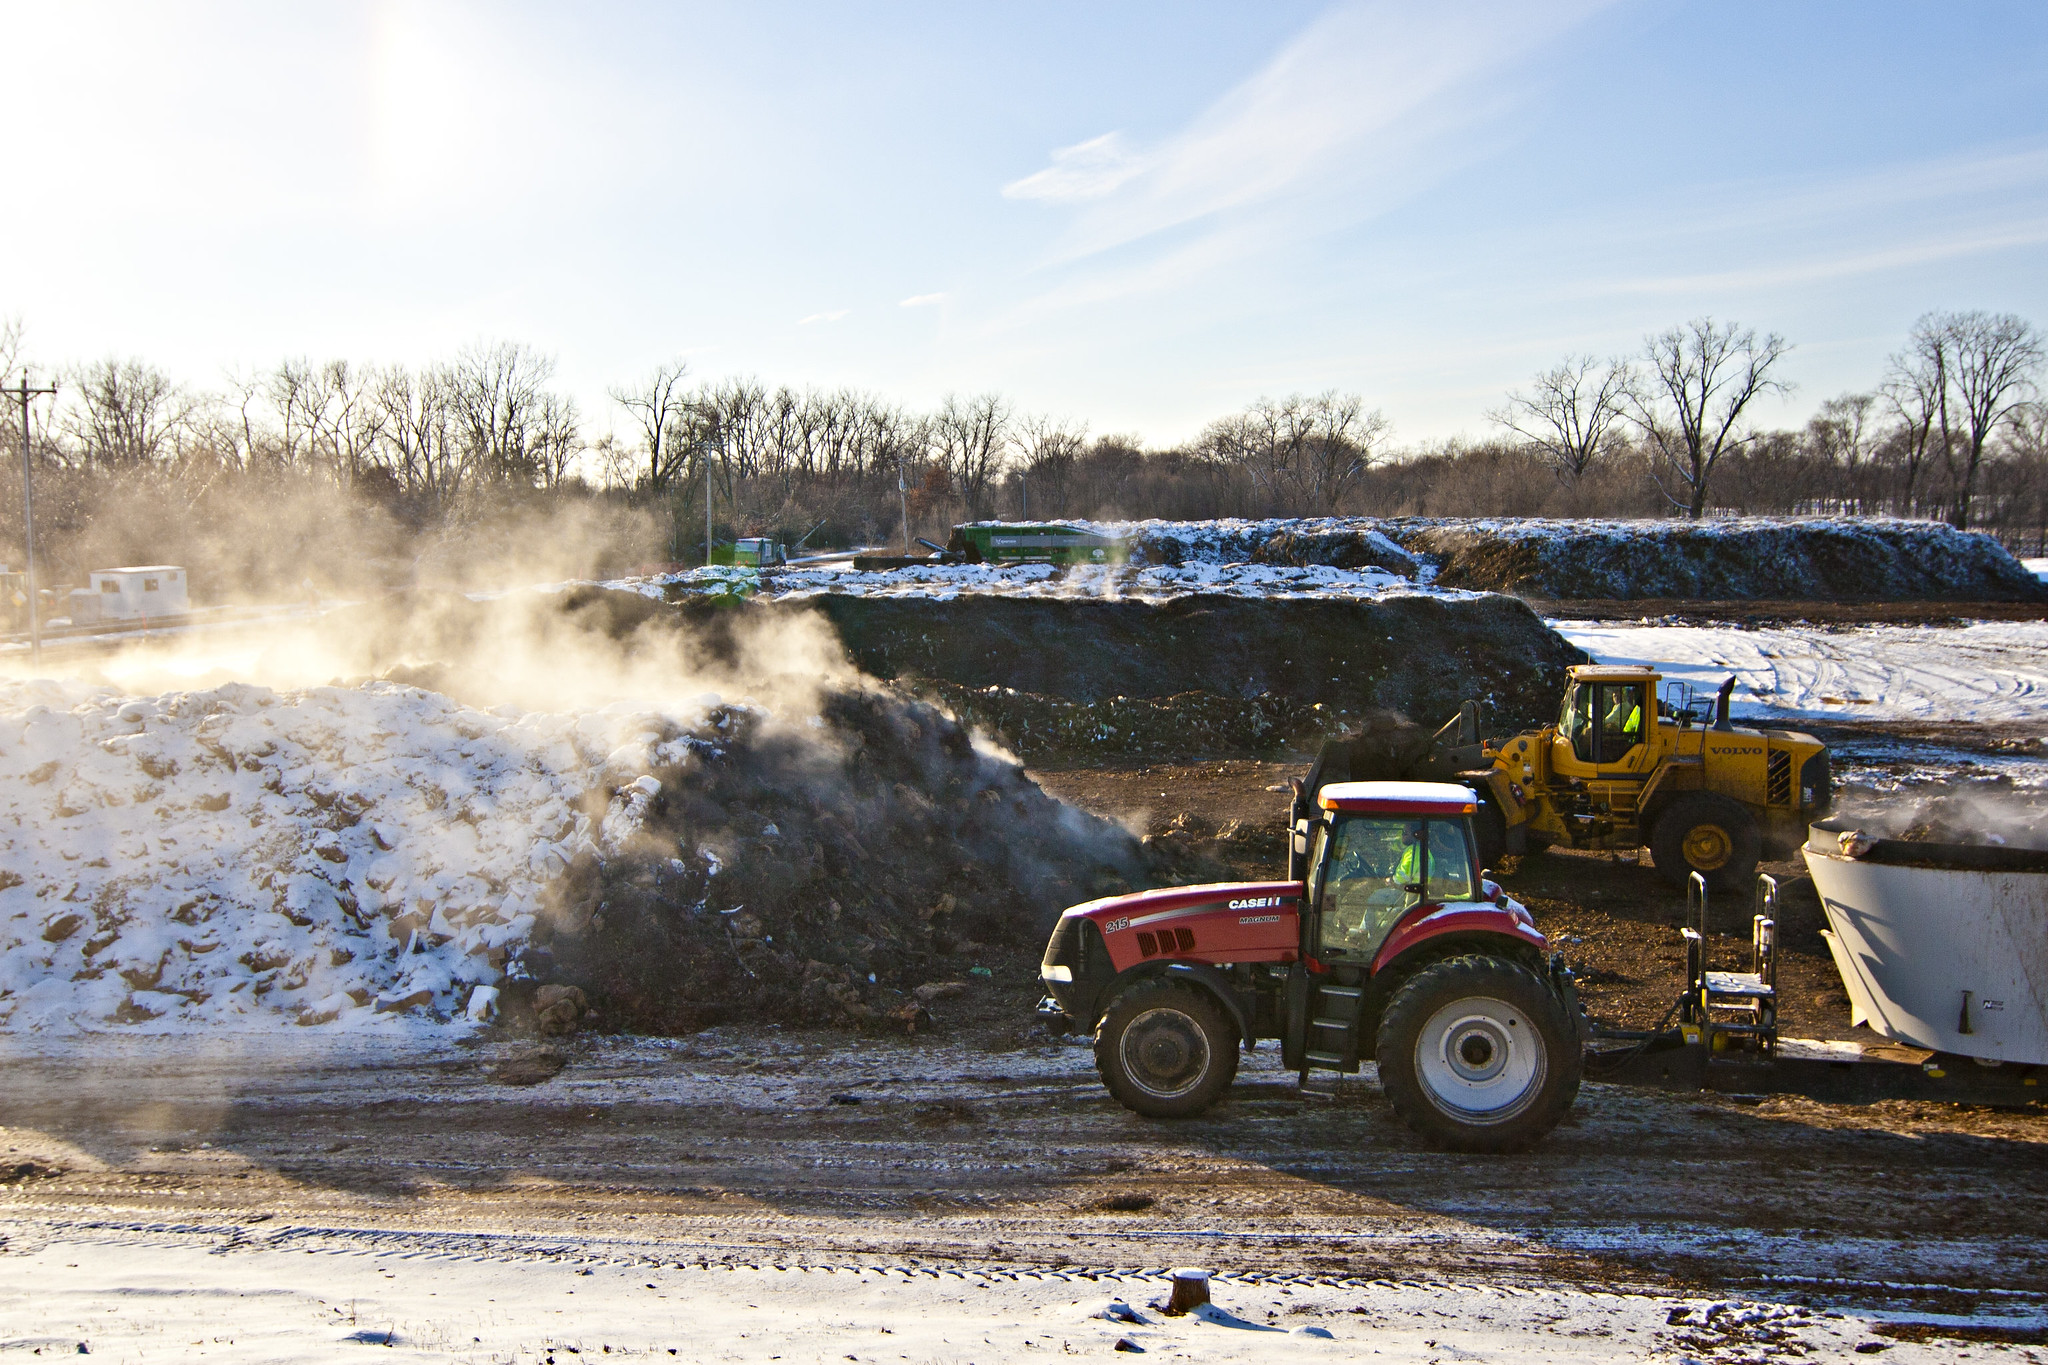
Commercial compost facility in Shakopee, Minnesota, in winter. The steam comes from heat generated by the activity of microorganisms breaking down organic material in the compost pile. Photo: MPVA Photos (CC BY-NC 2.0 via Flickr)
When considering the carbon footprint of any process, one needs to conduct a detailed and full life cycle analysis. This accounts for the energy use and carbon emissions from all parts of the process, including things like transportation and packaging. For composting, the sources of emissions include: transporting the organic material to the composting site; using water and running equipment to set up and maintain the site; and running equipment to transport and apply prepared compost. On the other side of the equation are: the reduction in emissions compared with landfilling; carbon sequestration in the soil when compost is used; and less use of synthetic fertilizers and herbicides, resulting in less emissions associated with their production. A full life-cycle analysis, as conducted by Nordahl et al. in the reference above, results in composting as being the most climate-friendly among alternatives for managing organic waste.
Another way to reduce greenhouse gas emissions from waste is landfill gas recovery. This technique focuses on capturing and using the methane generated from bacterial anaerobic decomposition of landfill waste. Over a few decades, a landfill gas recovery project can cut methane emissions from a landfill by 60 to 90%. The captured methane can be burned to produce heat or electricity, avoiding use of fossil fuels for these needs. Although the process of burning methane produces CO₂, it is a far less potent greenhouse gas than methane. A landfill gas recovery project that produces electricity can use some of the electricity to power the system and sell the rest to help pay for the required technology and infrastructure. A major concern with these types of systems is leaks, and accidental methane releases into the air. These systems must be monitored and leaks must be repaired quickly.
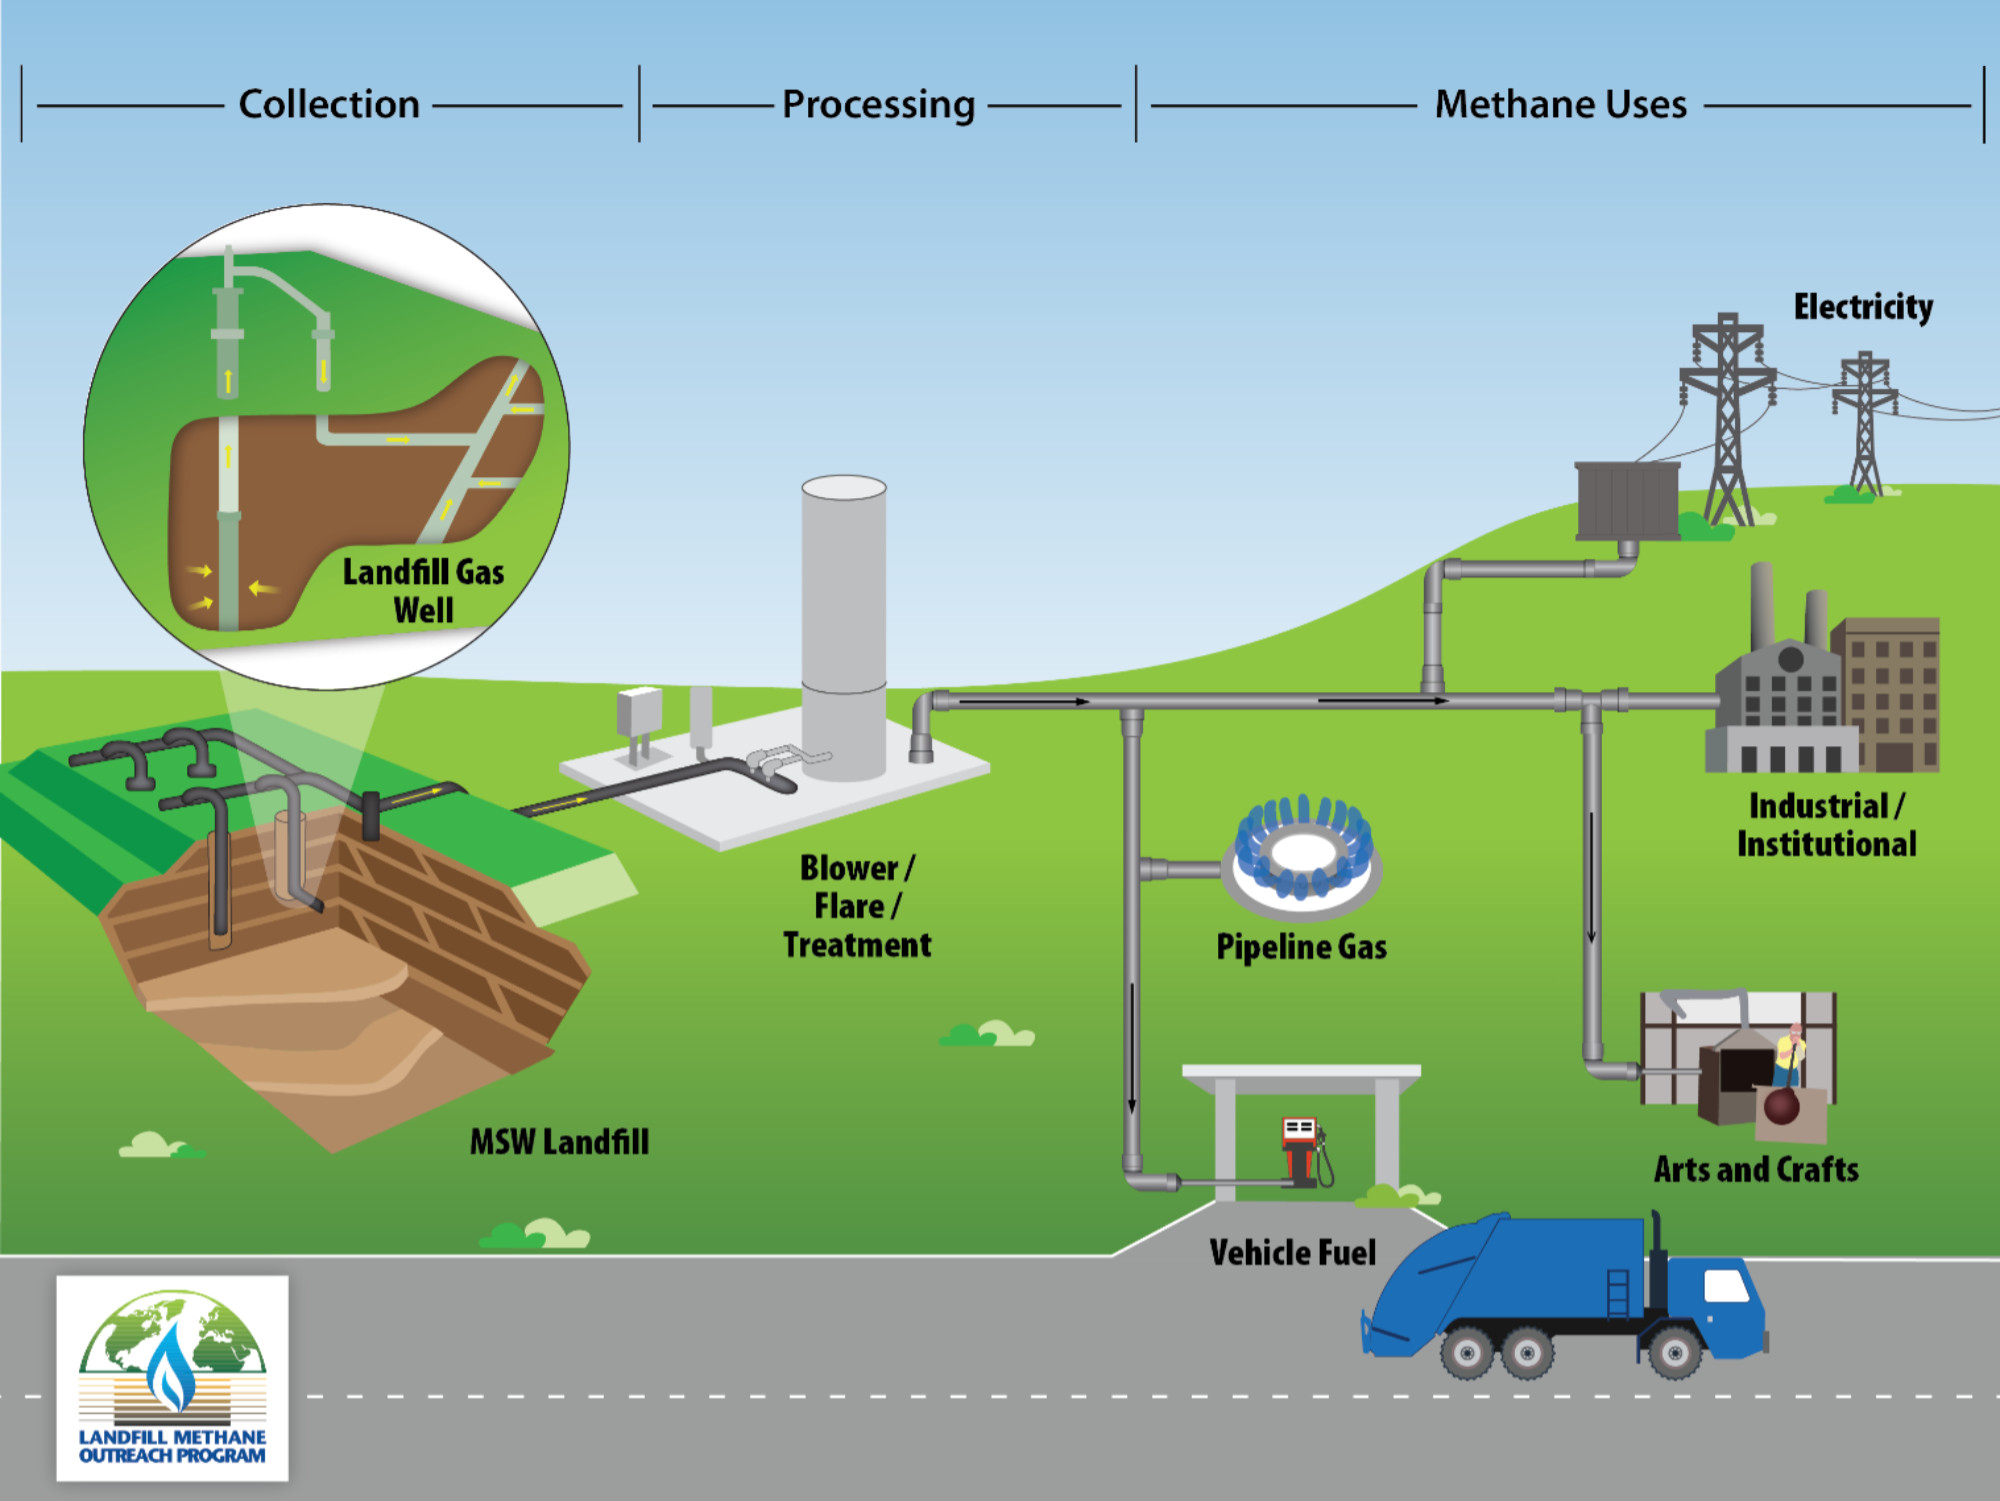
Diagram illustrating the collection and processing of landfill gas to produce methane for multiple uses. First, landfill gas is collected through vertical and horizontal piping buried in an municipal solid waste landfill. The landfill gas is then processed and treated for use. The graphic shows potential end uses of landfill gas including industrial/institutional uses, arts and crafts (such as firing a kiln), pipeline gas, and vehicle fuel. These systems must be closely monitored for leaks. Diagram: US Environmental Protection Agency.
Another way of managing waste to reduce carbon emissions is through waste incineration for heat and electricity generation, often called “waste-to-energy.” This process reduces carbon emissions by avoiding the use of fossil fuels for heating and electricity production. Modern waste-to-energy plants are a far cry from the household backyard burning seen in some areas. They involve sophisticated systems to efficiently generate heat and electricity and to prevent toxic air pollution. As such, they are currently expensive and are used in developed countries that have the means to build and operate them. Sweden incinerates about 50% of household waste in waste-to-energy plants, and has recently become so successful at reducing waste through recycling and reuse that it needs to import waste from other countries to burn in its plants. While waste-to-energy has certain advantages over landfills or recycling, it does produce carbon emissions and ash that must be disposed of.
Food Waste
Beyond preventing organic wastes from entering landfills, we need to alter other aspects of our systems to reduce food waste. Food that is edible but is not consumed is considered wasted. Food is wasted in many ways, such as in not using all that could be used in cooking, in being allowed to get moldy or eaten by pests before people can eat it, or in not being stored properly so its spoils and becomes inedible. Tragically, about 30% to 40% of the US post-harvest food supply is wasted. This has moral implications when one thinks about people who are hungry and cannot afford food. It also has economic impacts and consequences for greenhouse gas emissions.
Trailer for full-length film "Just Eat It - A food waste story" by Peg Leg Films (YouTube). The Paleontological Research Institution and Earth@Home have no relationship to the producers of this film.
Producing food uses water and energy, and those uses lead to greenhouse gas emissions. So producing food that is wasted is simply releasing greenhouse gases into the atmosphere for no reason. Food that ends up in landfills contributes to methane emissions. Researchers estimate that about 25% of the water used in agriculture goes into wasted food, and approximately 300 million barrels of oil are used each year in US production of food that is eventually wasted. A study that gives details on food waste in America is by Hall et al. (2009): The Progressive Increase of Food Waste in America and its Environmental Impact.
As individuals we can reduce food waste with better planning and food management (for example, freezing leftover food to eat later). As a society, we can support programs that help food producers, markets, and restaurants donate more food to those in need. Learn more about national efforts to reduce food waste from the US Environmental Protection Agency here. For food that is not eaten, we can prevent it from entering landfills by composting, feeding it to animals, or using it to generate energy though biomass burning.
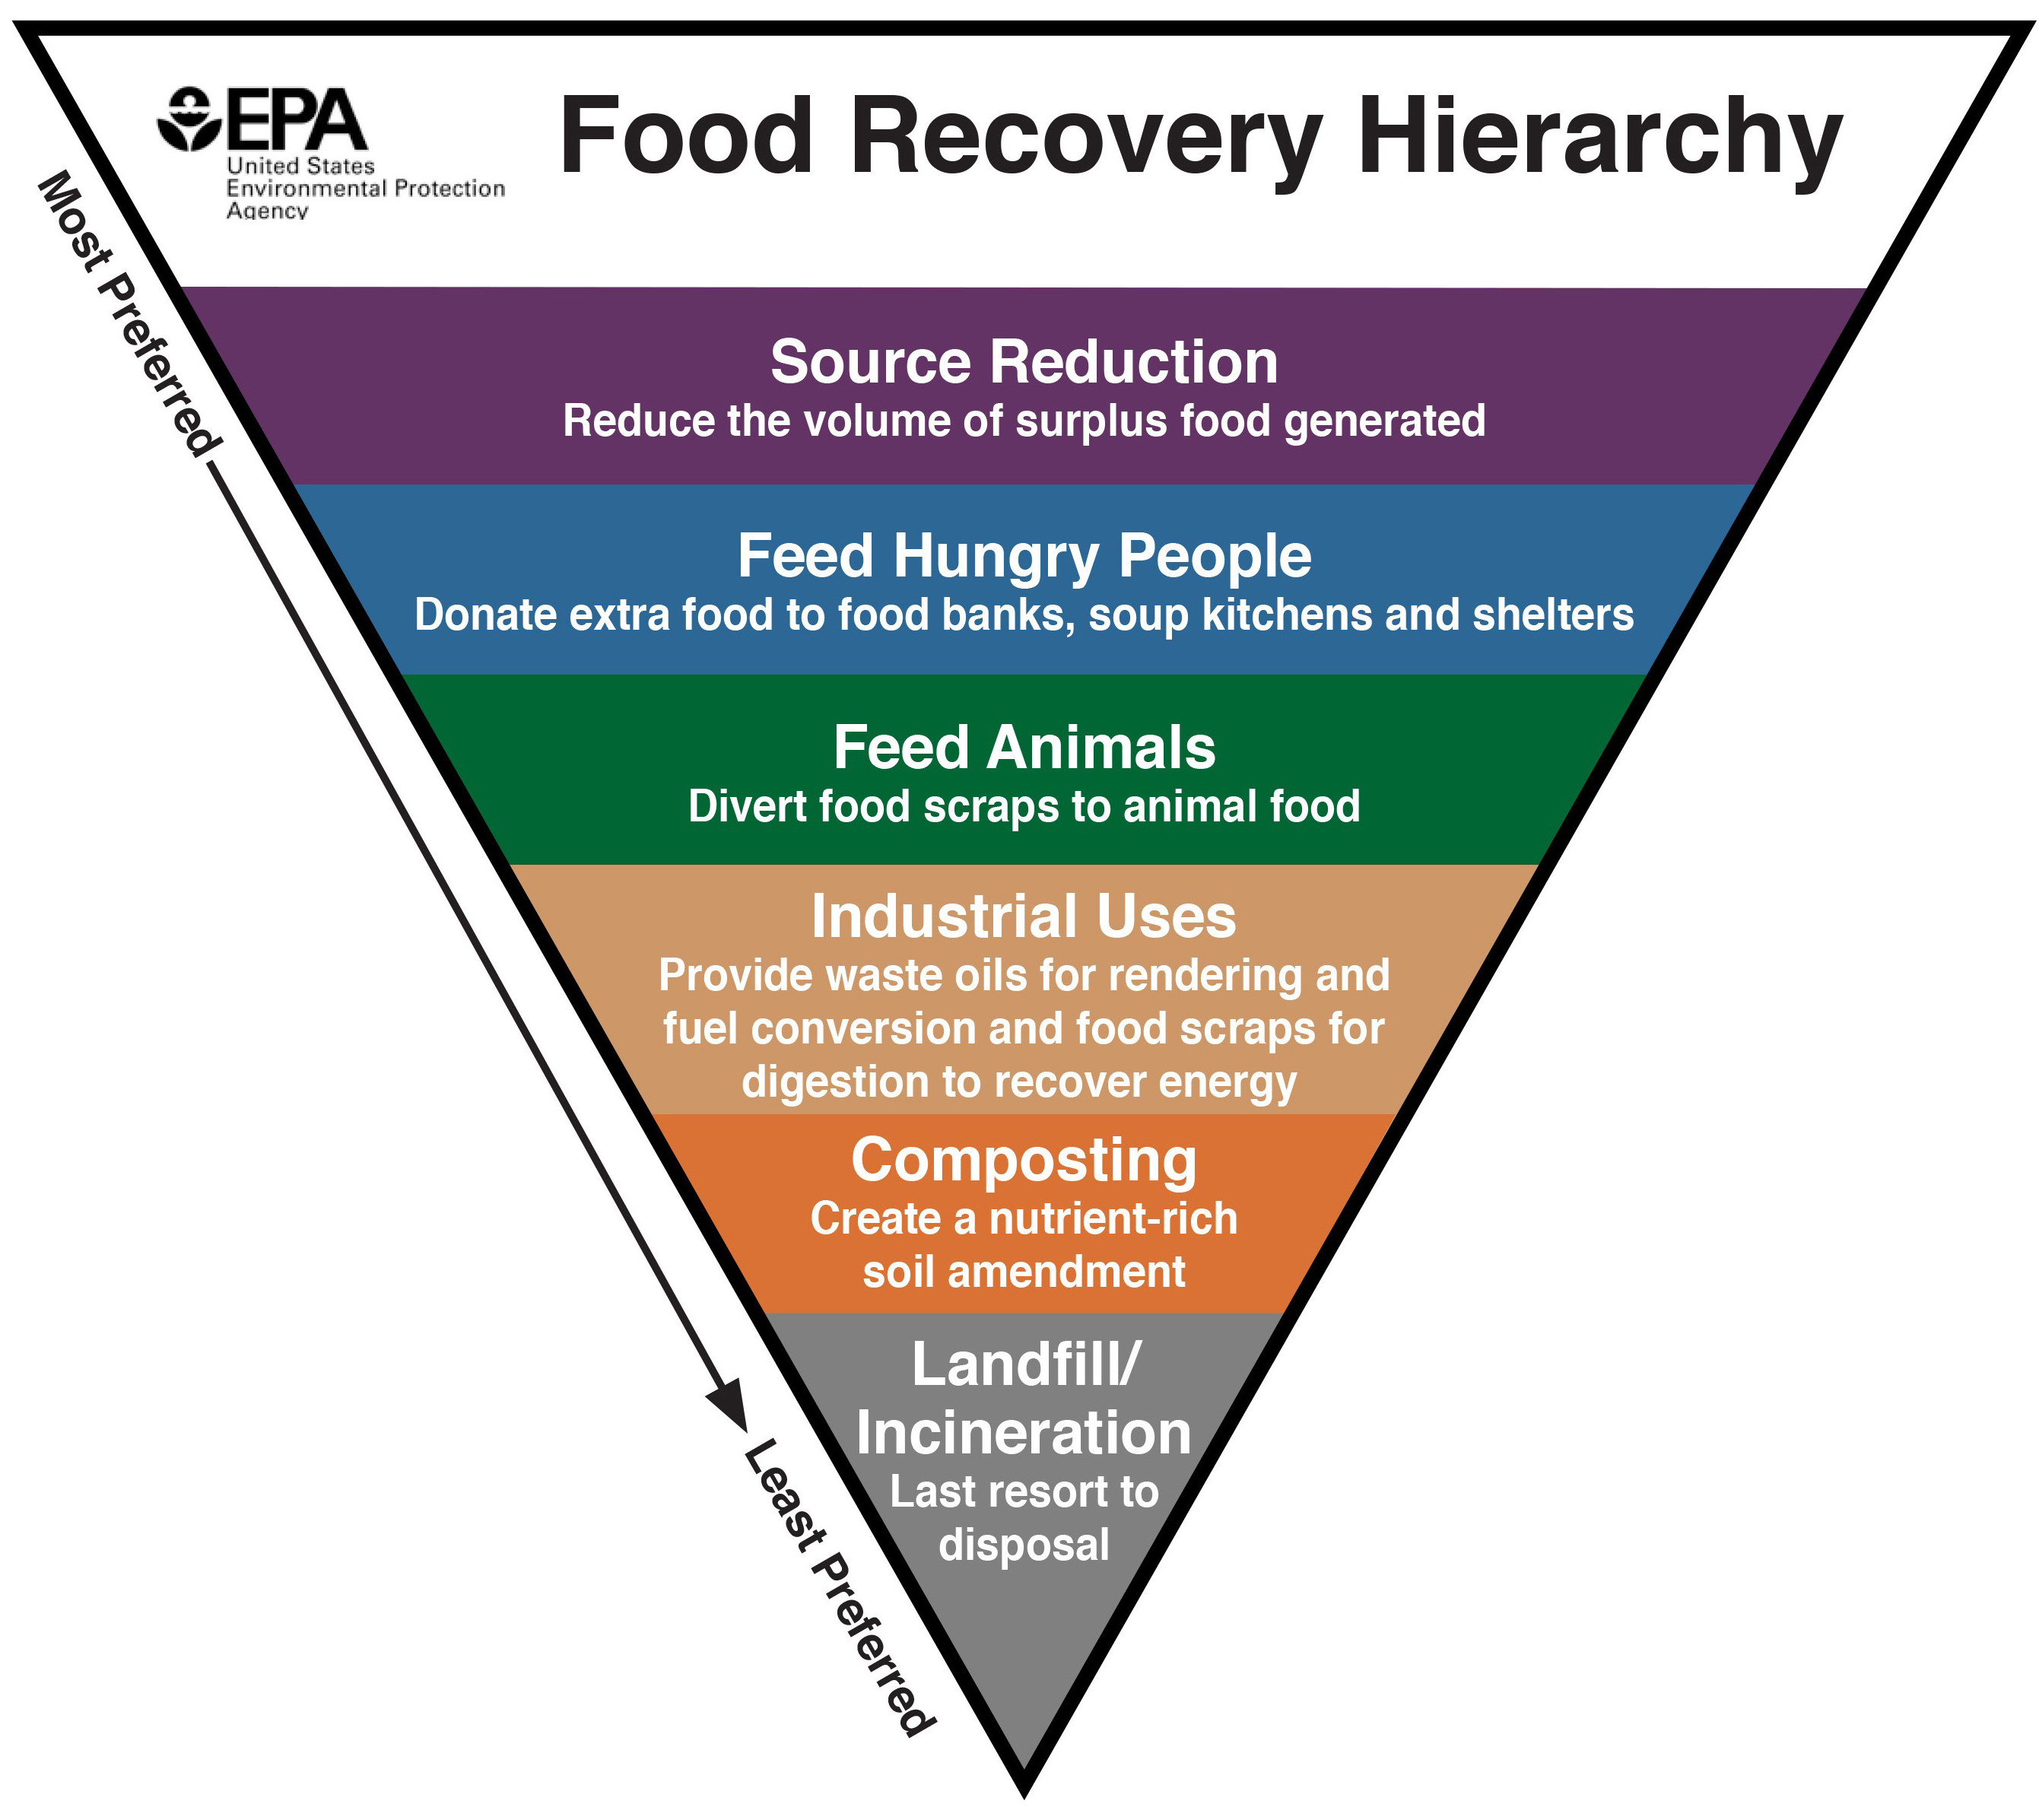
A hierarchy of options for using uneaten food. Diagram: US Environmental Protection Agency, Sustainable Management of Food.
Recycling
Recycling reduces greenhouse gas emissions by avoiding energy use to produce new materials. It also has the co-benefits of conserving natural resources, reducing waste going into landfills and incinerators, and preventing degradation of land that often accompanies obtaining new raw materials such as metals. The table below shows data on some of the energy and resource savings from recycling.
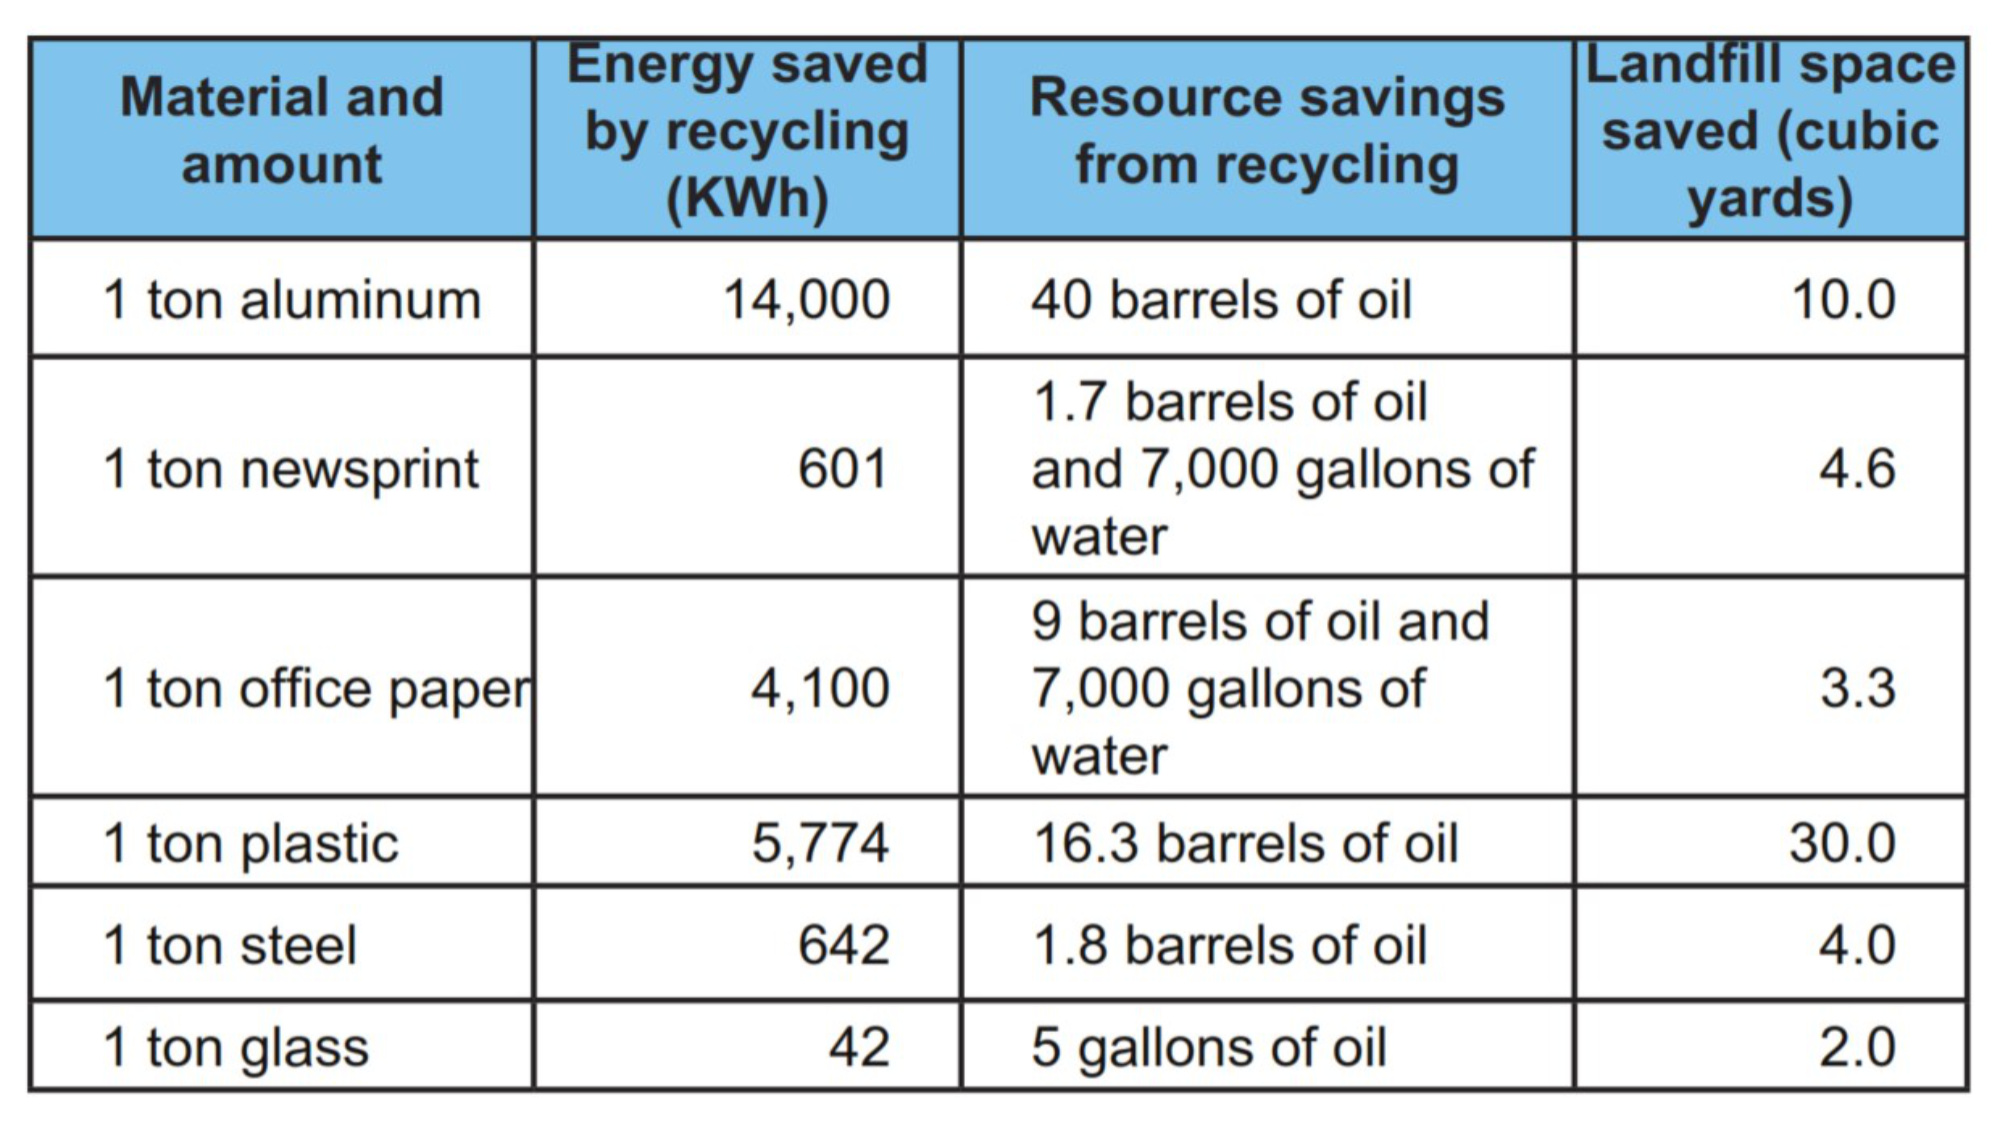
Table: Energy and resource savings from recycling. These data come from a summary of the benefits of recycling from the Stanford University Buildings and Grounds Maintenance department: Frequently Asked Questions: Benefits of Recycling. Retrieved Dec. 9, 2015, from http://bgm.stanford.edu/pssi_faq_benefits.
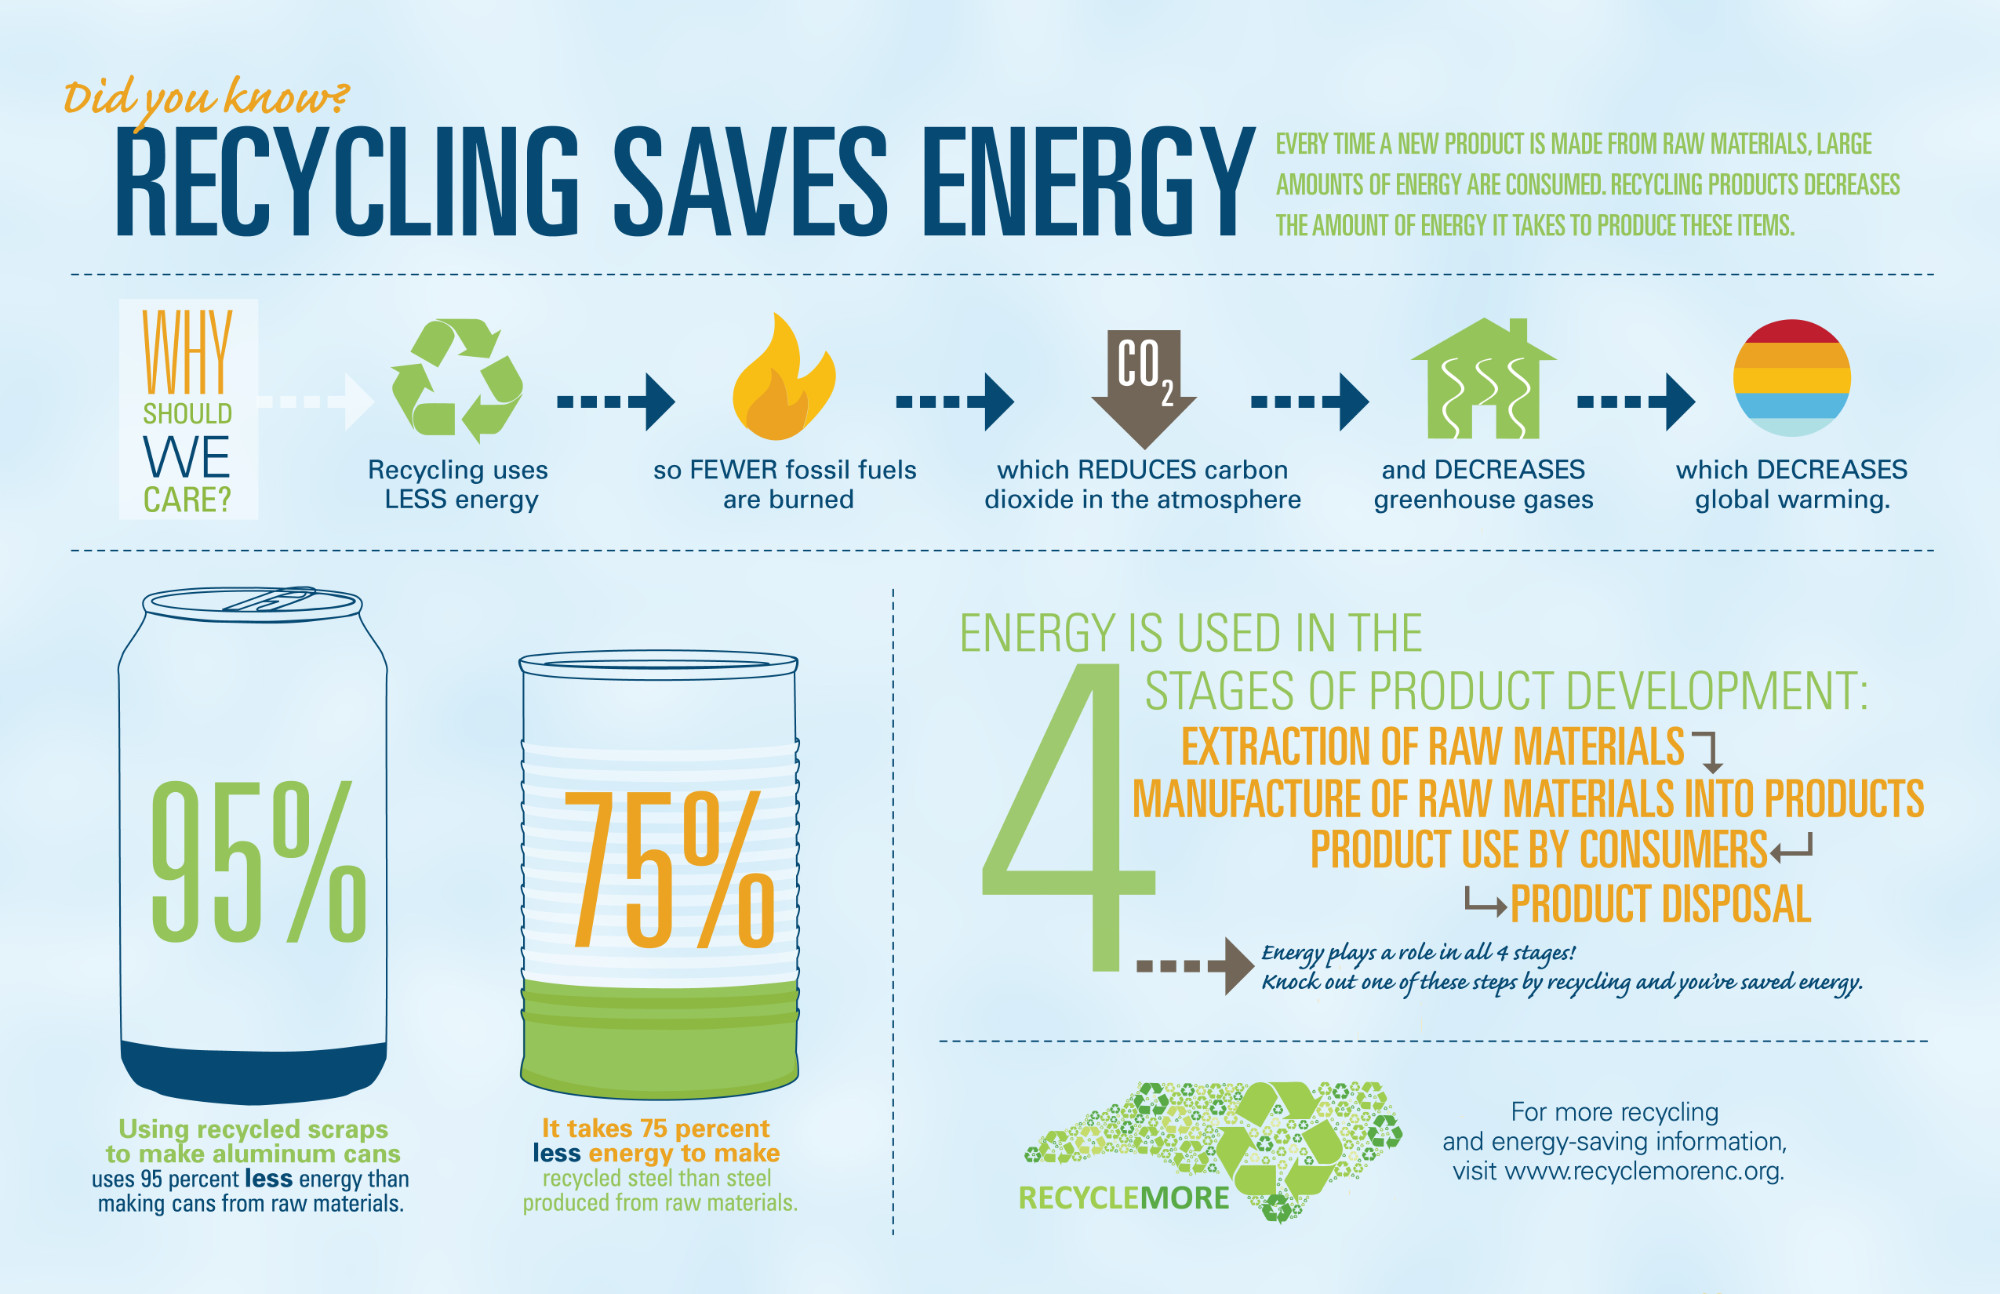
Recycling Saves Energy poster from North Carolina Department of Environmental Quality website: Recycling and Climate Change.
Social Innovation
The way we go about our everyday lives within our cultural norms has an impact on our energy use and greenhouse gas emissions. For example, 76% of Americans drove to work alone in 2013. [McKenzie, Who Drives to Work? Commuting by Automobile in the United States: 2013] Changing this behavior is one way to help mitigate climate change, though behavior is not the only factor. Change will also require changes in transportation systems, such as more public transportation options, and in workplace practices, such as scheduling that would allow for carpooling.
Energy savings from social innovation can be significant. For energy consumption in buildings, for example, the IPCC estimates that “for developed countries, scenarios indicate that lifestyle and behavioural changes could reduce energy demand by up to 20% in the short term and by up to 50% of present levels by mid-century.” [IPCC, 2014]
One example of social innovation for reducing energy use in buildings is Japan’s “Cool Biz” campaign, starting in 2005. This campaign aimed to reduce air conditioning use in buildings by encouraging office workers to wear cool clothing instead of business suits. It involved changing cultural norms of how people dress at work. The campaign has been viewed as successful, and official estimates for the resulting reduction in carbon dioxide emissions per year range from 0.9 million tons (2005) to 2.2 million tons (2012). [EESI]
Dietary Choices
Another aspect of social innovation to mitigate climate change involves dietary choices in food consumption, and gives added weight to the old call to “eat your veggies.” Transporting food leads to greenhouse gas emissions, but recent research has shown that by far the largest contribution to greenhouse gas emissions comes from food production, which is 83% of the average American household’s food consumption carbon footprint. Red meat and dairy production are the most greenhouse gas emission-intensive. A 2008 study found that “shifting less than one day per week’s worth of calories from red meat and dairy products to chicken, fish, eggs, or a vegetable-based diet achieves more greenhouse gas reduction than buying all locally sourced food.” [Weber & Matthews, 2008] This is not to dismiss the benefits of eating locally-grown food, which does reduce transportation emissions, provides fresher food, and supports the local economy. Switching from a meat- eating diet to an entirely plant-based (vegan) diet would reduce dietary-based greenhouse gas emissions by about 50%. [Scarborough et al., 2014]
Reuse and Reduced Consumption
Finally, reducing overall consumption of goods reduces energy use and greenhouse gas emissions from the life cycle of those goods: extraction of raw materials, manufacture, transportation, use, and disposal. Take clothing, for example. In 2013, global emissions from just the cotton clothing industry were equivalent to 2 years worth of emissions from all passenger cars in New York State, and from polyester production alone, the emissions were equivalent to the emissions of 185 coal-fired power plants in a year, on average. [Kirchain et al., 2015] Buying clothing that is used instead of new reduces greenhouse gas emissions from the clothing sector. The growth of both local and large, online secondhand clothing retailers suggests that social norms are shifting in favor of this practice.
"Younger People Are Shifting to Secondhand Clothes: thredUP CEO" (2021) by Bloomberg Technology (YouTube)