Chapter Contents
- What is Mitigation?
- Climate Change Mitigation Strategies
- Summary and Additional Resources
- Activities for Climate Change Mitigation Chapter
Image above by Malte Reimold, from Pixabay
What is Mitigation?
Human activities, especially burning fossil fuels for energy, are increasing the concentrations of greenhouse gas in our atmosphere, which results in a warmer planet and other changes in our climate. We can address this issue in several ways. One way is to adapt and prepare for how to live with these changes. The other, explored in this chapter, is to reduce the sources of greenhouse gas emissions, thereby reducing the potential impacts. This latter approach is called climate change mitigation.
Mitigation is a human intervention, and as such it involves the complex intersection of science, ethics, economics, politics, social equity, population growth, and industrial and land development. In addition, because greenhouse gases mix throughout the Earth’s atmosphere, mitigation actions require international cooperation. Different countries and communities may take different actions, but ultimately we’re all in this together.
Mitigation and Adaptation in Parallel
The Earth’s climate system changes slowly, and the greenhouse gases that we have already emitted are going to change the climate over the next decades and centuries even if we stop emitting all greenhouse gases tomorrow. This is why adaptation strategies are necessary. Mitigation strategies, on the other hand, ultimately are intended to reduce the severity of climate change impacts by reducing future emissions of greenhouse gases. Future adaptation will be much harder if we don’t reduce greenhouse gas emissions today.
Mitigation and adaptation strategies can sometimes conflict and sometimes go hand-in-hand. For example, one strategy to adapt to the more intense heat waves that much of the US can expect is to expand the use of air conditioning to protect people from heat-related illness. But more air conditioning means more energy use, which releases more heat-trapping greenhouse gases (if our power plants are the conventional, fossil-fuel burning ones we use predominantly today).
On the other hand, we could adapt to more extreme heat by keeping buildings cooler through the use of insulation and reflective roofs. This could keep people cooler without using more air conditioning. In this example, the “green” building practices accomplish both adaptation and mitigation.
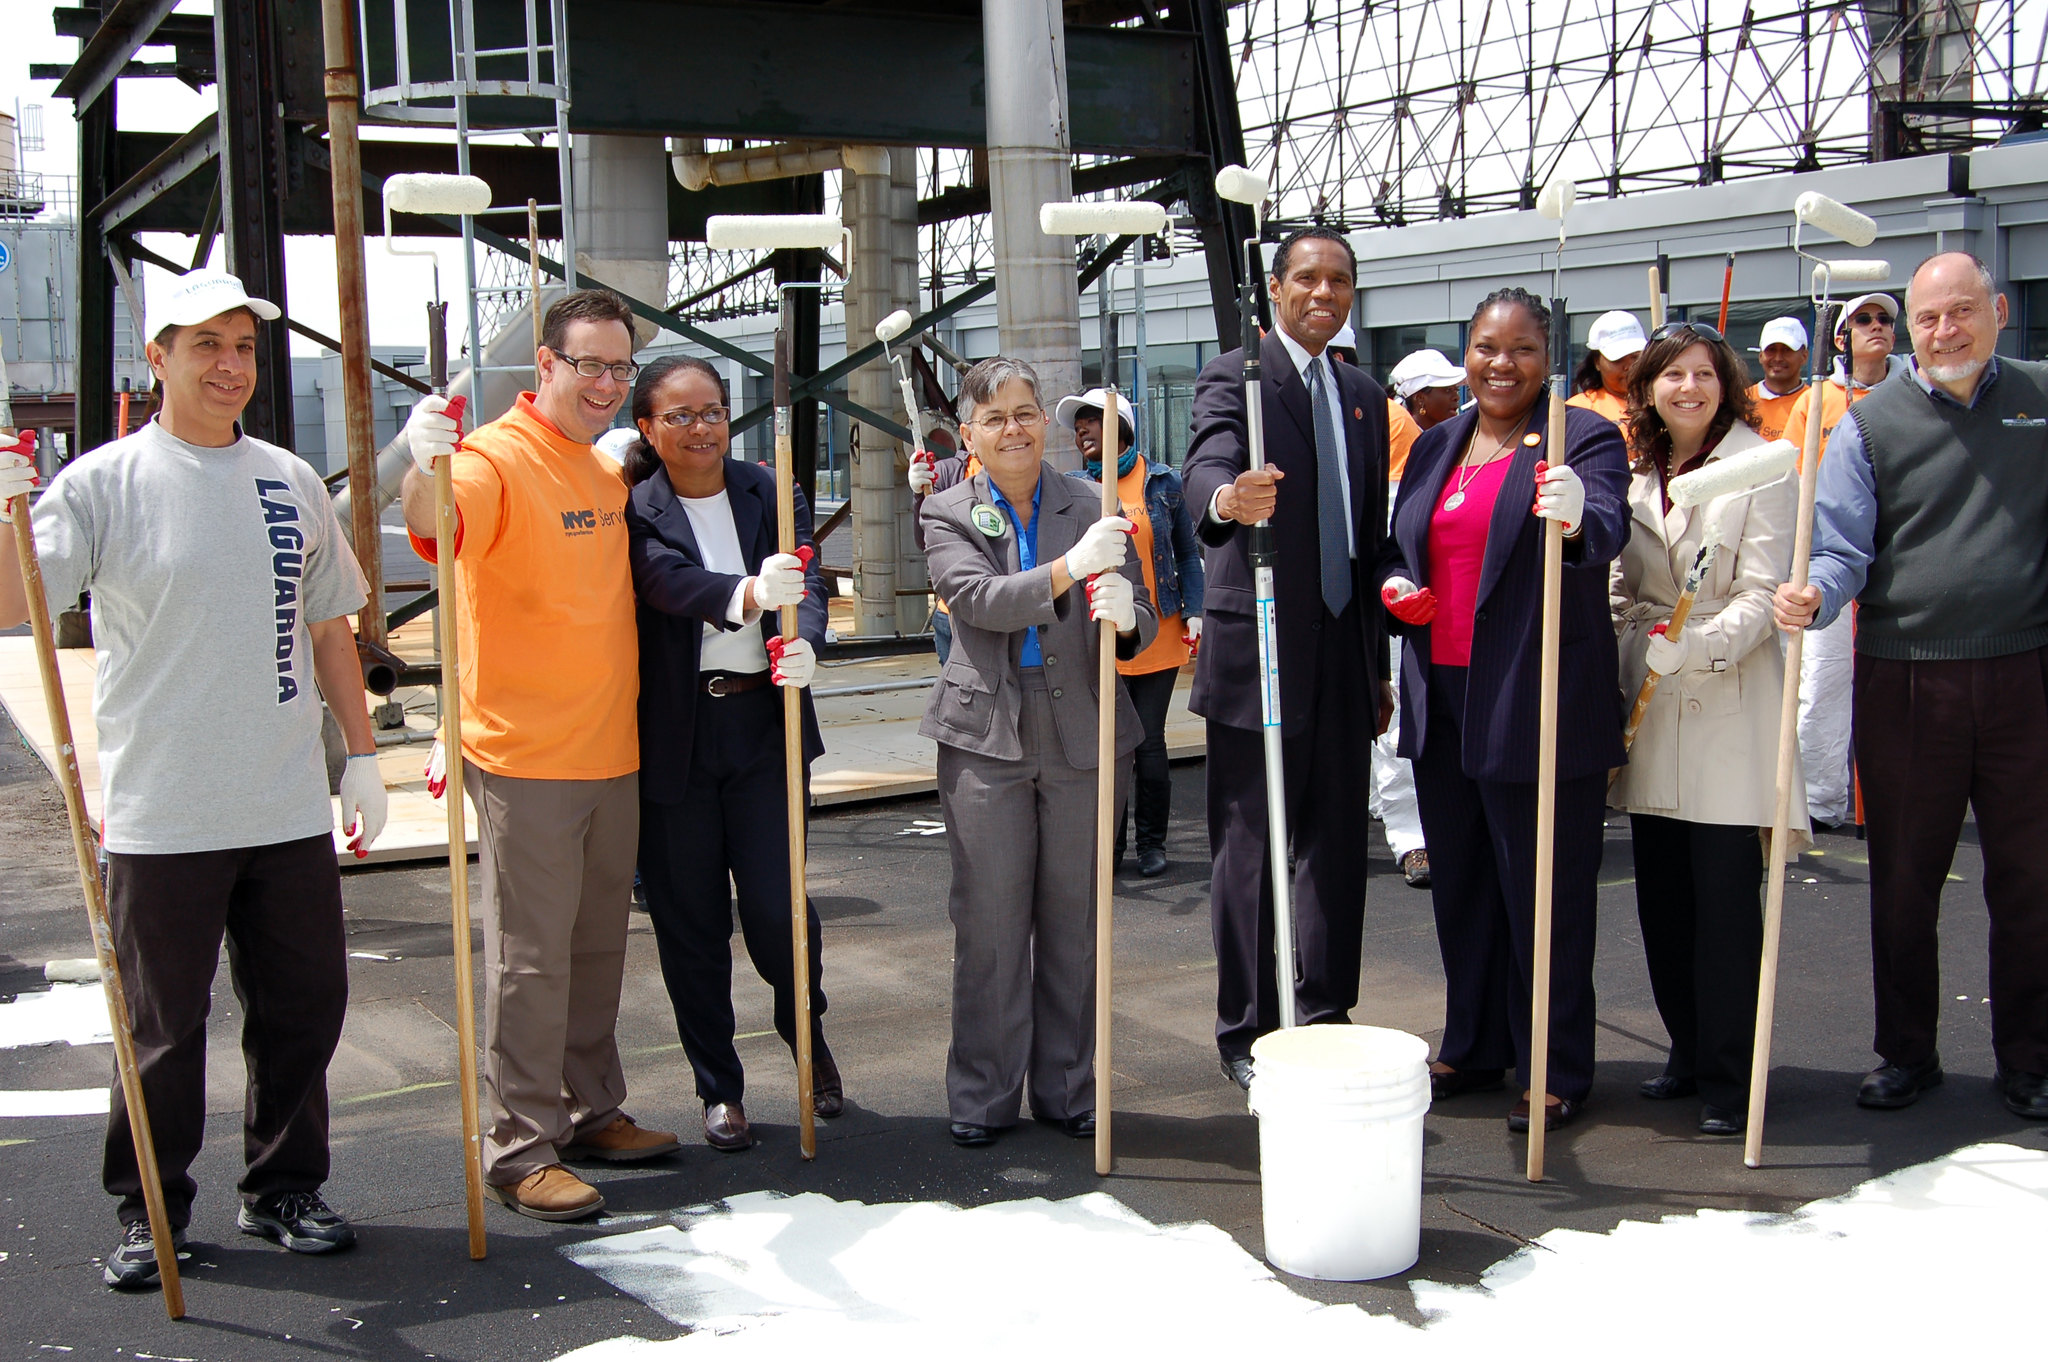
Launch of a cool roof project at LaGuardia Community College in Queens, NY. The white paint on the roof surface reflects away sunlight, keeping the roof cooler than it would be with a dark surface. Photo: Community Environmental Center (CC BY-NC 2.0 via Flickr)
Addressing climate change is going to require parallel efforts that implement both adaptation strategies and mitigation strategies simultaneously. We will need to help vulnerable populations (for example, those at the lowest levels of income, and those living on ocean coasts) adapt to the changes that are already happening. We will also have to help the major emitters of greenhouse gases reduce (that is, mitigate) their emissions in order to limit future warming. We cannot rely on adaptation alone because the ultimate impact of unmitigated emissions of greenhouse gases will be very severe, and we cannot rely on mitigation strategies alone because historical greenhouse gas emissions are already changing our planet and impacting people around the globe.
What We're Up Against
Mitigation efforts currently face an uphill battle, because the trends in anthropogenic greenhouse gas emissions (i.e., emissions resulting from human activities) show a continued increase in the last few decades. Below is a summary of these trends:
- Over half of cumulative anthropogenic CO₂ emissions between 1750 and 2019 have taken place since 1990.
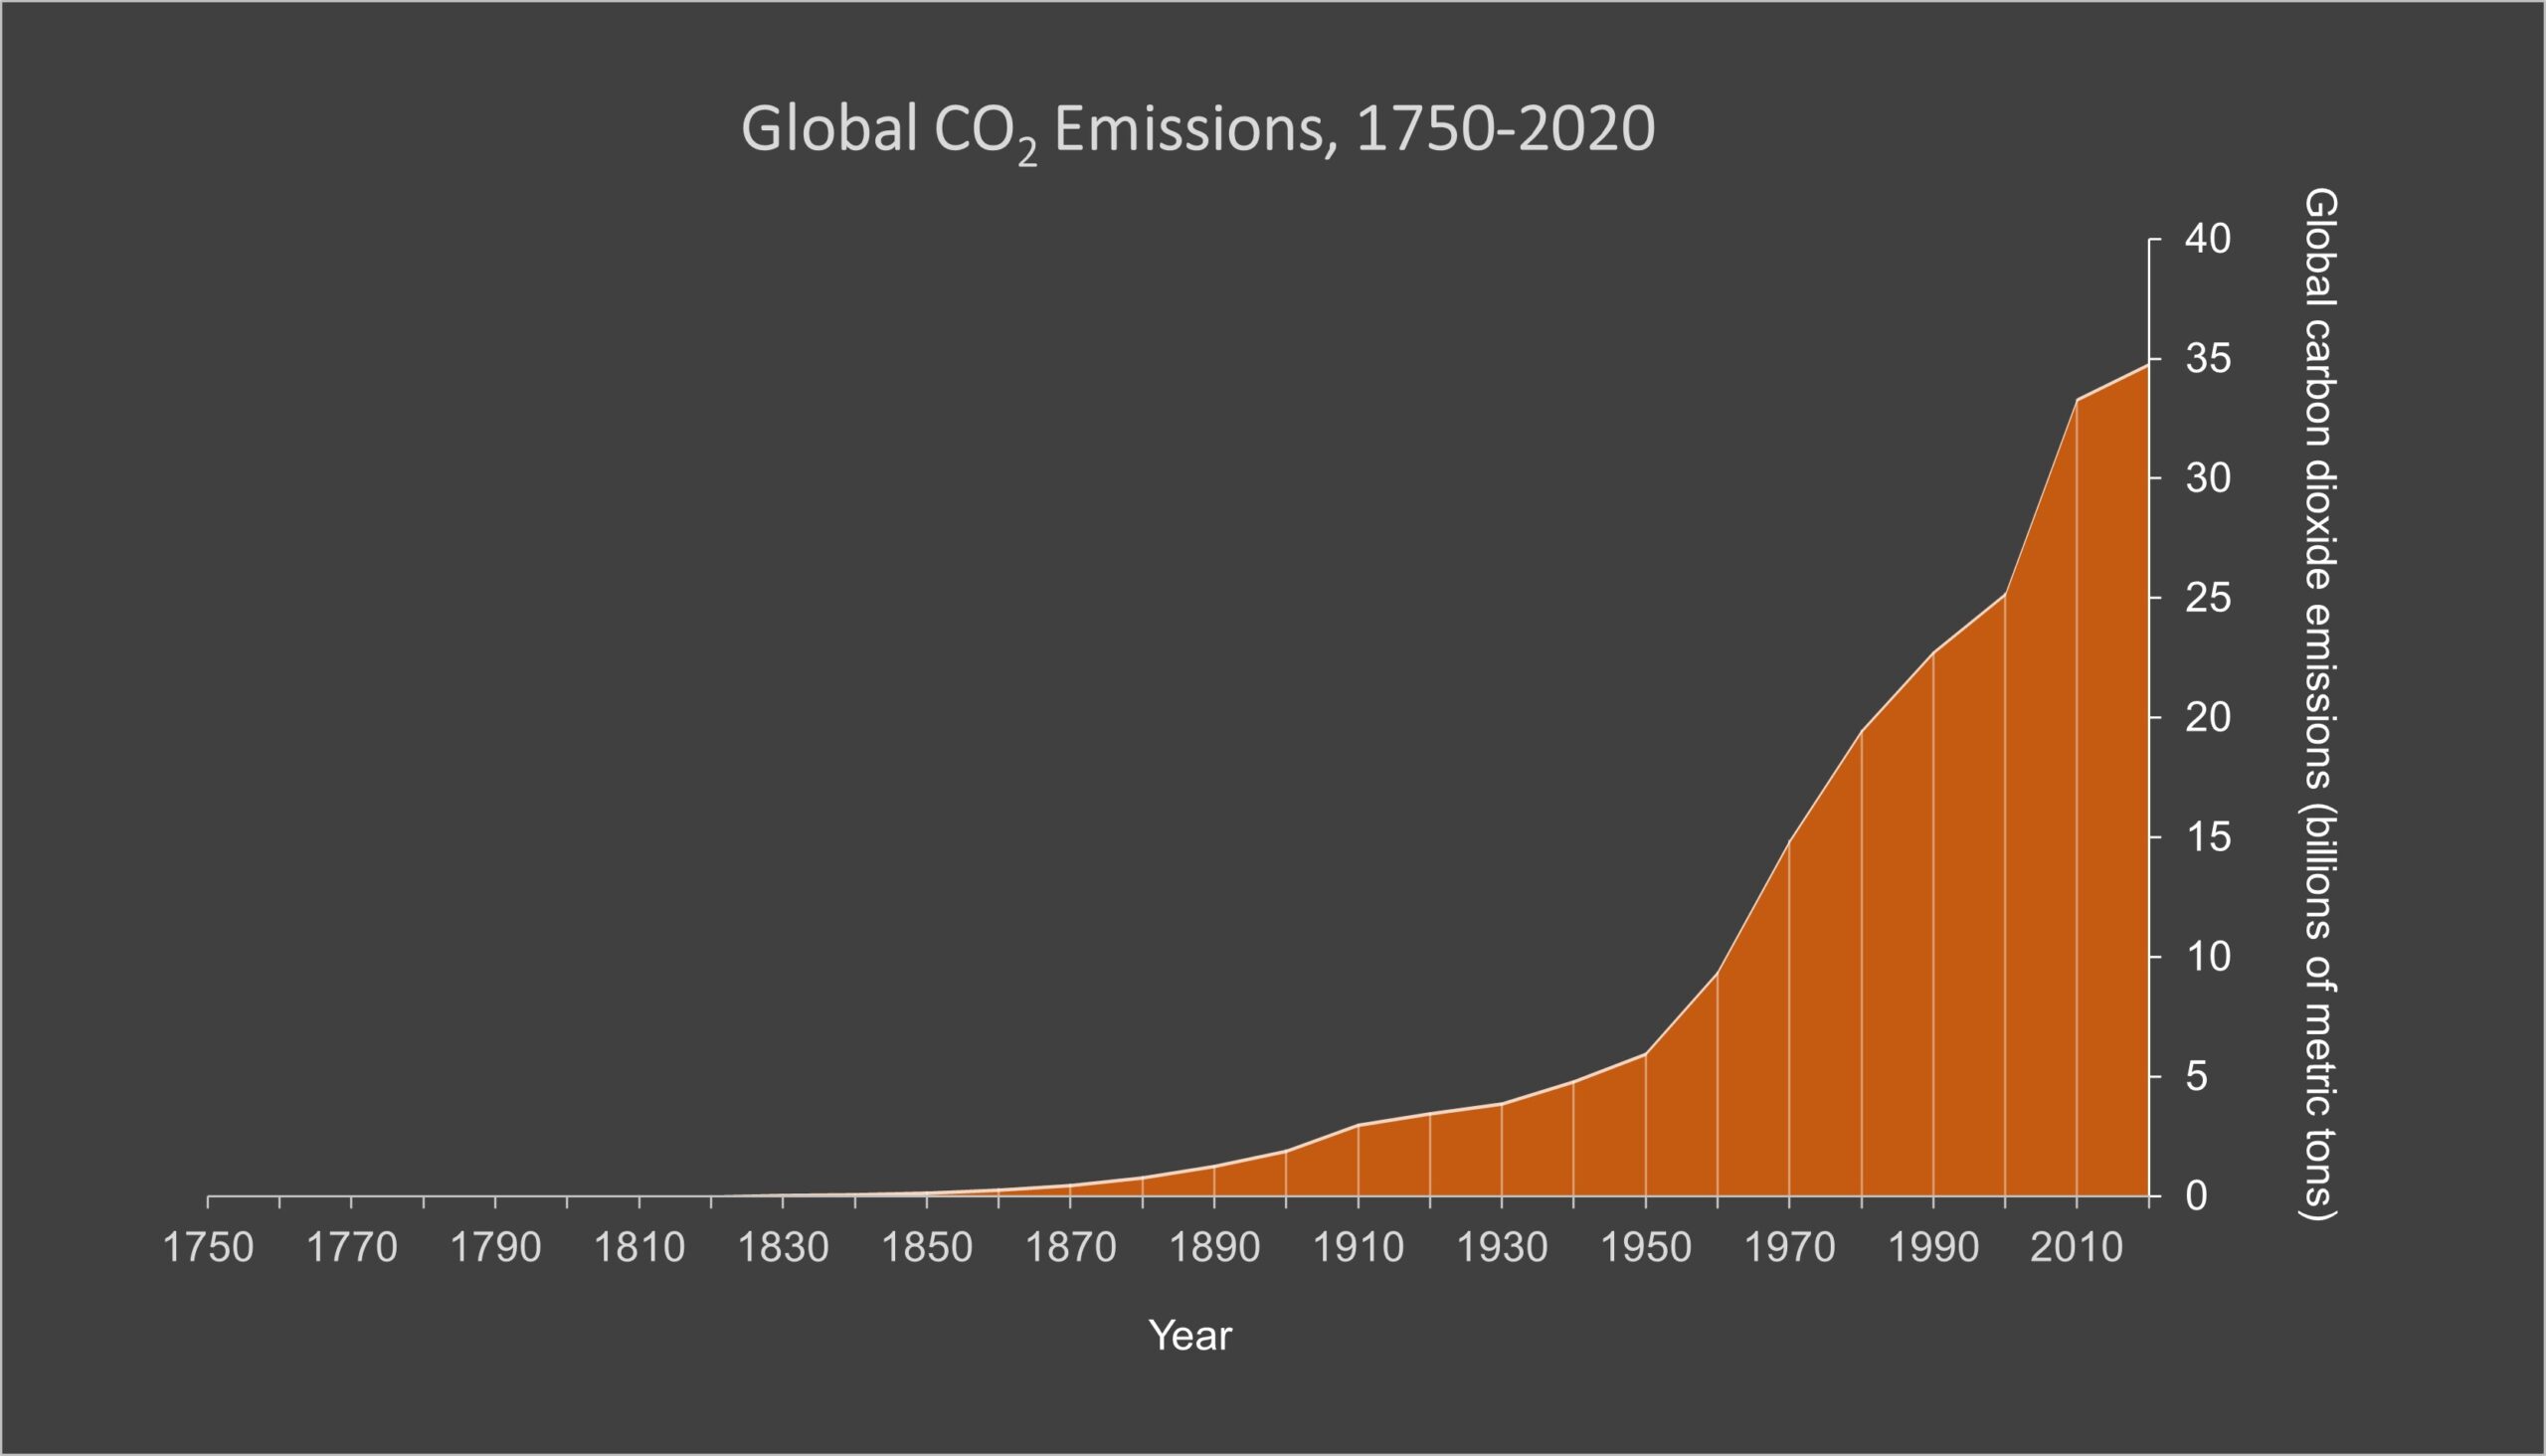
Figure created by Ingrid Zabel for PRI's Earth@Home project (CC BY-NC-SA 4.0 license), with data from OurWorldInData.org
- Global annual anthropogenic greenhouse gas emissions have increased from 32.6 GtCO₂eq in 1990 to 48.9 GtCO₂eq in 2018. (Source: OurWorldInData.org, accessed April, 2022)
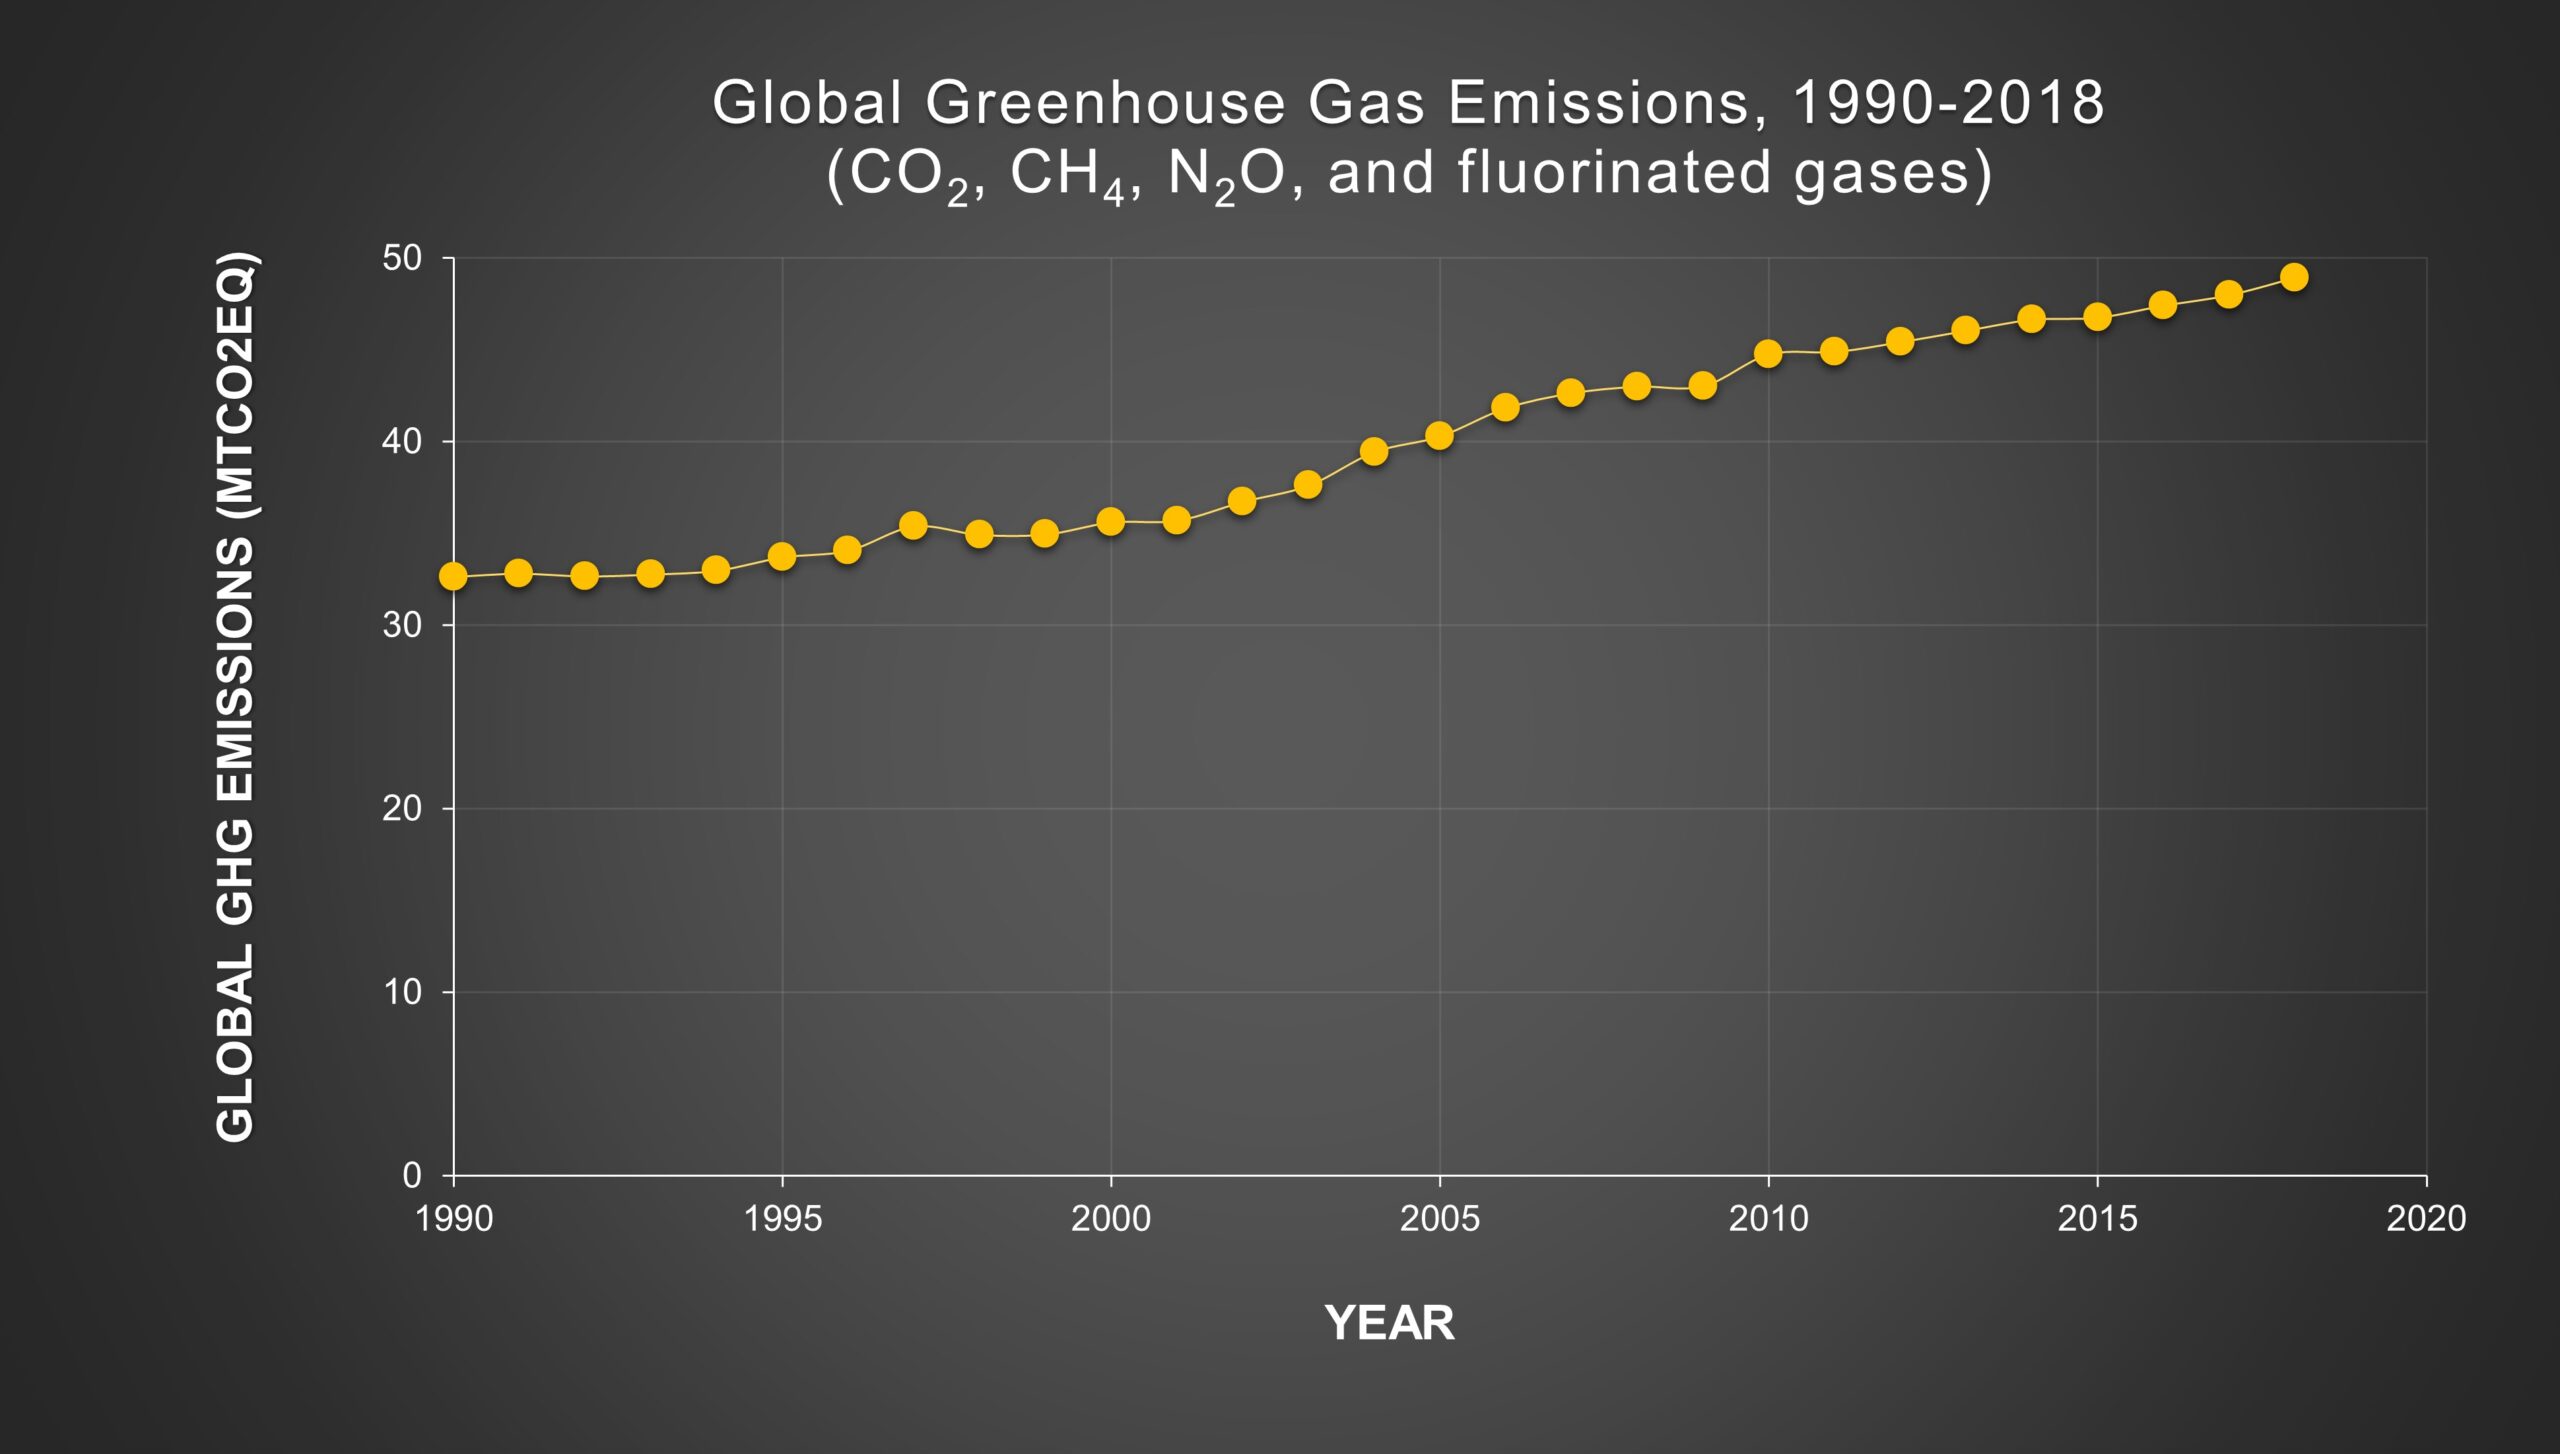
Figure created by Ingrid Zabel for PRI's Earth@Home project (CC BY-NC-SA 4.0 license), with data from OurWorldInData.org
What do the units GtCO₂eq mean?
The "G" stands for the unit prefix giga, which represents a billion (10⁹). The "t" stands for tonne, which is a metric ton or 1,000 kg. CO₂ is carbon dioxide, and "eq" stands for equivalent. The unit of GtCO₂eq is used to describe a quantity called the Global Warming Potential (GWP) of a greenhouse gas. The GWP is a way to measure the relative warming effects of different greenhouse gases, and it tells you how much warming a certain mass of a greenhouse gas would lead to in a given time period, compared to warming from CO₂. The typical time period used by climate scientists for calculating GWP is 100 years, though some argue that it is important to consider shorter time scales when considering effects of highly potent, short-lived (on the order of a decade) greenhouse gases such as methane (CH₄). For the sake of clarity, we will use the term GWP100 when considering a 100-year time horizon. Example: Assume that nitrous oxide (N₂O) has a GWP100 of 280. This means that emissions of one ton of N₂O is equivalent to emissions of 280 tons of CO₂ over the next 100 years.
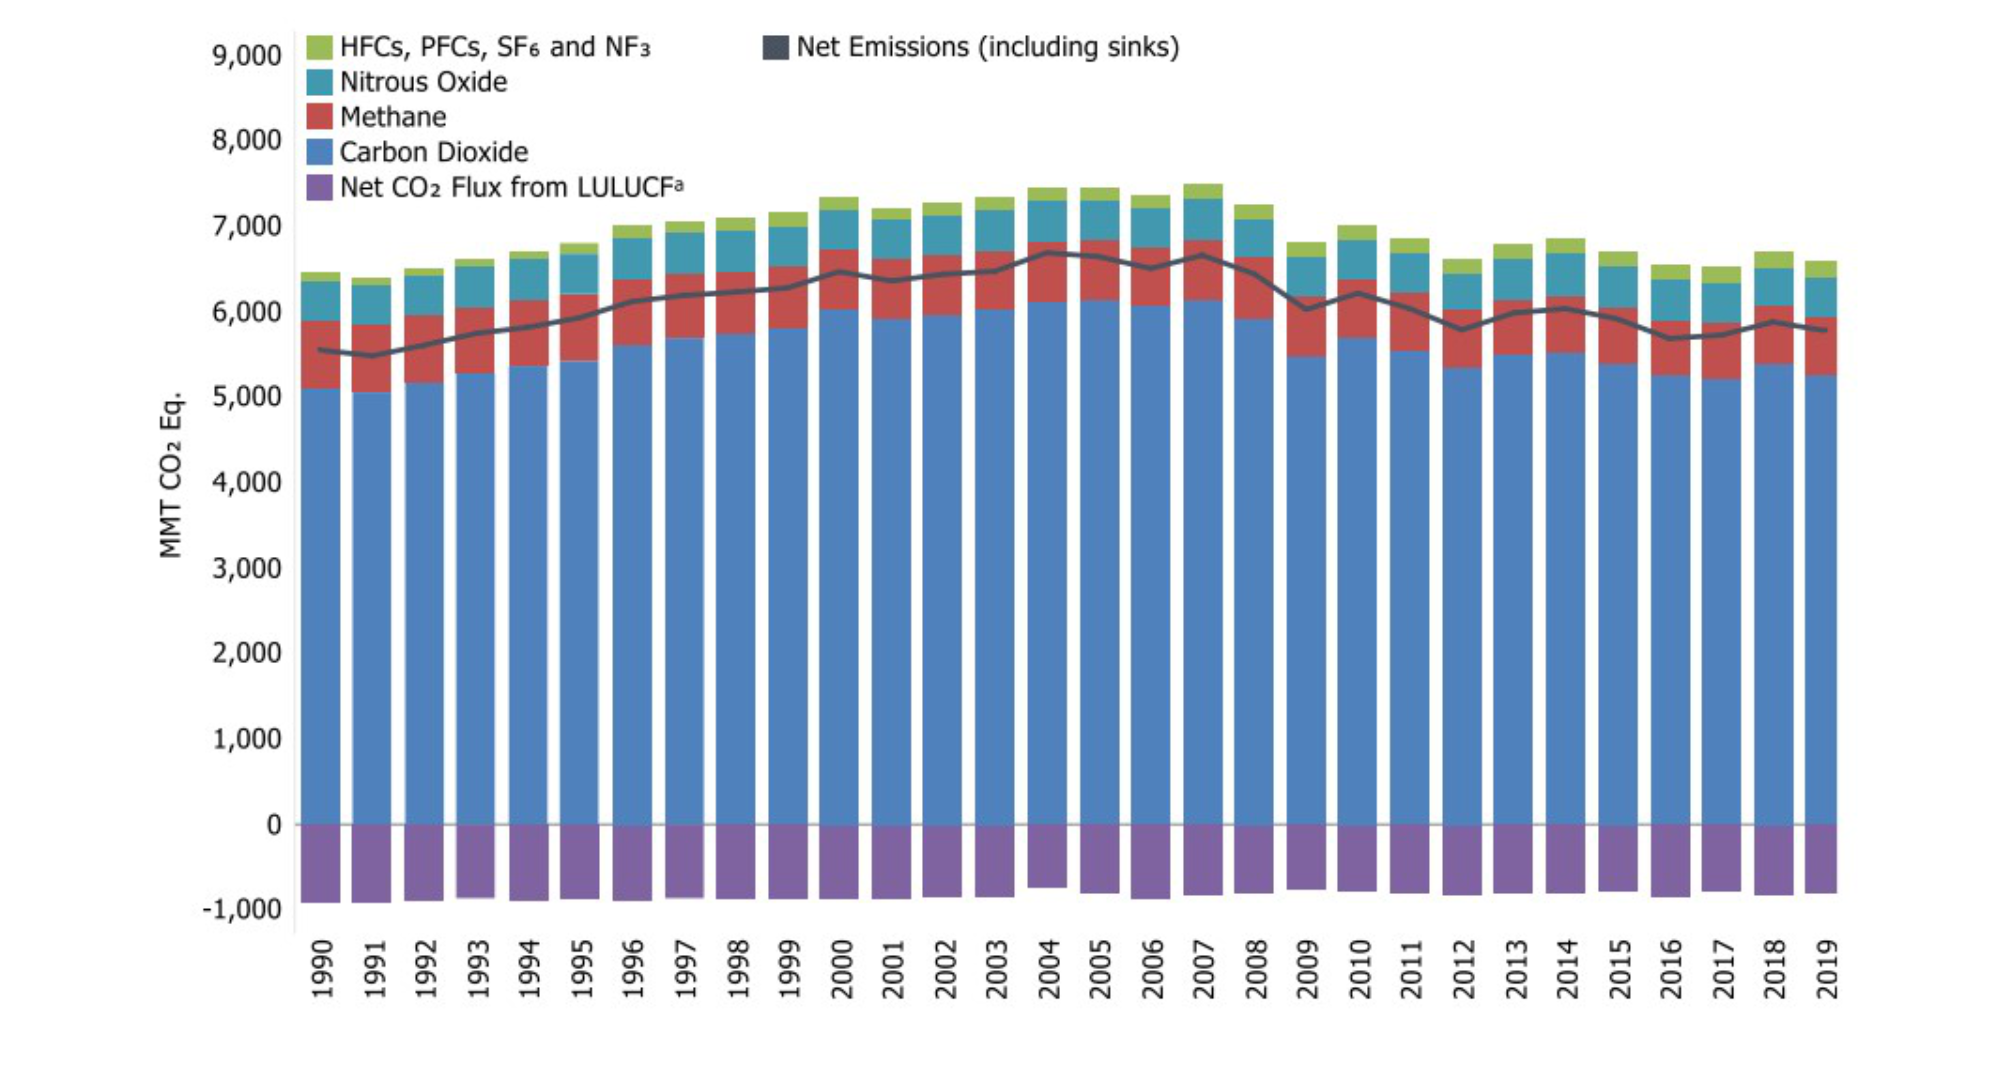
- Carbon dioxide (CO₂) is the main greenhouse gas emitted from human activities, making
up 74.4% of the total in 2016. It is followed by methane (CH₄) at 17.3%, nitrous oxide (N₂O) at 6.2%, and
fluorinated gases at 2.1%. (Source: OurWorldInData.org, accessed October, 2021) - According to climatewatchdata.org, an online platform managed by the World Resources Institute, "about 60% of GHG emissions come from just 10 countries, while the 100 least-emitting contributed less than 3%." Those ten countries are China, USA, India, Russia, Indonesia, Brazil, Japan, Iran, Germany, and Canada.
- In 2016, anthropogenic greenhouse gas emissions came mainly from energy (electricity, heat, and transport, 73%), agriculture, forestry, and and land use (19%), direct industrial processes like cement and chemical production (5%), and waste (3%). (Source: OurWorldInData.org, accessed October 2021)
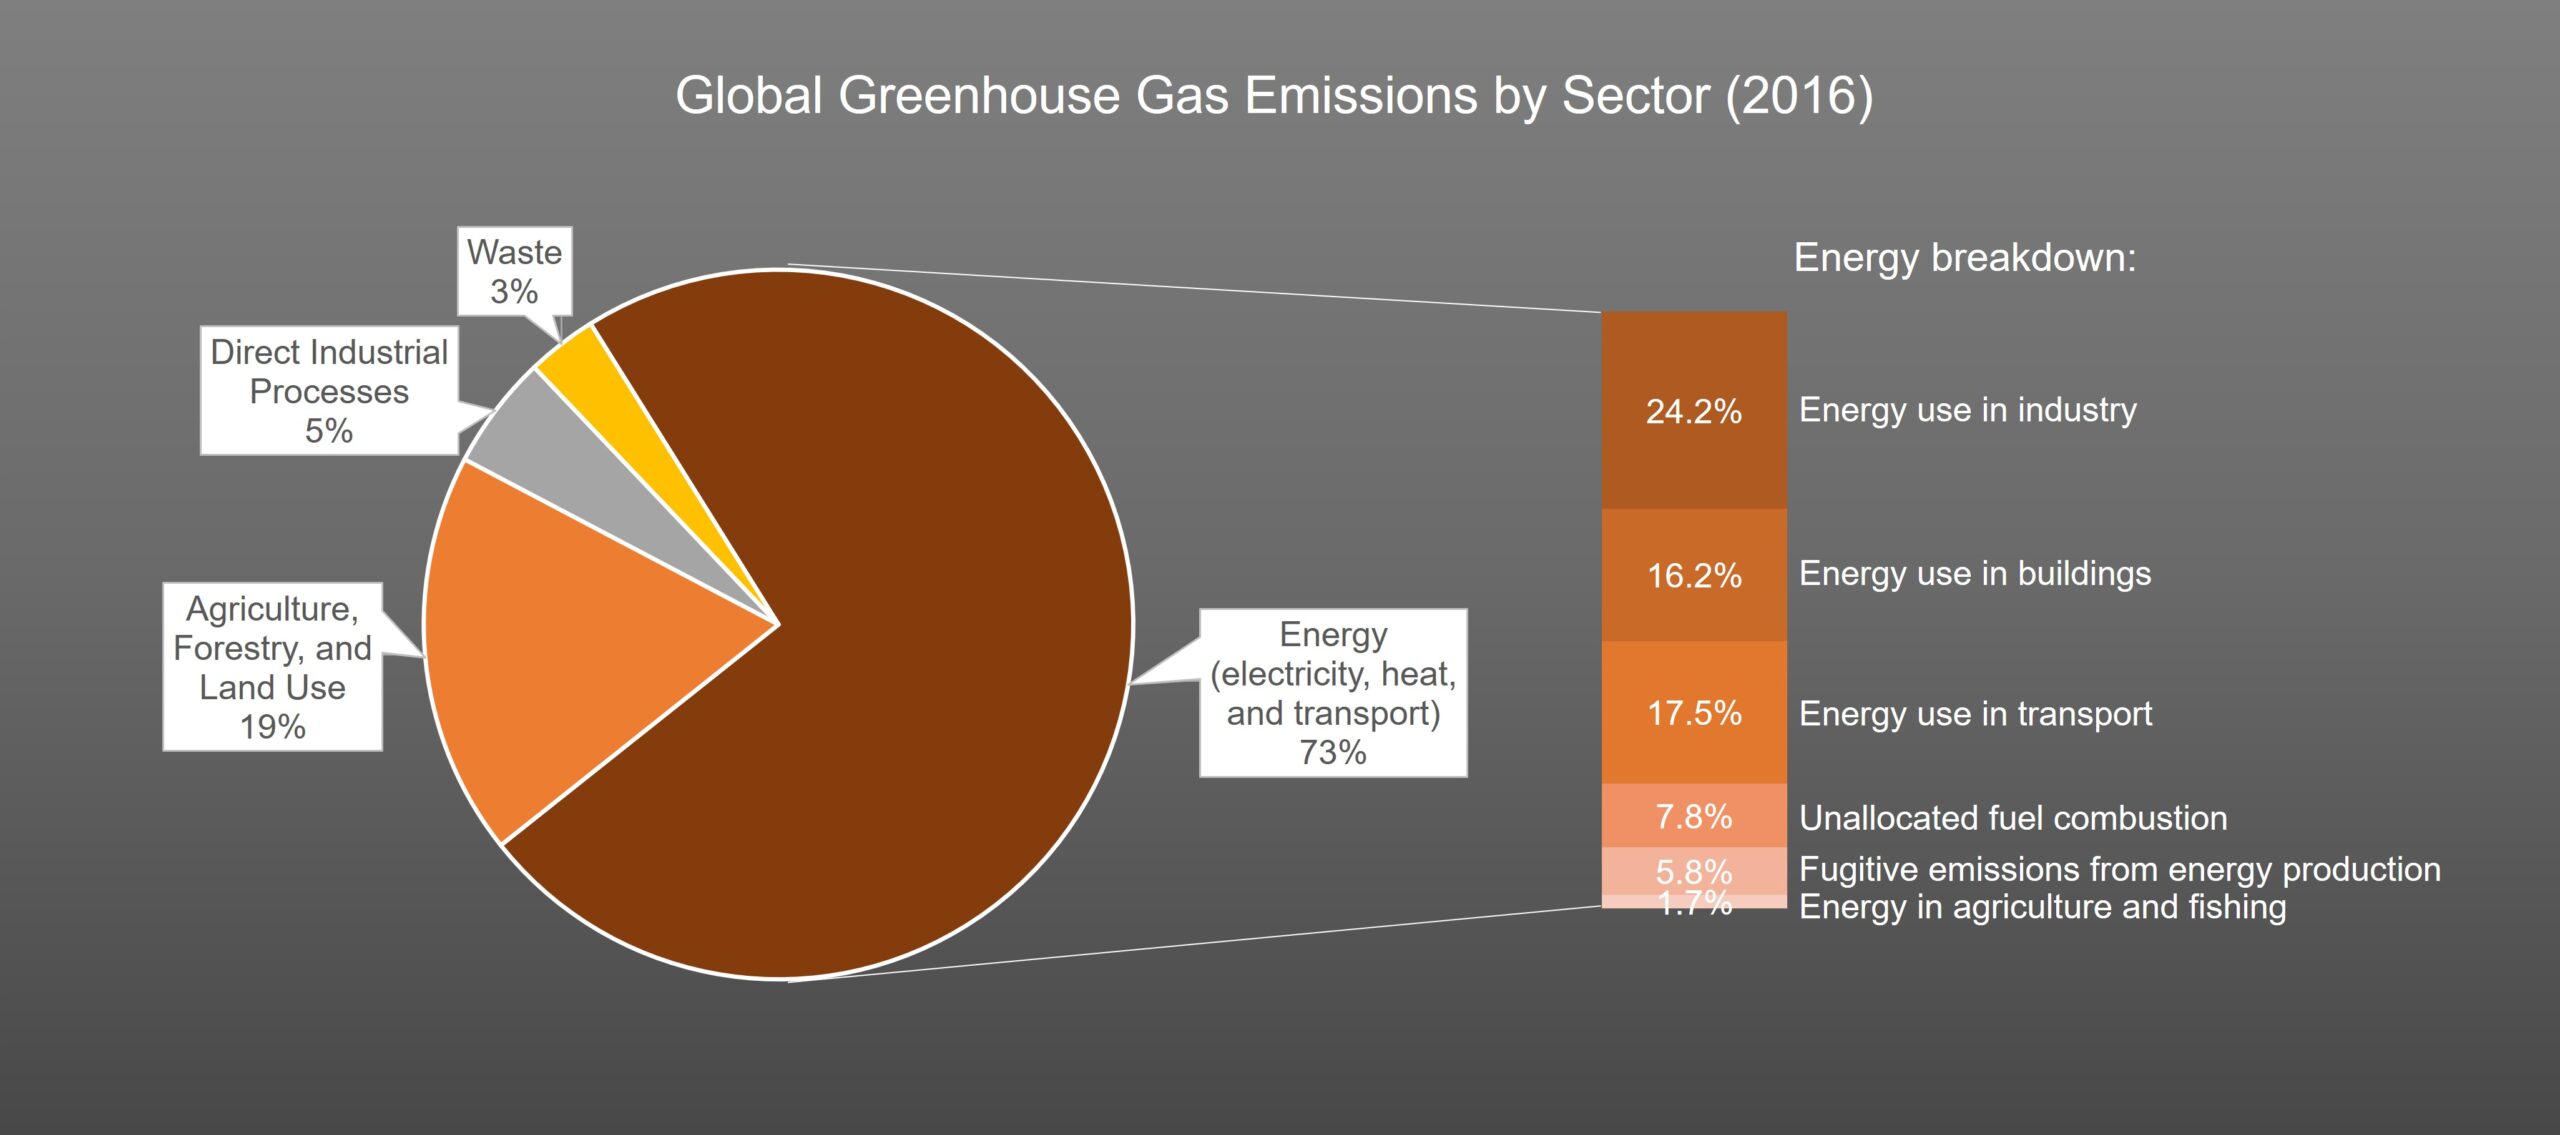
Figure created by Ingrid Zabel for PRI's Earth@Home project (CC BY-NC-SA 4.0 license), with data from OurWorldInData.org
Mitigation Pathways and Stabilization Wedges
The Intergovernmental Panel on Climate Change (IPCC), a large, international group of scientists considered to be the most authoritative source of information on global climate change, has concluded that we must keep the increase in the world’s temperature to less than 2° C (3.6° F)—and ideally less than 1.5° C (2.7° F)—above the pre-industrial temperature by the end of the 21st century in order to avoid devastating impacts from climate change.
Why is 2° C considered the limit of acceptable warming for our planet? The idea of an average surface warming of 2° C (3.6° F) above preindustrial temperature as the upper limit of acceptable warming was born in the 1970s and grew in acceptance over the next few decades. The temperature number came out of scientific considerations of the temperature conditions under which human societies developed and the impacts of increased warming, including drought and heat waves that would decrease the world’s food supply, sea level rise that would flood coastal cities and lead to large-scale refugee migrations, and extreme weather events that would lead to loss of life and damage to infrastructure. Scientists and policymakers have questioned the 2° C limit and continue to debate it. At Paris United Nations Climate Change Conference in 2015, a group of countries pushed for actions to limit warming to 1.5° C (2.7 °F).
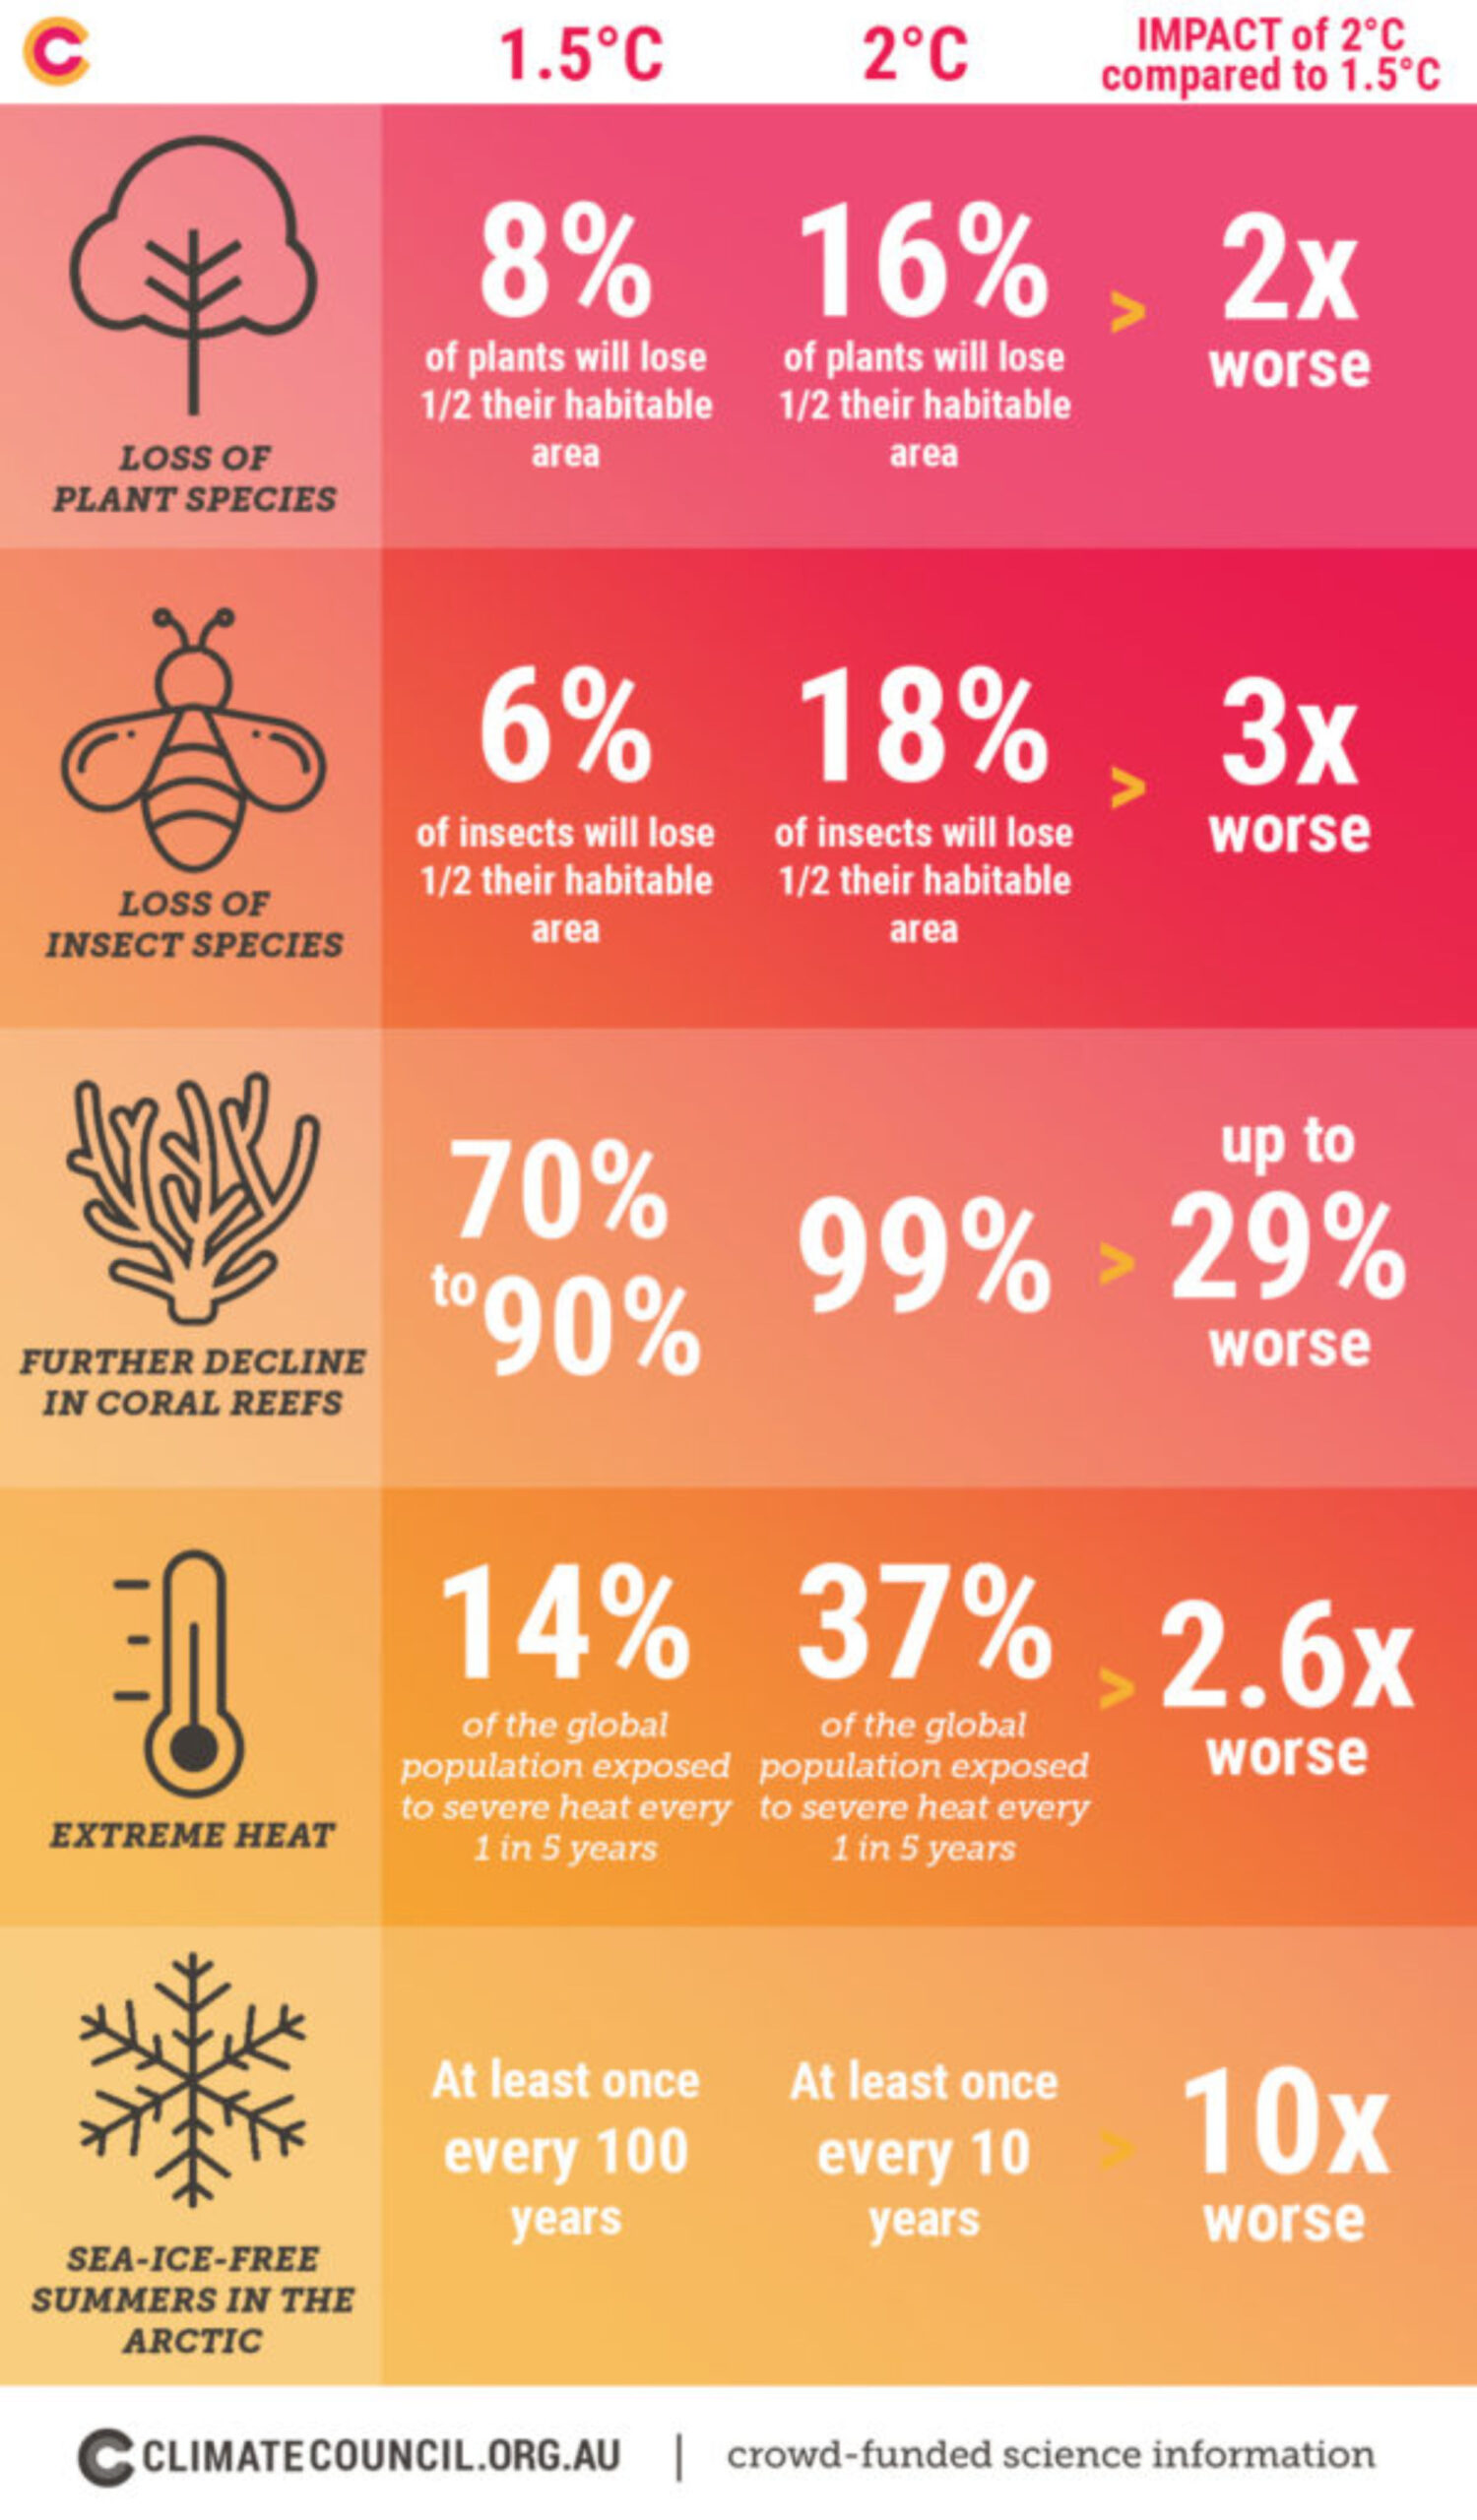
Infographic showing different impacts of a rise in Earth's average temperature of 1.5°C and 2°C above pre-industrial temperature, based on the 2018 IPCC report "Global Warming of 1.5°C". Infographic by Climate Council of Australia Limited (CC BY 3.0 AU)
Mitigation pathways are different combinations of technological and behavioral solutions that can help us meet different temperature targets. Different pathways lead to different levels of greenhouse gas reductions, and have different impacts on society. Pathways with larger and faster emissions reductions lead to smaller global temperature increases in the future, which will make adaptation to unavoidable change easier. These pathways may, however, be harder to implement for political and economic reasons.
For example, consider the two opposite extremes: first, business as usual, where we do not change our current mitigation efforts, and second, an immediate and complete stop to our use of fossil fuels. Both of these options are bad. Failure to reduce our fossil fuel dependence is certain to lead to immense human suffering. Immediate cessation of fossil fuel use is impossible as our infrastructure and economies are designed for fossil fuels. We need to be working in the middle space between these two end members. This means not only re-designing the way we produce energy by building and deploying non-carbon energy technologies such as solar and wind, but we also need to re-design the way we use energy. For example, instead of heating our homes with oil and gas we need to switch to electric heat that can be produced renewably. Instead of driving individual cars that burn gasoline we need to switch to electric vehicles and build out our public transportation networks. And given that we cannot just flip a switch for an immediate transition from a fossil fuel world to living fossil fuel-free, we are going to need to work on both mitigation and adaptation strategies that we implement in parallel to reduce disruption and suffering. Clearly, the faster we can mitigate the less we will have to adapt, and the better the ultimate outcome will be.
The actions in some mitigation pathways can have adverse side effects. For example, nuclear power plants emit far fewer greenhouse gases than do fossil fuel-burning power plants, but nuclear power plants also produce radioactive waste that is difficult to dispose of and raise serious concerns about catastrophic accidents. Mitigation pathways can also have co-benefits, that is, they can produce results that are beneficial beyond reducing greenhouse gas emissions. For example, strategies that reduce air particulate pollution improve the health of people and ecosystems, and create energy systems and communities that are more sustainable. These pathways are sometimes referred to as “win-win” pathways.
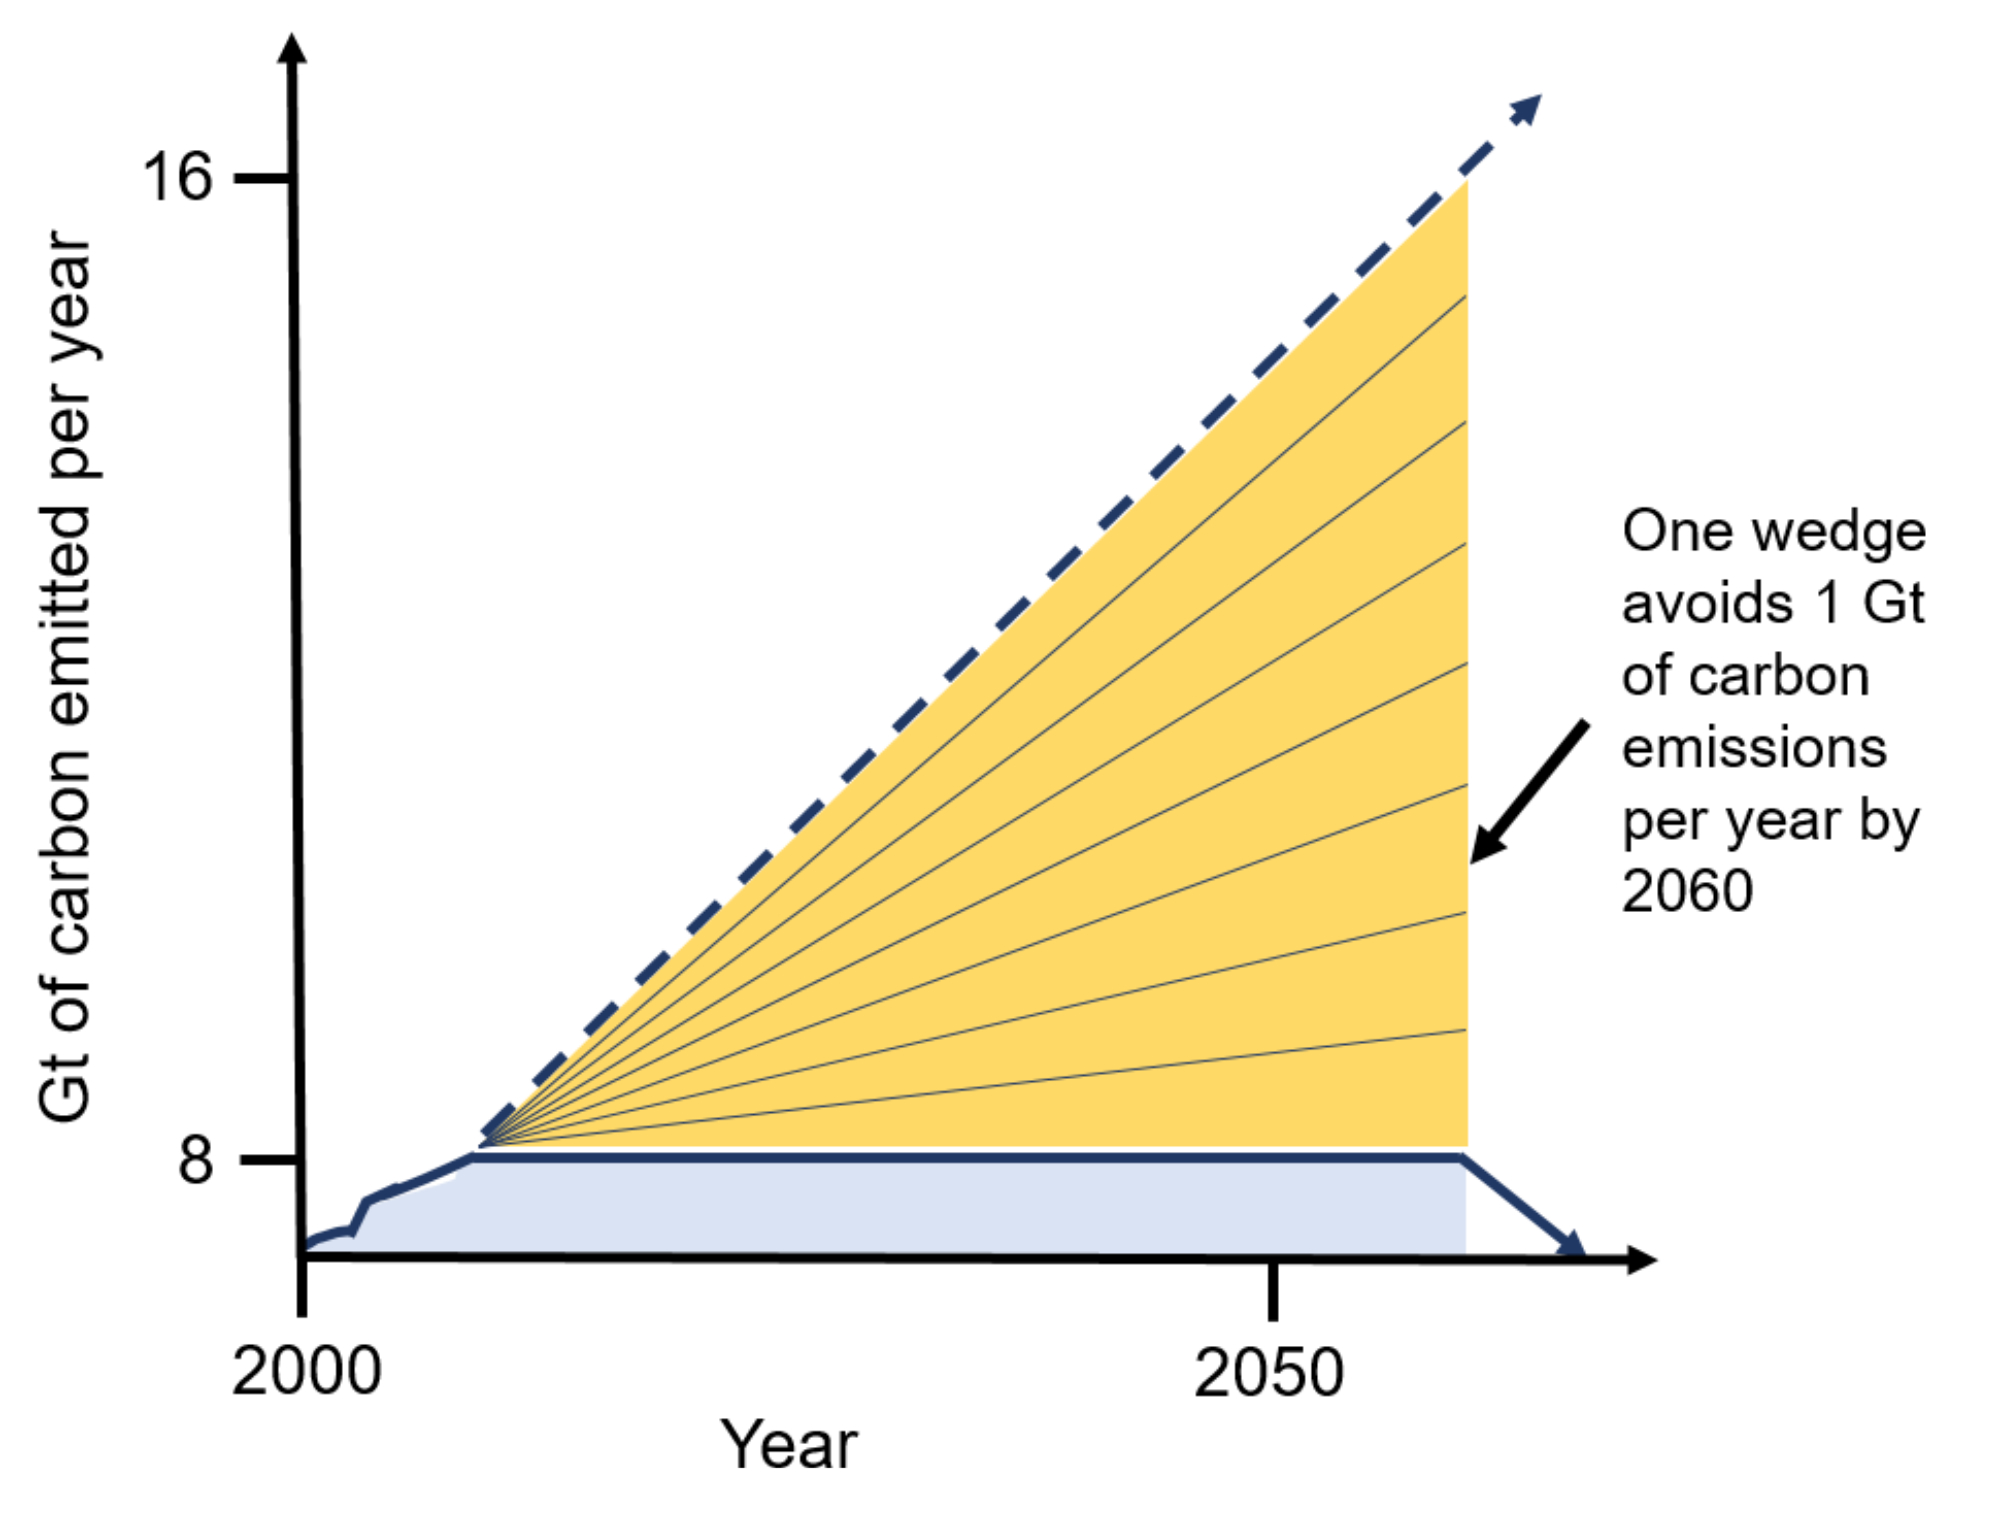
Another way to think about mitigation pathways is through the concept of “stabilization wedges.” The figure below shows a plot of carbon emissions over time. Historical emissions have increased at a rapid rate in the 20th century and early 21st century, and if emissions continue at the rate of this current path they will lead to dangerous warming. If instead emission rates are flat in the future, it will be easier to adapt to climate change. The area between the dashed line (current path) and the flat path is called the Stabilization Triangle, and it represents the future carbon emissions we need to avoid in order to stay on the flat path.
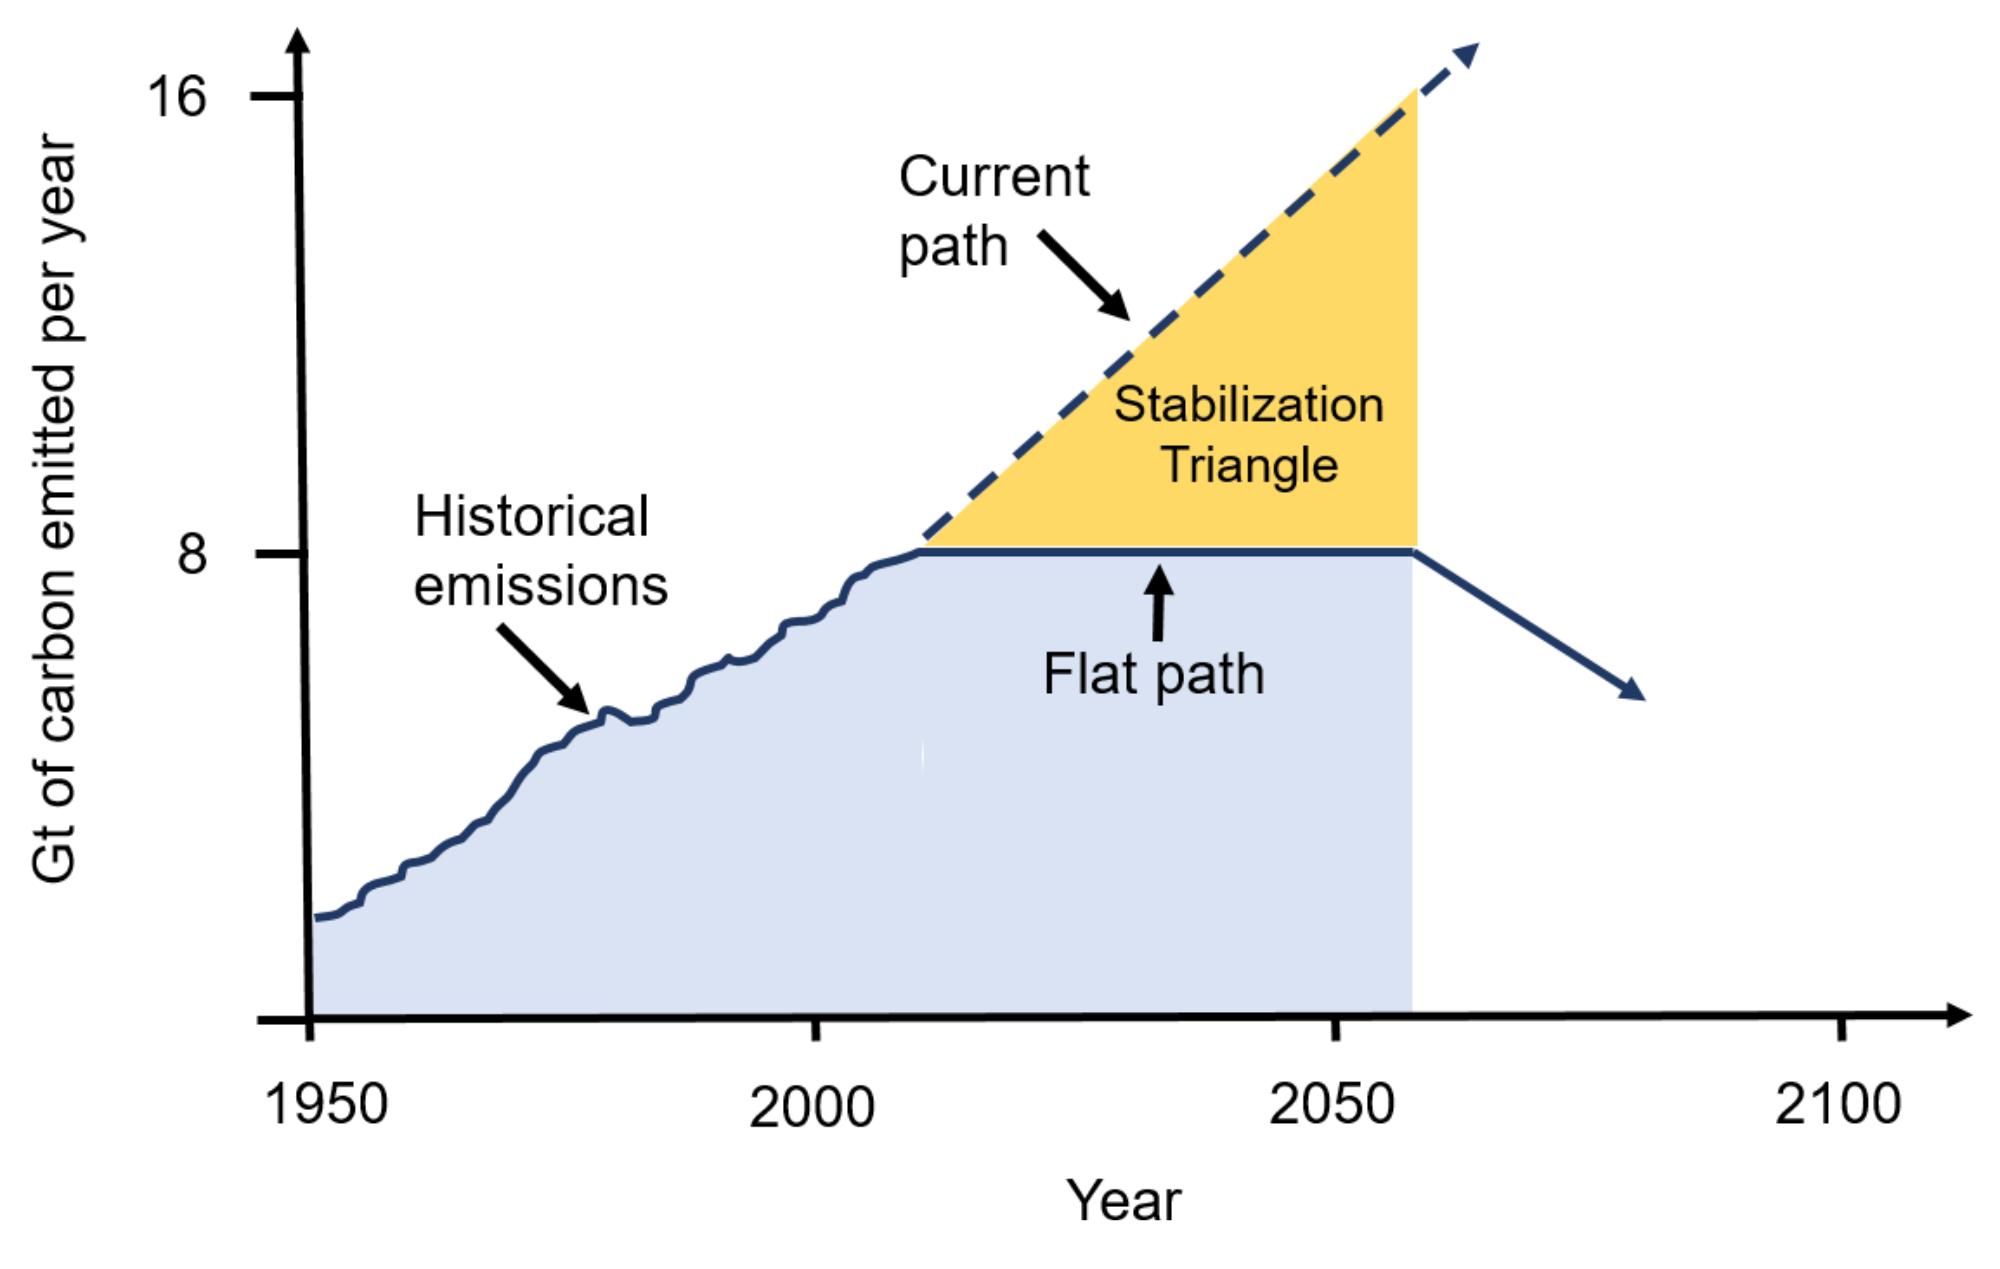
Carbon emissions over time, including historical emissions and two future paths, one following the current trend and one that remains flat and eventually decreases. The area between these paths is called the Stabilization Triangle, and represents the future emissions we will need to avoid to move from the current path to the flat path. Figure adapted from image with permission from Carbon Mitigation Initiative, Princeton University.
How do we move from the current path to the flat path? In other words, how do we reduce carbon emissions represented by the area of the Stabilization Triangle? Like many big problems, the solution can be broken into parts, and we can undertake a variety of strategies. In fact, we need to employ multiple strategies, since no one strategy is sufficient for solving the climate crisis.
These multiple strategies are represented by Stabilization Wedges (see figure below), which together can reduce the emissions of the entire Stabilization Triangle. Examples of these strategies are:
- increasing energy efficiency in all sectors of the economy (using less energy);
- using renewable energy (wind, solar, hydropower, geothermal, and biomass energy);
- using nuclear energy;
- replacing coal-burning power plants with natural gas-burning power plants and/or moving away entirely from fossil fuel-burning power plants (decarbonization);
- electrifying transportation, heating and cooling, and industrial processes together with moving to non-fossil fuel sources of electricity;
- carbon capture and storage;
- increasing natural carbon sinks through forestry and agricultural practices.
The remainder of this chapter addresses these strategies.