

Chapter Contents
Credits: Benjamin Brown-Steiner
Updates: Page last updated April 15, 2024
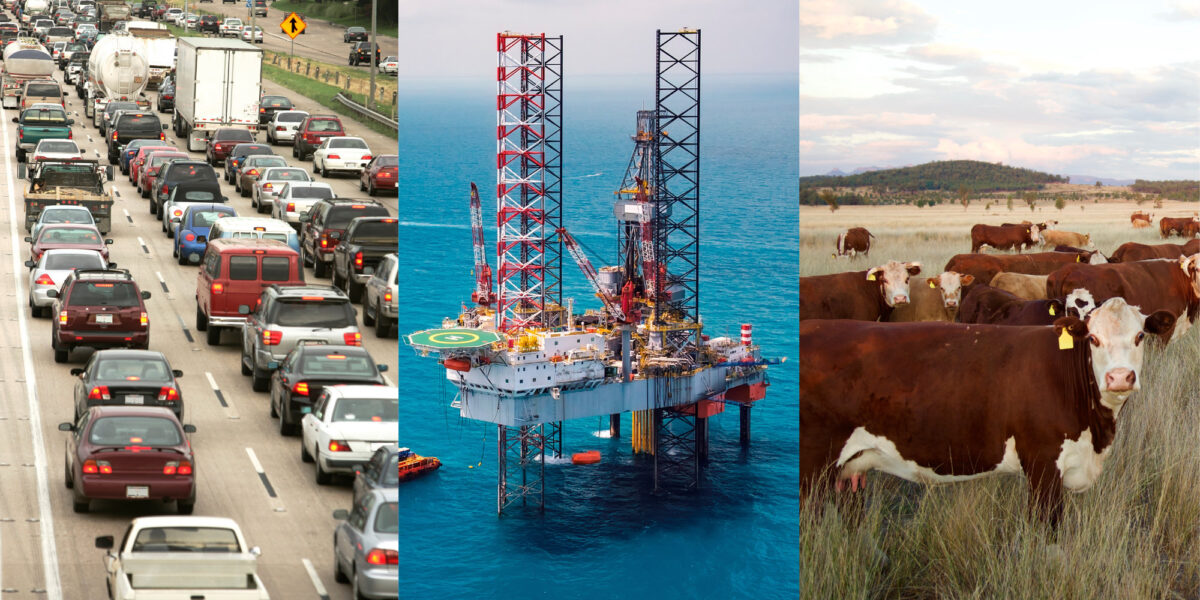
Image above: Photos of activities that produce planet-warming greenhouse gas emissions: transportation using internal combustion engine vehicles, oil production, and beef production. Figure by Ingrid Zabel for PRI's Earth@Home project (CC BY-NC-SA 4.0 license), with images from Canva.
What are climate emissions scenarios and who uses them?
While we have a long observational and proxy-based dataset of past climate, there is only one way to imagine possible future climates: simulations using climate models. Climate models are mathematical approximations of our best guess as to the way the climate system works, and while they can be astonishingly complex, at their core there are three primary components: (1) data in; (2) math and science; (3) data out.
Data In
In order to make an educated guess about anything in the future, whether it be the odds of a touchdown during the next play or the afternoon high temperature in a week, you need to know something about the system. How good is the team’s offense? What’s the usual temperature range this time of year? If you do not know much about the system, you can still make a guess, but your certainty about the outcome will be lower. The better you know the system, the better your guess will be, and the more confident you will be in the outcome.
Math and Science
A lot of work goes into developing the best models and the best model components, and this is covered largely in the previous section on climate models. But in an oversimplified nutshell, all of our math and science knowledge gets coded up into a program which takes the data we put in and uses it to make updates or to calculate changes in other model components or variables.
Data Out
Once the model has made these updates, it needs to report back to us what happens, and this comes in the form of model output. Most models do not output all the updates they calculate internally – this would be too much information! – so we specify in the model run what we want to be output. This output data can be used as input data for another model simulation, or it could be “post-processed” and used to understand what the model has simulated. Modelers scrutinize model output to check for errors or unexpected behavior, which can easily creep into a simulation. Variables can diverge far away from realistic values, which can lead to ridiculous predictions, or even diverge to the point where something breaks in the model. This could happen if, somewhere in the code, the model tries to do something that is not possible, such as divide something by zero. When this happens, the model “crashes,” the simulation ends, and a long list of error messages is output.
Modelers have many mantras they return to time and again, and one of these is: “Garbage in, garbage out.” If you feed your model bad input data, you should not expect great output data. In contrast, if you work hard to feed your model excellent data, you might have a good answer on the other side.
This is all to provide some context for the main point of this section: what are the emissions scenarios used in climate models?
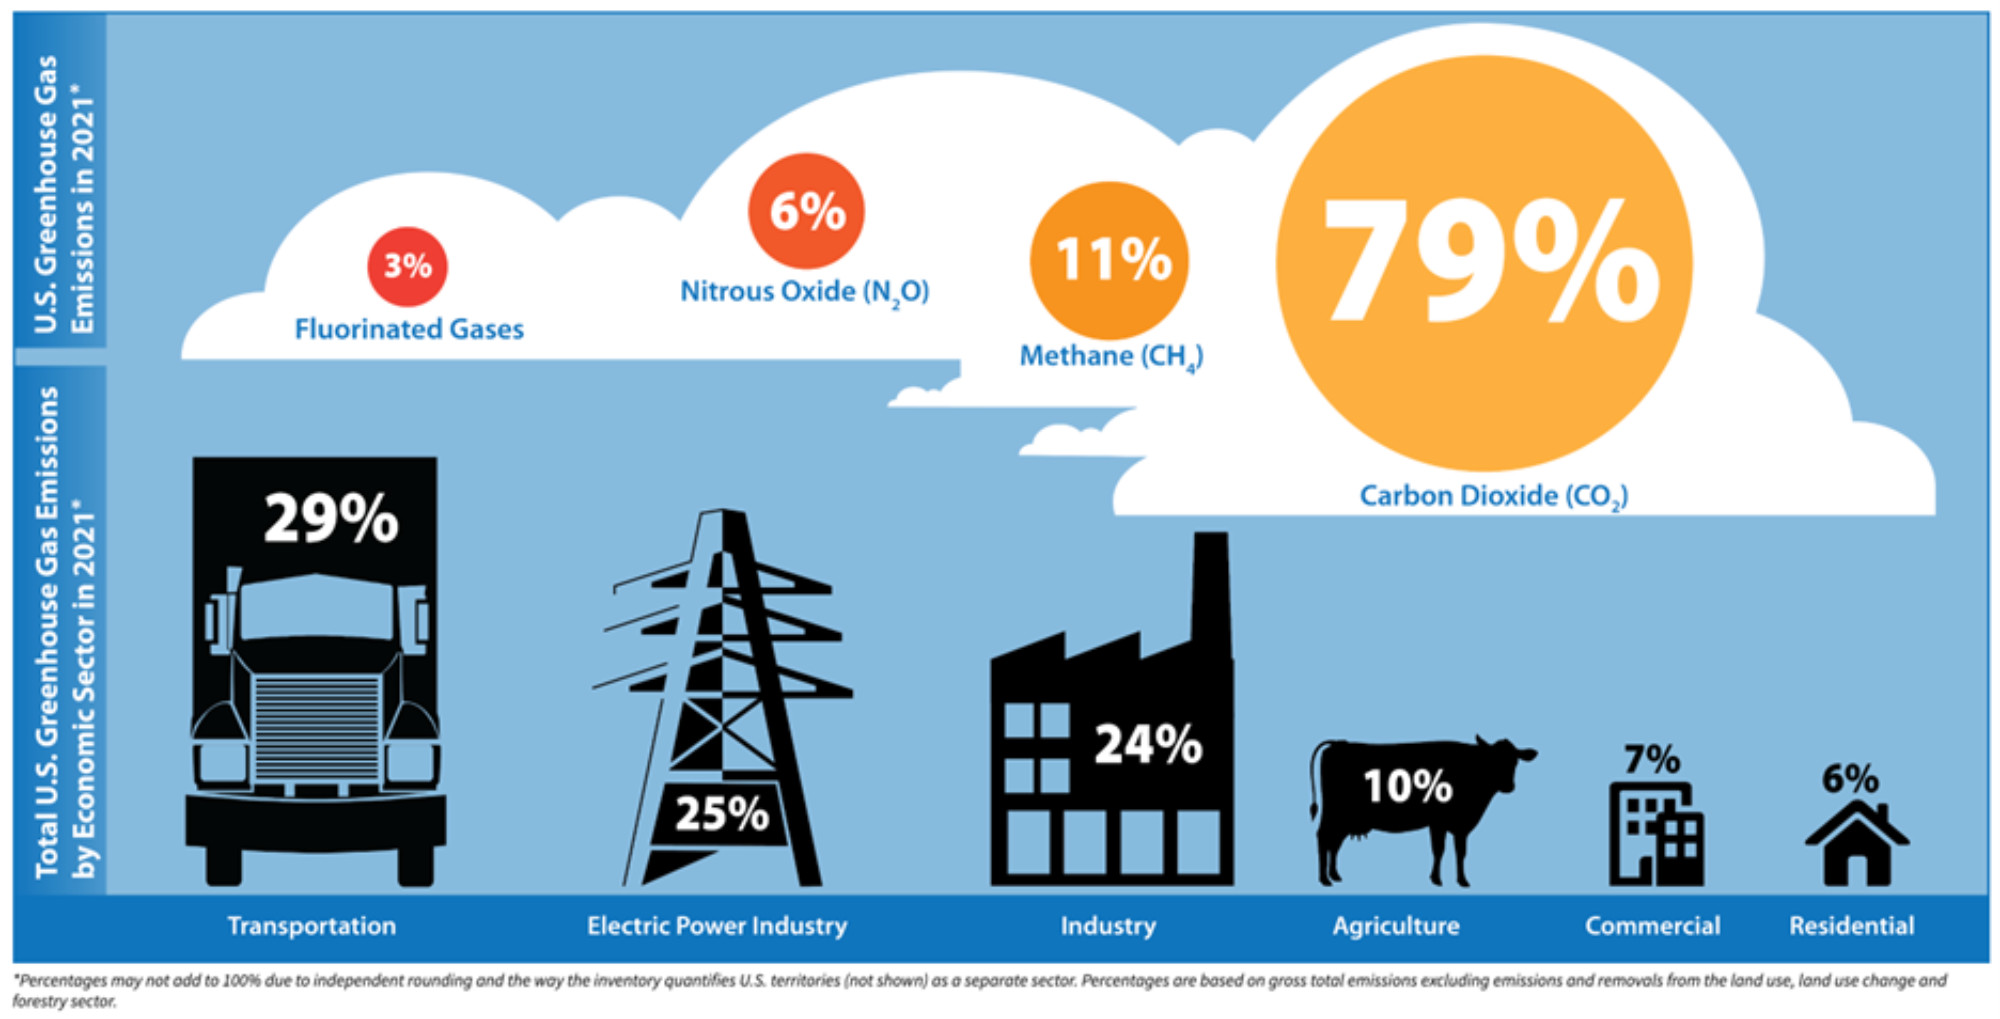
Fundamentally, the emission scenarios are input files (“Data In”) that we create and feed into models for them to make predictions of future climate. These scenarios consist of our best-guess of what is emitted from Earth and human sources that can impact the climate. Emissions are gases and particles released from human activities such as producing and combusting fossil fuels, burning forests to create farmland, and producing cement. There are also natural emissions such as dust blown from deserts and sea salt particles that enters the atmosphere from ocean waves. For climate modeling, scientists are concerned with emissions of greenhouse gases: gases such as carbon dioxide, methane, nitrous oxide, and chlorofluorocarbons that trap heat in the atmosphere. Figure 1 shows the major greenhouse gases and the economic sectors that emit them.
Emission scenarios represent the effects of choices that humans might make in the future, such as the ways we produce energy and food. These emission scenarios contain flows of gases, such as carbon dioxide, methane, and others, at surface grid cells in the simulated world, and include estimates of how much mass of different gases is emitted over every grid cell over every timestep. These could also include estimates of non-surface emissions such as emissions from airplanes, volcanic eruptions, and even emissions from space shuttle launches.
Different emission scenarios are based on different imagined or best-guess potential worlds, and each scenario could have higher or lower greenhouse gas emissions. These scenarios can be simple, such as a standard climate model intercomparison scenario in which we specify that carbon dioxide concentrations (one of the primary greenhouse gases that control our climate) instantly double. This simple scenario is unrealistic, and no one expects or anticipates that this will happen in the real world, but it’s easy to create and it allows for a straightforward way for different modeling groups to compare their models and understand their differences.
Other emissions scenarios can be fiendishly complex. The emissions scenarios used in the 2021-2022 Intergovernmental Panel on Climate Change (IPCC) intercomparisons are called “Shared Socioeconomic Pathways” or “SSPs” and they include daily/yearly emission estimates for many different greenhouse and other gases for every point on Earth. For more information on the IPCC see https://earthathome.org/quick-faqs/what-is-the-ipcc/. These SSPs are attempts to envision specific possible futures and need to consider many processes and systems all at once. For instance, one researcher may want to use the SSPs to understand how much methane might be emitted by New York City over the next 100 years, and so the SSPs must include realistic and reasonable assumptions about urban emissions. Another researcher may only care about the impact of climate change on Antarctic ice sheets in the year 2100. In this case, the SSPs must include realistic and reasonable estimates of all greenhouse gases and all other emissions that might impact greenhouse gases in the atmosphere for every place on Earth every day between now and 2100. That’s a tall order and is one reason why SSPs and other emissions scenarios are so complicated.
Figure 2 summarizes some of the major greenhouse gas and aerosol emissions, as well as the resulting change in radiative forcing, included in some of these SSPs. The individual SSPs are described in more detail below, but this figure gives an example of what is included in each of the SSPs themselves.
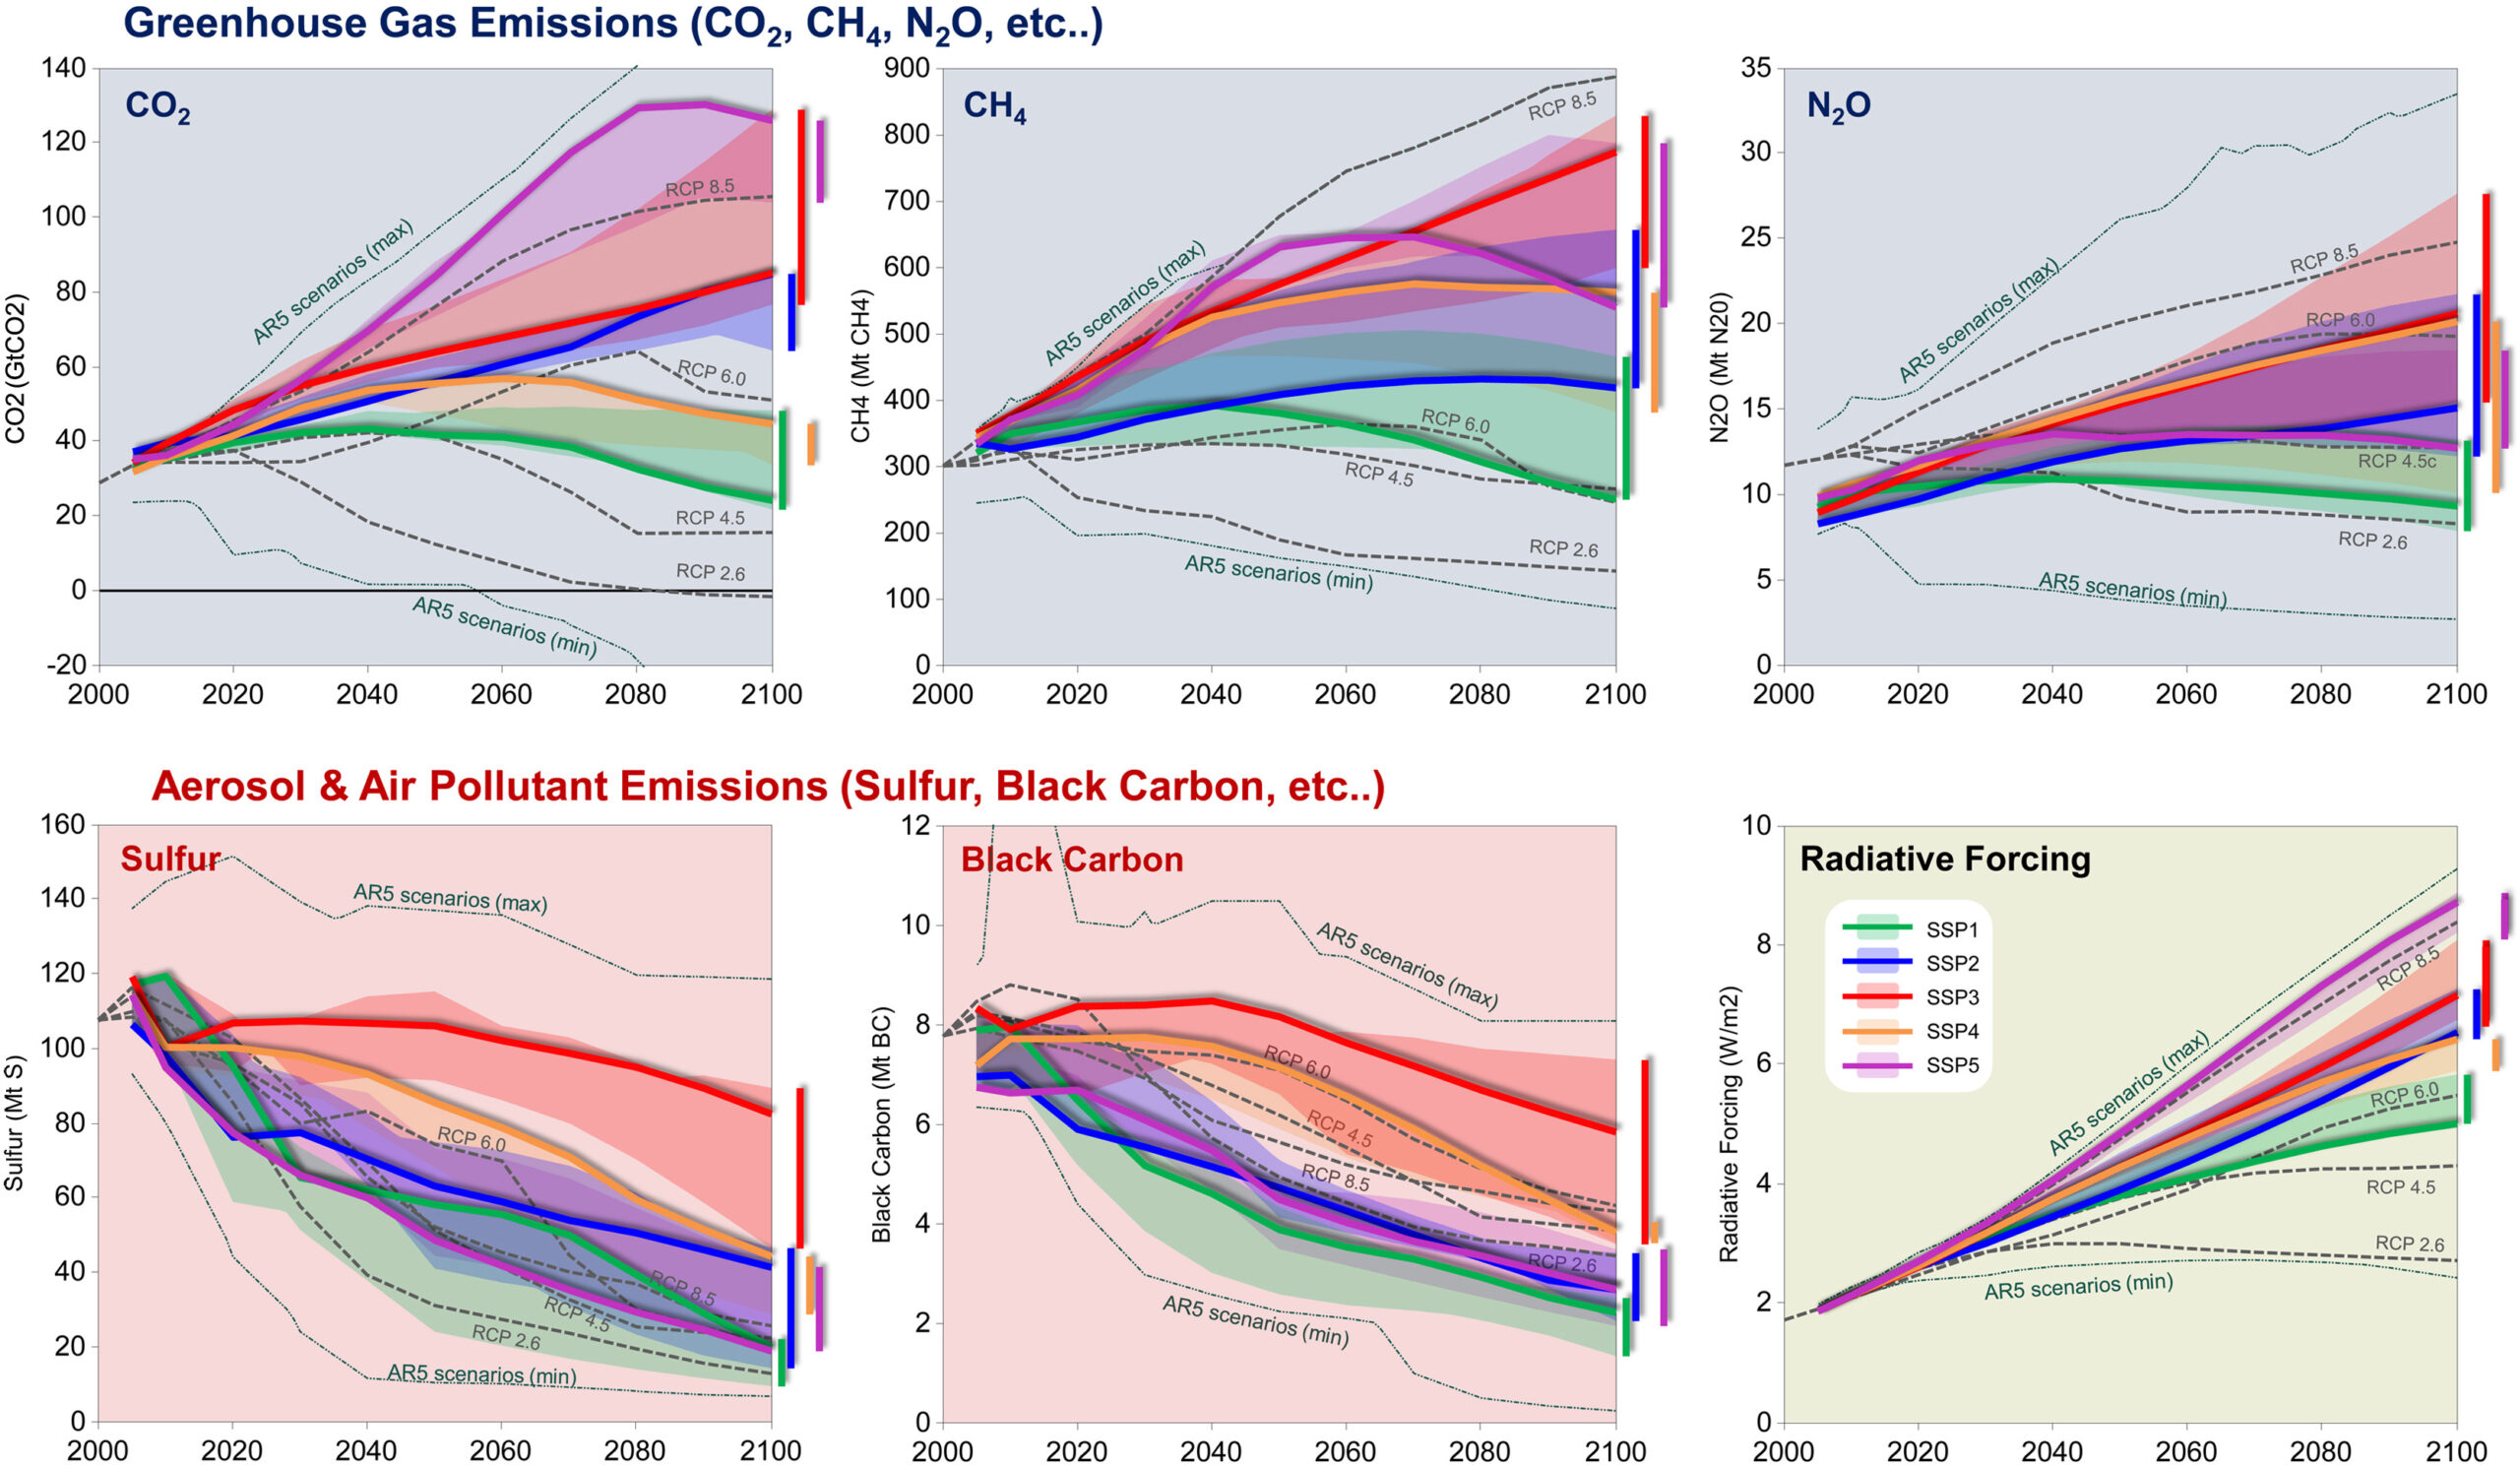
Figure 2: Scenarios of future emissions for various greenhouse gases and other pollutants. Image from Riahi, K. et al. The Shared Socioeconomic Pathways and their energy, land use, and greenhouse gas emissions implications: An overview. Global Environmental Change 42, 153–168 (2017).
Furthermore, for us to understand what our future might look like and how our decisions and actions might affect the future climate, we want to have multiple emissions scenarios that cover a wide range of possible behaviors. Do we immediately reduce carbon dioxide emissions, or do we wait for 50 years? Does the U.S. decrease greenhouse gas emissions while India increases their greenhouse gas emissions? Do we…? Do we…? Do we…? These can get very complicated very quickly.
This is also where the SSPs can feel a little like science fiction. Not only do we want to realistically and reasonably represent our future emissions, but we want to be able to specifically understand what decisions lead to what emissions and ultimately what climate. To address such a wide range of possible pathways, the SSPs are divided into five primary “narratives” that can sound like plotlines for a science fiction show. A brief summary of each of the five narratives is summarized in Figure 3 and a complete summary can be found at the end of this section.
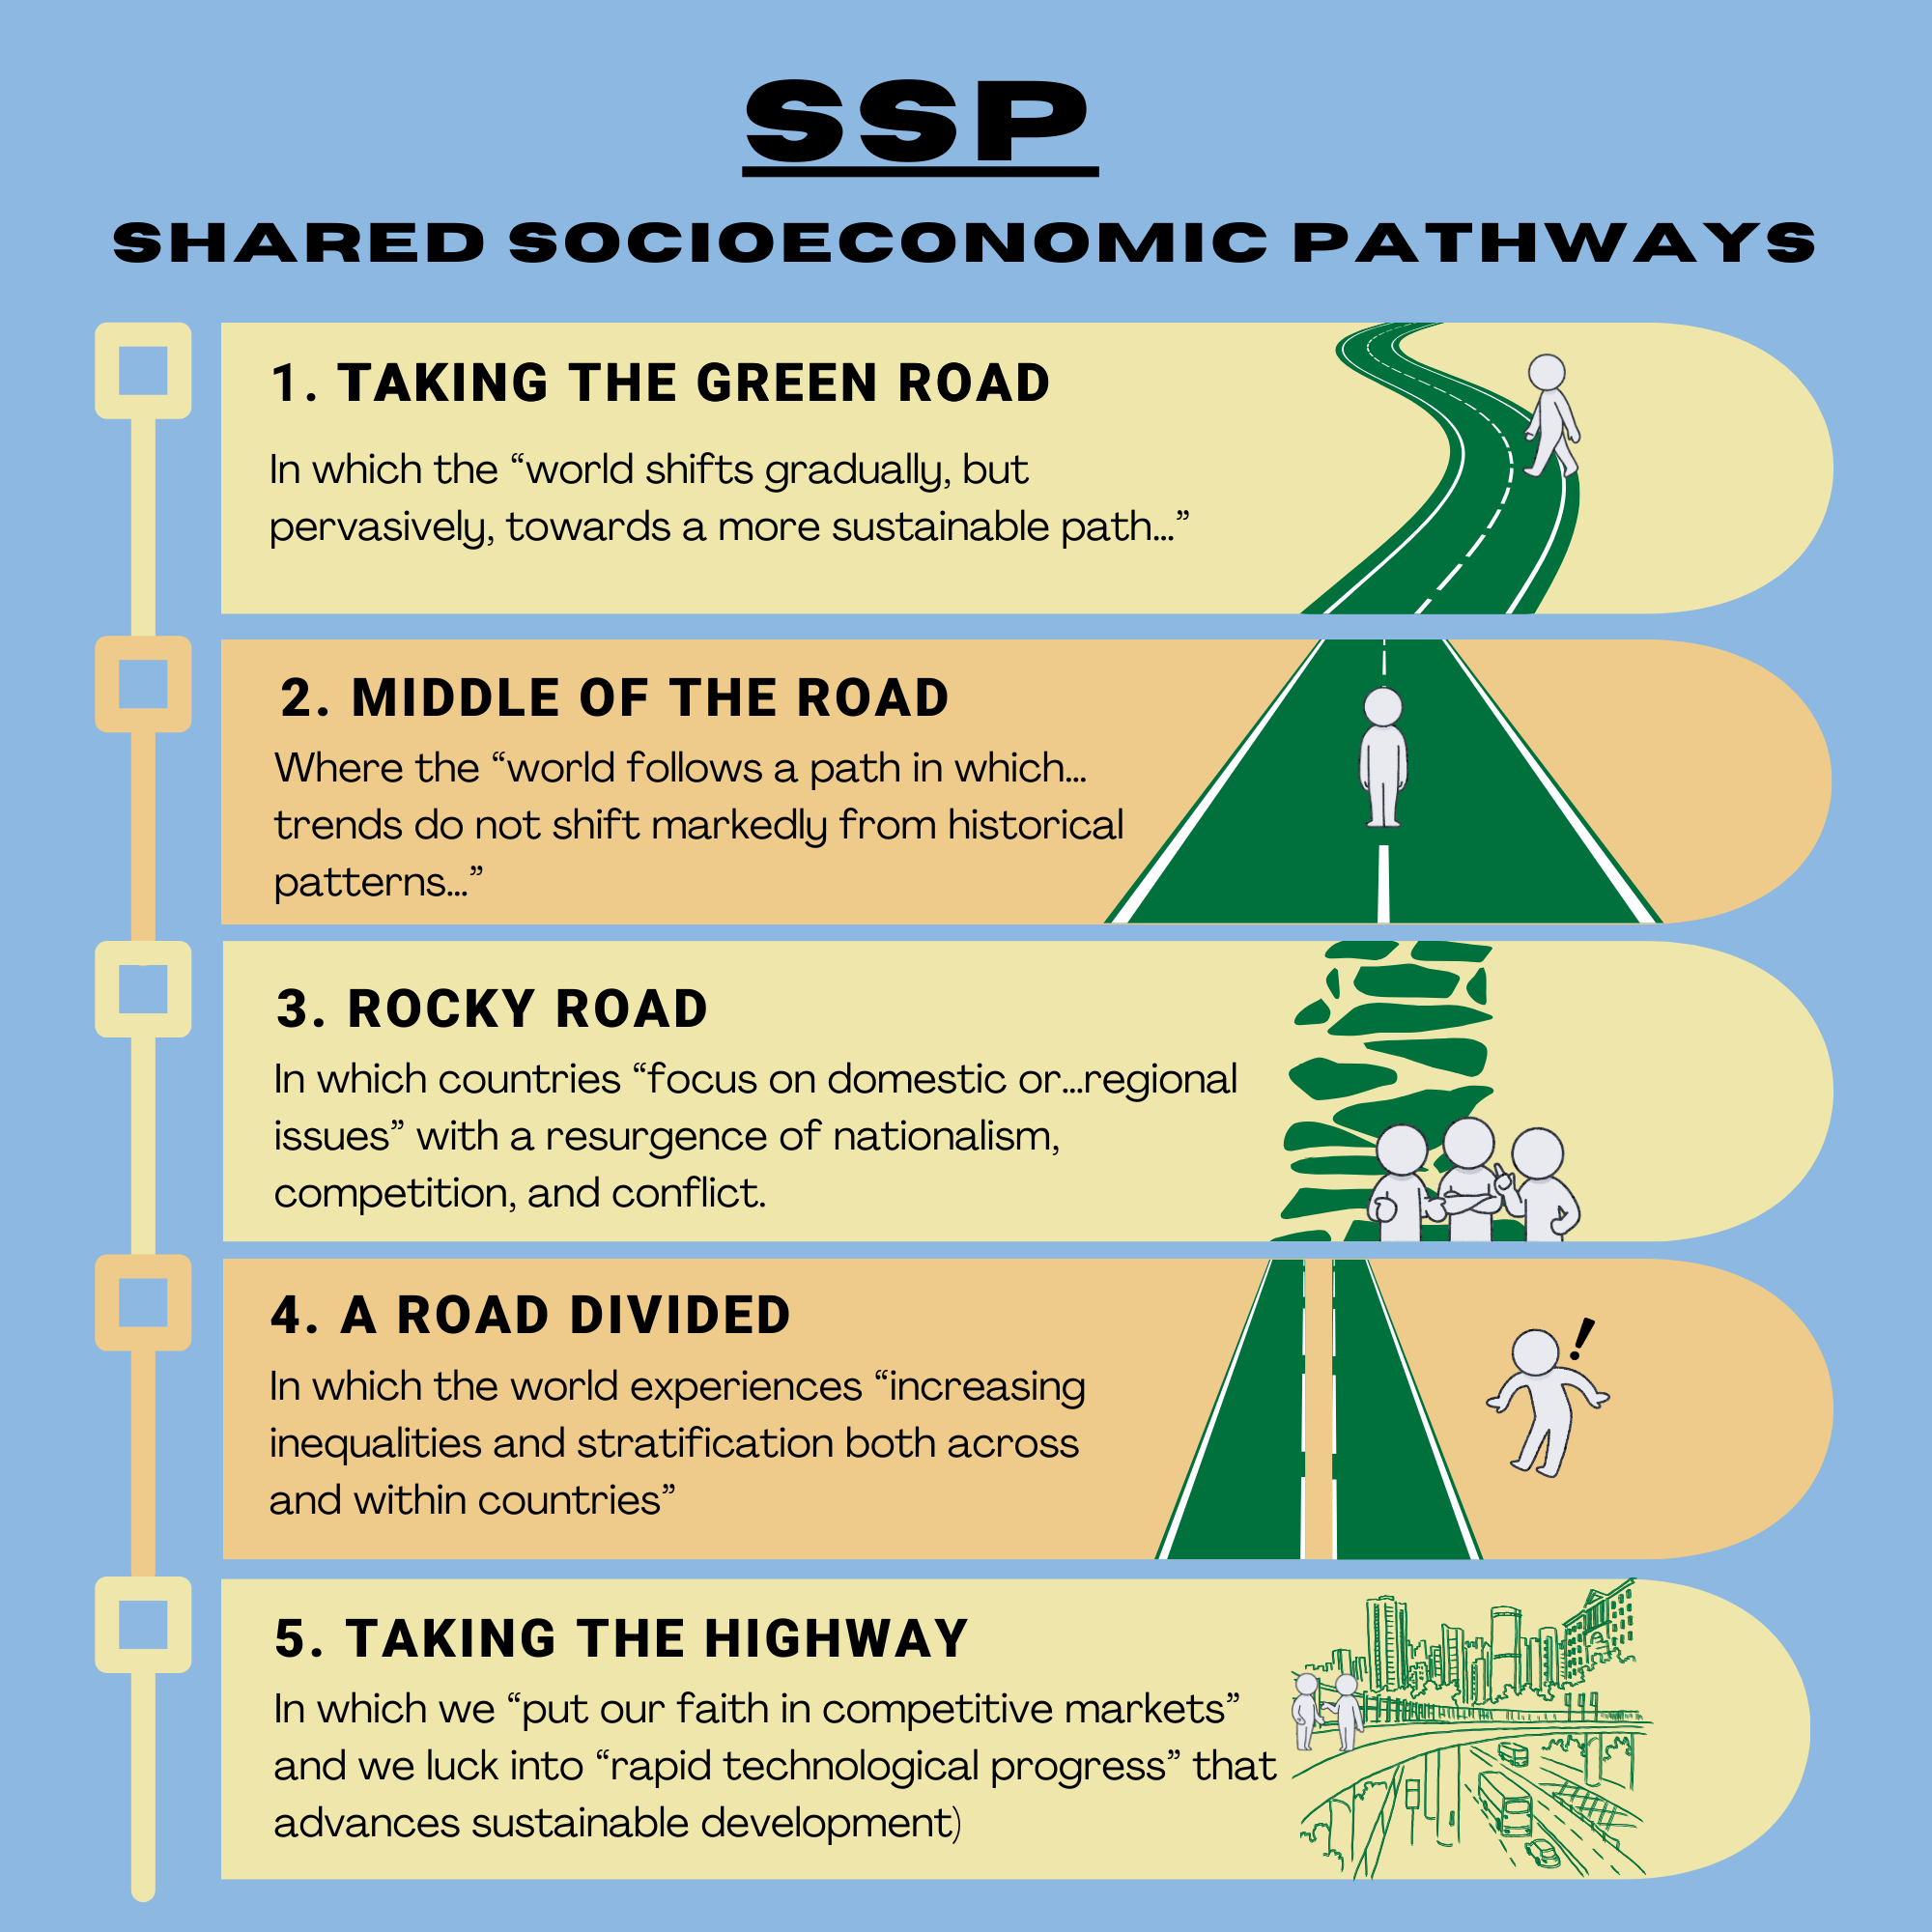
Figure 3. Brief summaries of the SSP narratives. Figure by Nico Tutoni for PRI's Earth@Home project (CC BY-NC-SA 4.0 license).
“Over time, a gap widens between an internationally-connected society that contributes to knowledge- and capital-intensive sectors of the global economy, and a fragmented collection of lower-income, poorly educated societies that work in a labor intensive, low-tech economy.” (Riahi et al. 2017)
This very much feels like a portion of a plot summary for the science fiction vision for our planet! But this level of detail is critical for researchers and decision makers to understand what assumptions underlie the scenarios and how to use the output from the climate model simulations to make good decisions.
A few final points
Naturally, these scenarios, which try to summarize all potential possible future paths for all of humanity, are contentious and heavily debated. For those that worked on developing these scenarios, this debate and criticism can be intense and, at times, personal. As such, these developers were clear that these scenarios come without any estimate of how likely one is over the other, or how possible certain assumptions within these scenarios might be. For instance, in the “Taking the Highway” scenario, a fundamental assumption is that investment in markets to successfully achieve new technologies that address all climate and sustainability concerns is a huge assumption. However, this scenario includes heavy expansion of fossil fuel use:
How likely is this scenario? Will we accept a rapidly growing economy that continues to expand fossil fuel extraction? Who knows? But maybe we will, and maybe it should be something for us to consider as we make decisions. A more complete description of each of the SSPs taken from Riahi et al. 2017 can be found at the end of this article.
Additionally, as these scenarios and the results of climate model simulations invariably have profound implications regarding human behavior, planetary health, politics, economics, ethics, and pretty much everything else, they can be used by politicians or advocates to press their particular position.
For instance, one of the pre-SSP scenarios that leads to the highest and most catastrophic climate impacts, called “RCP8.5” (Representative Concentration Pathway with 8.5 W/m2 of radiative forcing by 2100) is commonly used to represent the “business as usual” scenario. For some time after this scenario was originally developed, it was a good assumption that this was a true “business as usual” scenario, but for various (and mostly “good news”) reasons, the global greenhouse emissions have already diverged from this scenario. It is no longer obviously reasonable to call this scenario “business as usual.” But, for those that believe that urgent climate action is critical and necessary and immediately needed, the use of this scenario as a “business as usual” or default position best makes their point. On the other hand, climate change skeptics or deniers have consistently decried this scenario as unrealistic and alarmist. Currently, it looks like we are not on a RCP8.5 pathway, but this scenario is still frequently used as a default emissions pathway in climate model studies. Whether this is a good or a bad thing, at this point, is no longer a scientific question. This is a political, ethical, and fundamentally human question.
Appendix: Summary of SSP narratives
This table comes from Riahi, K. et al. The Shared Socioeconomic Pathways and their energy, land use, and greenhouse gas emissions implications: An overview. Global Environmental Change 42, 153–168 (2017).
SSP1
Sustainability – Taking the Green Road (Low challenges to mitigation and adaptation)
The world shifts gradually, but pervasively, toward a more sustainable path, emphasizing more inclusive development that respects perceived environmental boundaries. Management of the global commons slowly improves, educational and health investments accelerate the demographic transition, and the emphasis on economic growth shifts toward a broader emphasis on human well-being. Driven by an increasing commitment to achieving development goals, inequality is reduced both across and within countries. Consumption is oriented toward low material growth and lower resource and energy intensity.
SSP2
Middle of the Road (Medium challenges to mitigation and adaptation)
The world follows a path in which social, economic, and technological trends do not shift markedly from historical patterns. Development and income growth proceeds unevenly, with some countries making relatively good progress while others fall short of expectations. Global and national institutions work toward but make slow progress in achieving sustainable development goals. Environmental systems experience degradation, although there are some improvements and overall the intensity of resource and energy use declines. Global population growth is moderate and levels off in the second half of the century. Income inequality persists or improves only slowly and challenges to reducing vulnerability to societal and environmental changes remain.
SSP3
Regional Rivalry – A Rocky Road (High challenges to mitigation and adaptation)
A resurgent nationalism, concerns about competitiveness and security, and regional conflicts push countries to increasingly focus on domestic or, at most, regional issues. Policies shift over time to become increasingly oriented toward national and regional security issues. Countries focus on achieving energy and food security goals within their own regions at the expense of broader-based development. Investments in education and technological development decline. Economic development is slow, consumption is material-intensive, and inequalities persist or worsen over time. Population growth is low in industrialized and high in developing countries. A low international priority for addressing environmental concerns leads to strong environmental degradation in some regions.
SSP4
Inequality – A Road Divided (Low challenges to mitigation, high challenges to adaptation)
Highly unequal investments in human capital, combined with increasing disparities in economic opportunity and political power, lead to increasing inequalities and stratification both across and within countries. Over time, a gap widens between an internationally-connected society that contributes to knowledge- and capital-intensive sectors of the global economy, and a fragmented collection of lower-income, poorly educated societies that work in a labor intensive, low-tech economy. Social cohesion degrades and conflict and unrest become increasingly common. Technology development is high in the high-tech economy and sectors. The globally connected energy sector diversifies, with investments in both carbon-intensive fuels like coal and unconventional oil, but also low-carbon energy sources. Environmental policies focus on local issues around middle and high income areas.
SSP5
Fossil-fueled Development – Taking the Highway (High challenges to mitigation, low challenges to adaptation)
This world places increasing faith in competitive markets, innovation and participatory societies to produce rapid technological progress and development of human capital as the path to sustainable development. Global markets are increasingly integrated. There are also strong investments in health, education, and institutions to enhance human and social capital. At the same time, the push for economic and social development is coupled with the exploitation of abundant fossil fuel resources and the adoption of resource and energy intensive lifestyles around the world. All these factors lead to rapid growth of the global economy, while global population peaks and declines in the 21st century. Local environmental problems like air pollution are successfully managed. There is faith in the ability to effectively manage social and ecological systems, including by geo-engineering if necessary.