

Page snapshot: Introduction to the climate of the midwestern U.S., including present, past, and future climate.
Topics covered on this page: Present climate of the midwestern U.S.; Severe Weather; Thunderstorms and tornadoes; Polar jet stream and winter storms; The polar vortex; Lake effect snow; Past climate of the midwestern U.S.; Paleozoic; Mesozoic; Cenozoic; Future climate of the midwestern U.S.; Resources.
Credits: Most of the text of this page is derived from "Climate of the Midwestern US" by Alex F. Wall and Judith T. Parrish, chapter 9 in The Teacher-Friendly Guide to the Earth Science of the Midwestern US, edited by Mark D. Lucas, Robert M. Ross, and Andrielle N. Swaby (published in 2014 by the Paleontological Research Institution; currently out of print). The book was adapted for the web by Elizabeth J. Hermsen and Jonathan R. Hendricks in 2022. Changes include formatting and revisions to the text and images. Credits for individual images are given in figure captions.
Updates: Page last updated September 28, 2022.
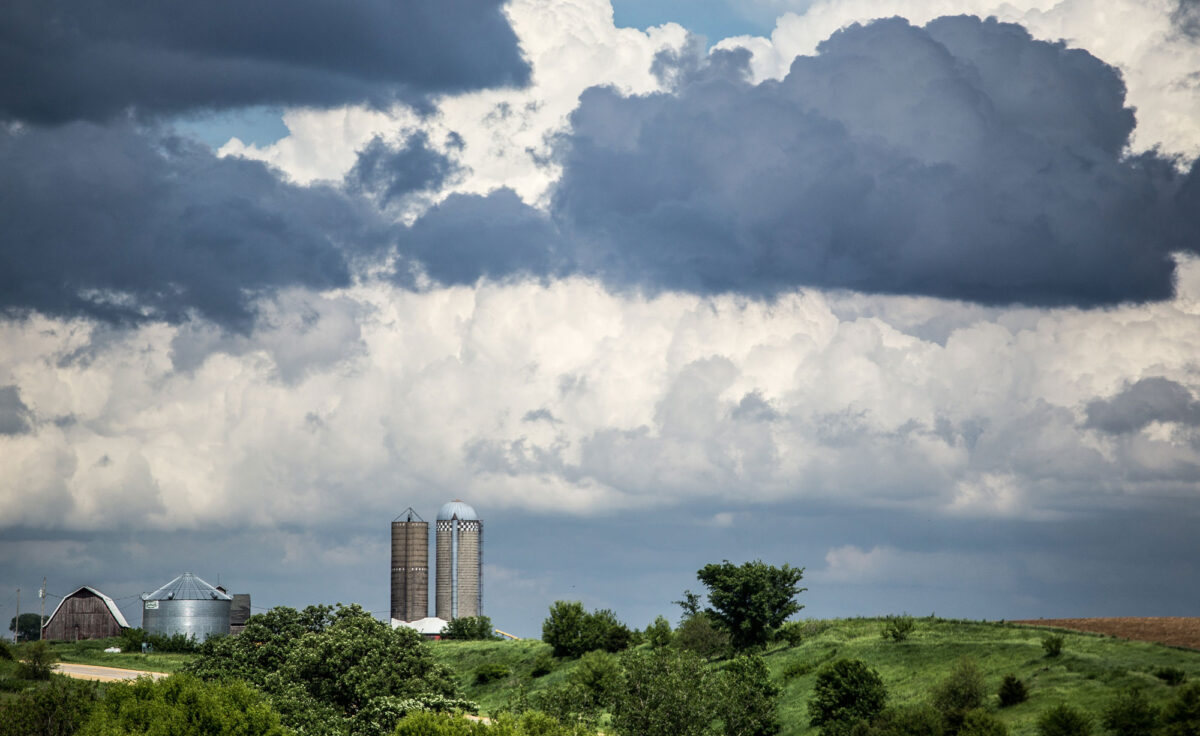
Image above: A farm in Iowa under a cloudy sky, 2016. "Storm Chasin'," photo by Phil Roeder (flickr, Creative Commons Attribution 2.0 Generic license, image cropped and resized).
Present climate of the midwestern U.S.
Nearly all of the Midwest has a humid continental climate, describing temperatures that vary greatly from summer to winter, and appreciable precipitation year-round. Southernmost Illinois and Indiana are closer to a humid subtropical climate.
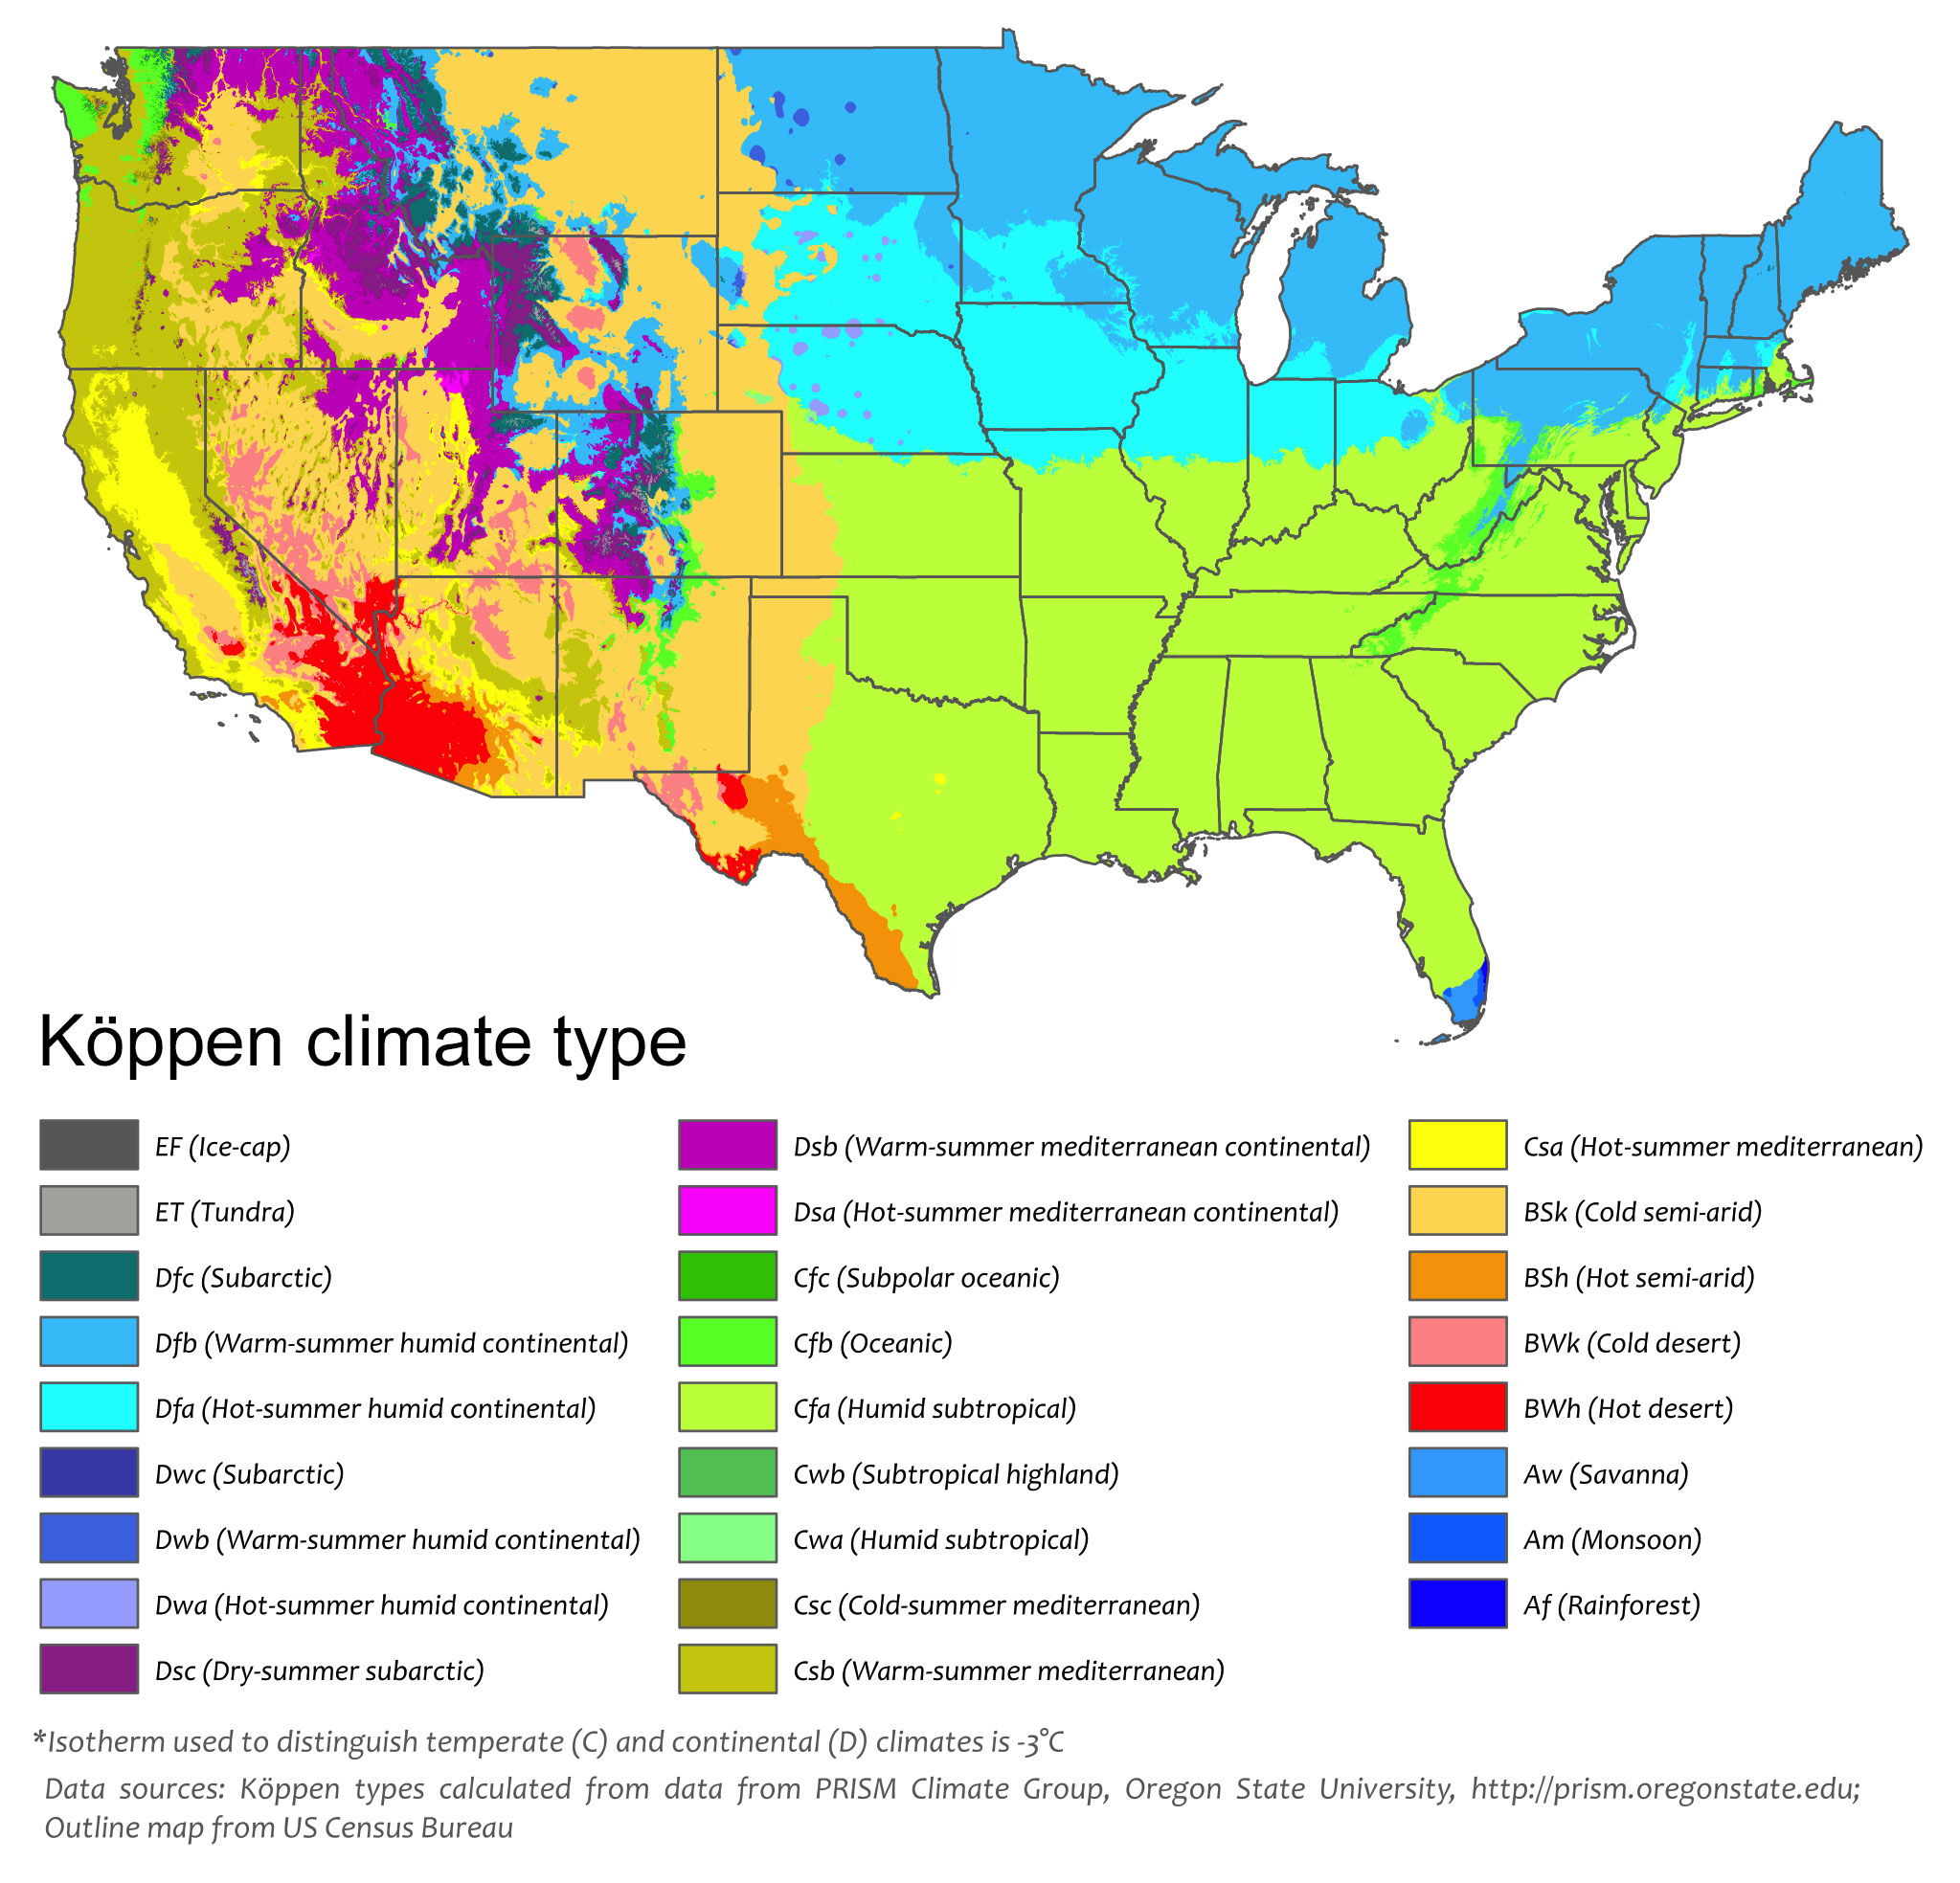
Köppen climate map of the 48 contiguous states of the continental United States. The first letter of each zone in the key indicates its major classification. A = Tropical (equatorial), B = Arid, C = Temperate (warm temperate), D = Continental (cold), E = polar. Modified from a map by Adam Peterson (Wikimedia Commons, Creative Commons Attribution-ShareAlike 4.0 International license).
While averages are important factors in describing climate, the Midwest has unusually extreme annual variation in temperature. At an average temperature of 10°C (50°F), it seems similar to that of England, which has an average of 8°C (47°F). But England’s average high temperature of 21°C (70°F) and low of 2°C (35°F) is more indicative of how different their climate truly is. Average highs in the Midwestern states are around 29°C (85°F), with lows around -9°C (15°F), a variation fully twice as great as England’s. Furthermore, each state has record high temperatures of more than 43°C (110°F) and lows of less than -34°C (-30°F), a variation of a whopping 77°C (140°F)!
The Midwest is one of the most productive agricultural areas in the world, and the economies of its states depend on farmland. Its excellent soil, relatively flat geography, and bodies of water make it uniquely suited to cropland. Yet without a humid climate with warm summers, agriculture here would be completely different. It is one of the few places on Earth where enormous fields of corn and soybeans can be grown with little or no irrigation.
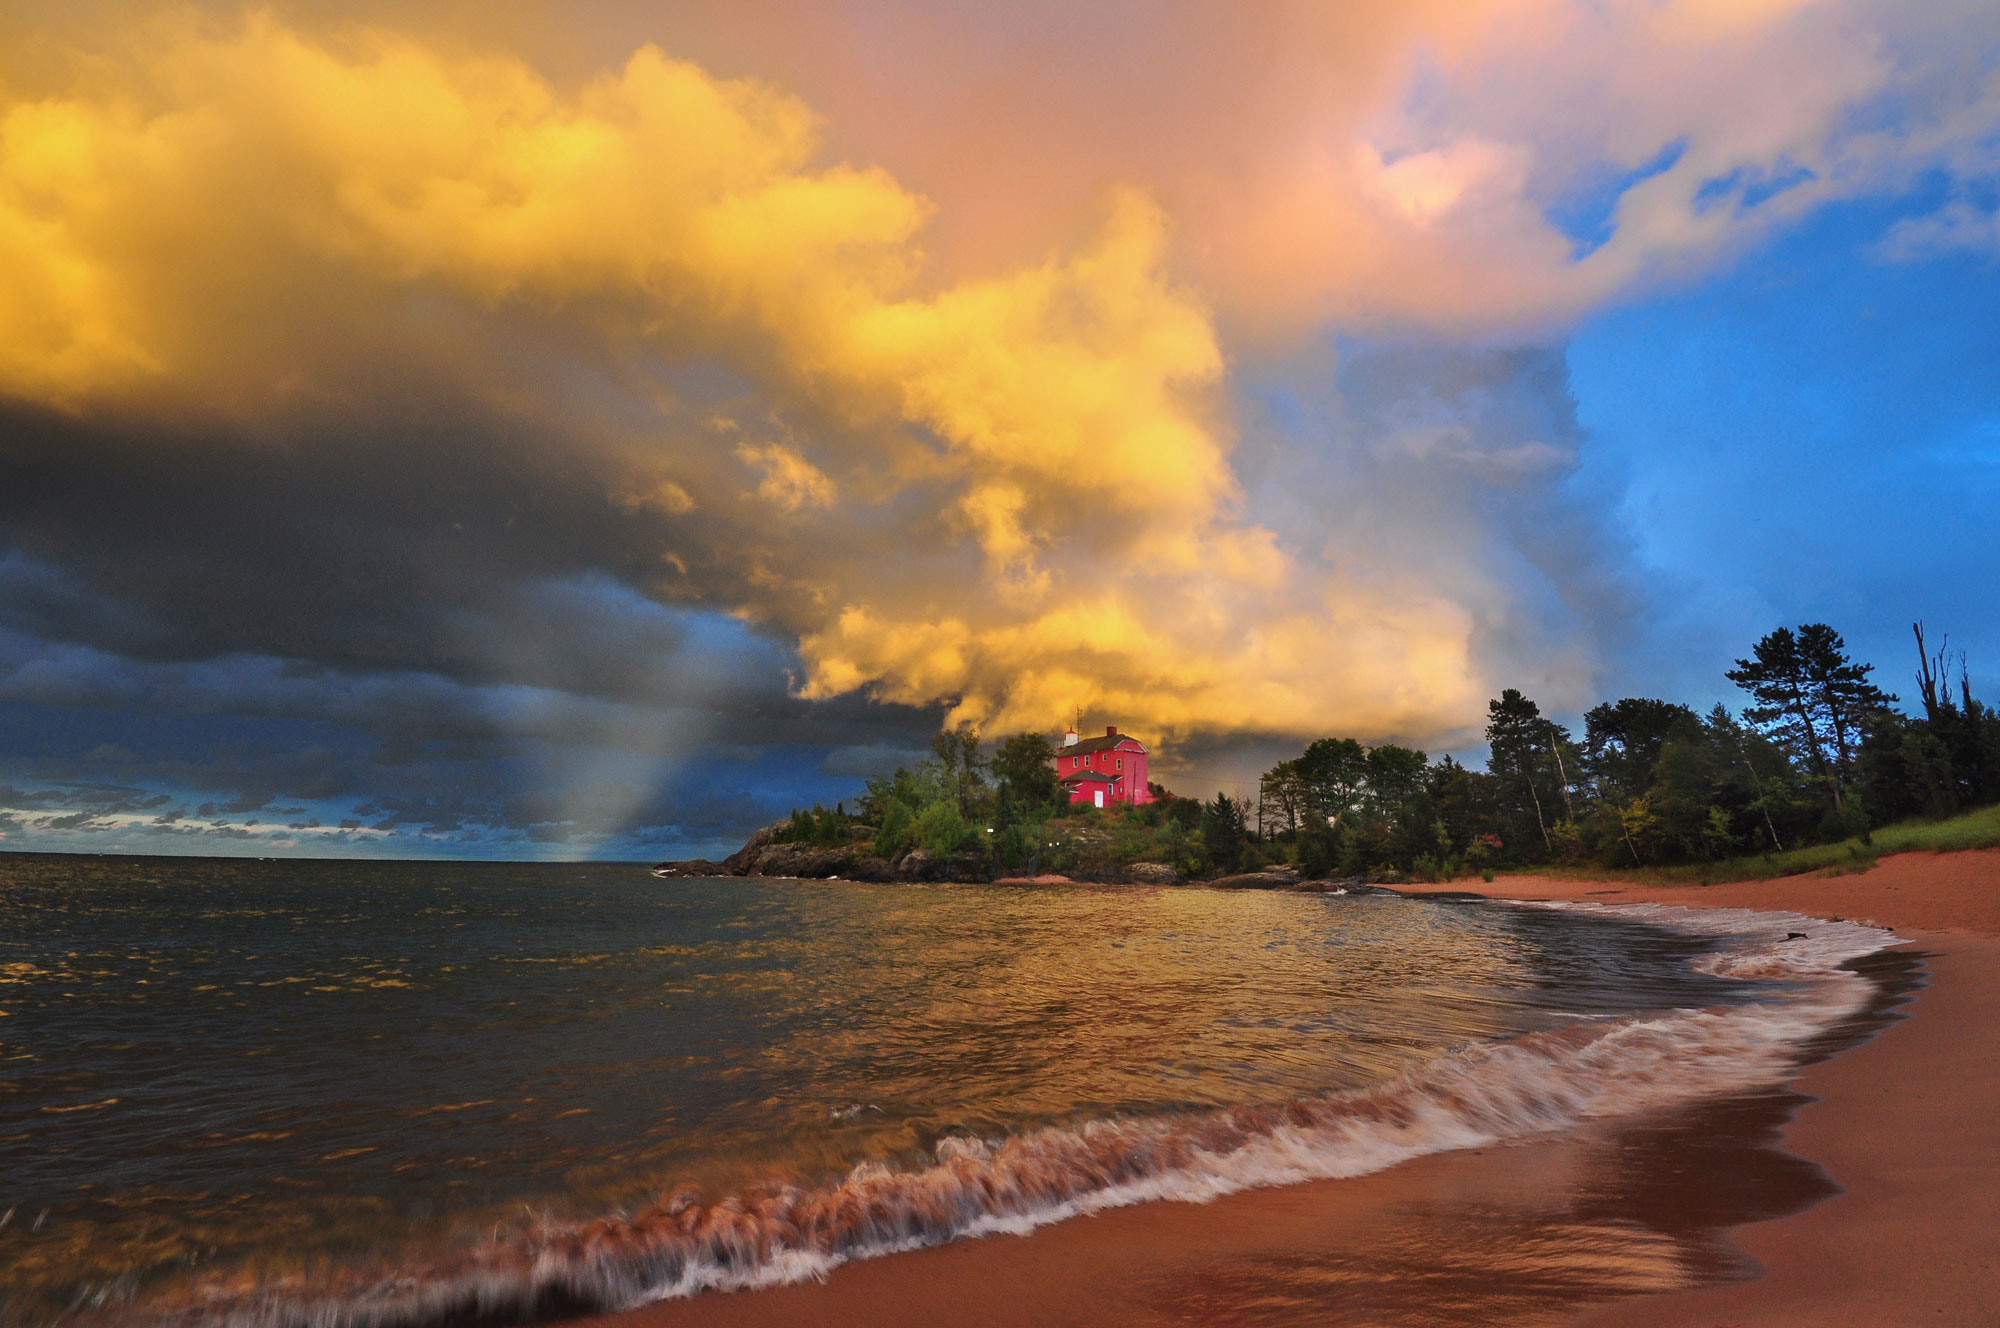
Autumn on Lake Michigan, Marquette, Michigan. Photo by Mark Stacey (NOAA Photo Library on flickr, Creative Commons Attribution-ShareAlike 2.0 Generic license, image resized).
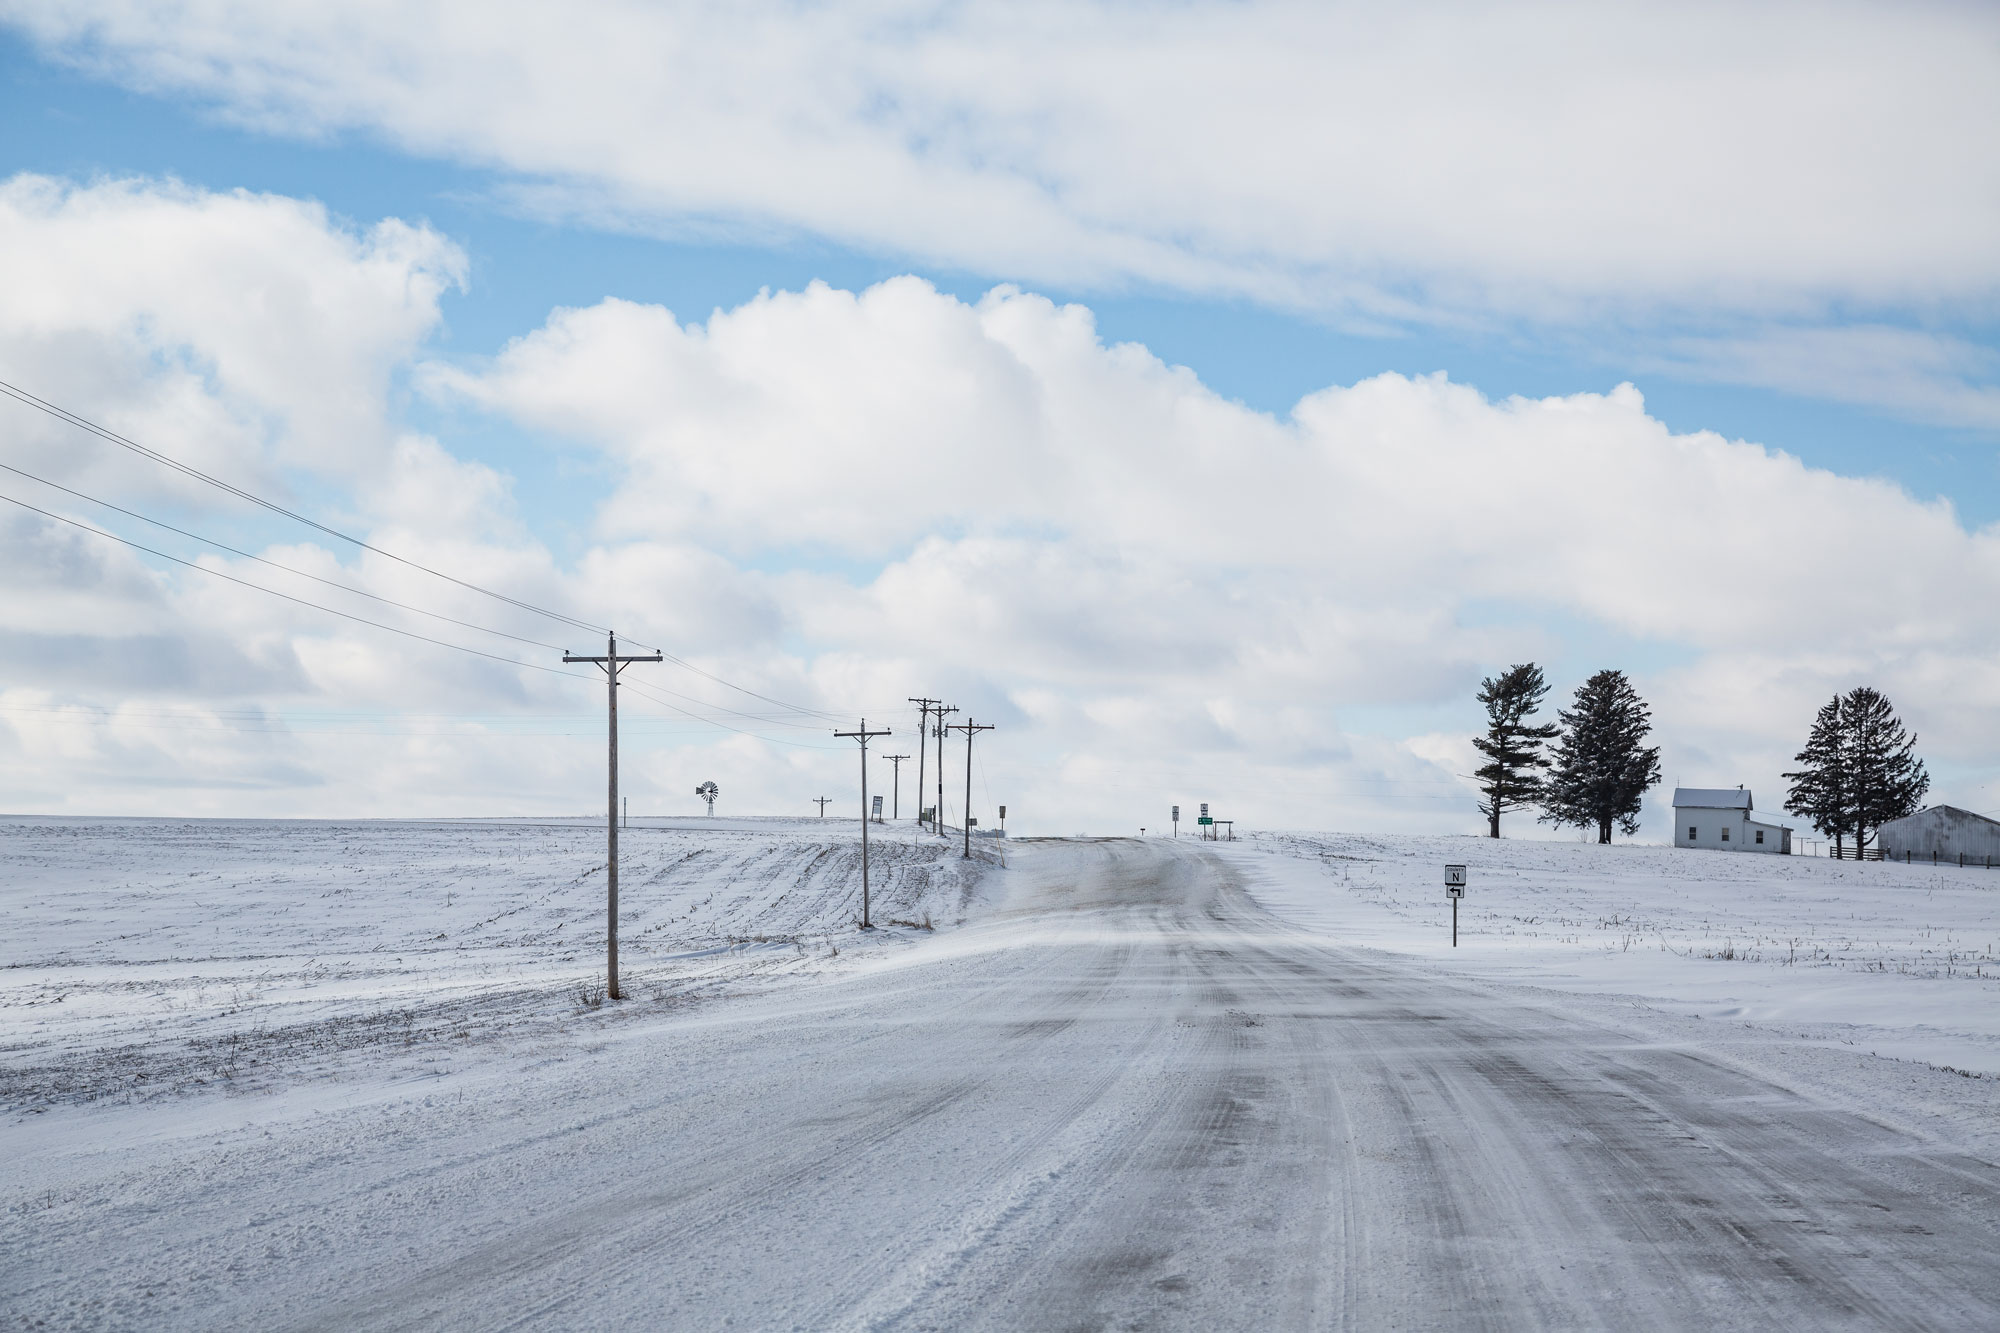
Winter snow in Potosi, Wisconsin. Photo by Tony Webster (flickr, Creative Commons Attribution-ShareAlike 2.0 Generic license, image resized).
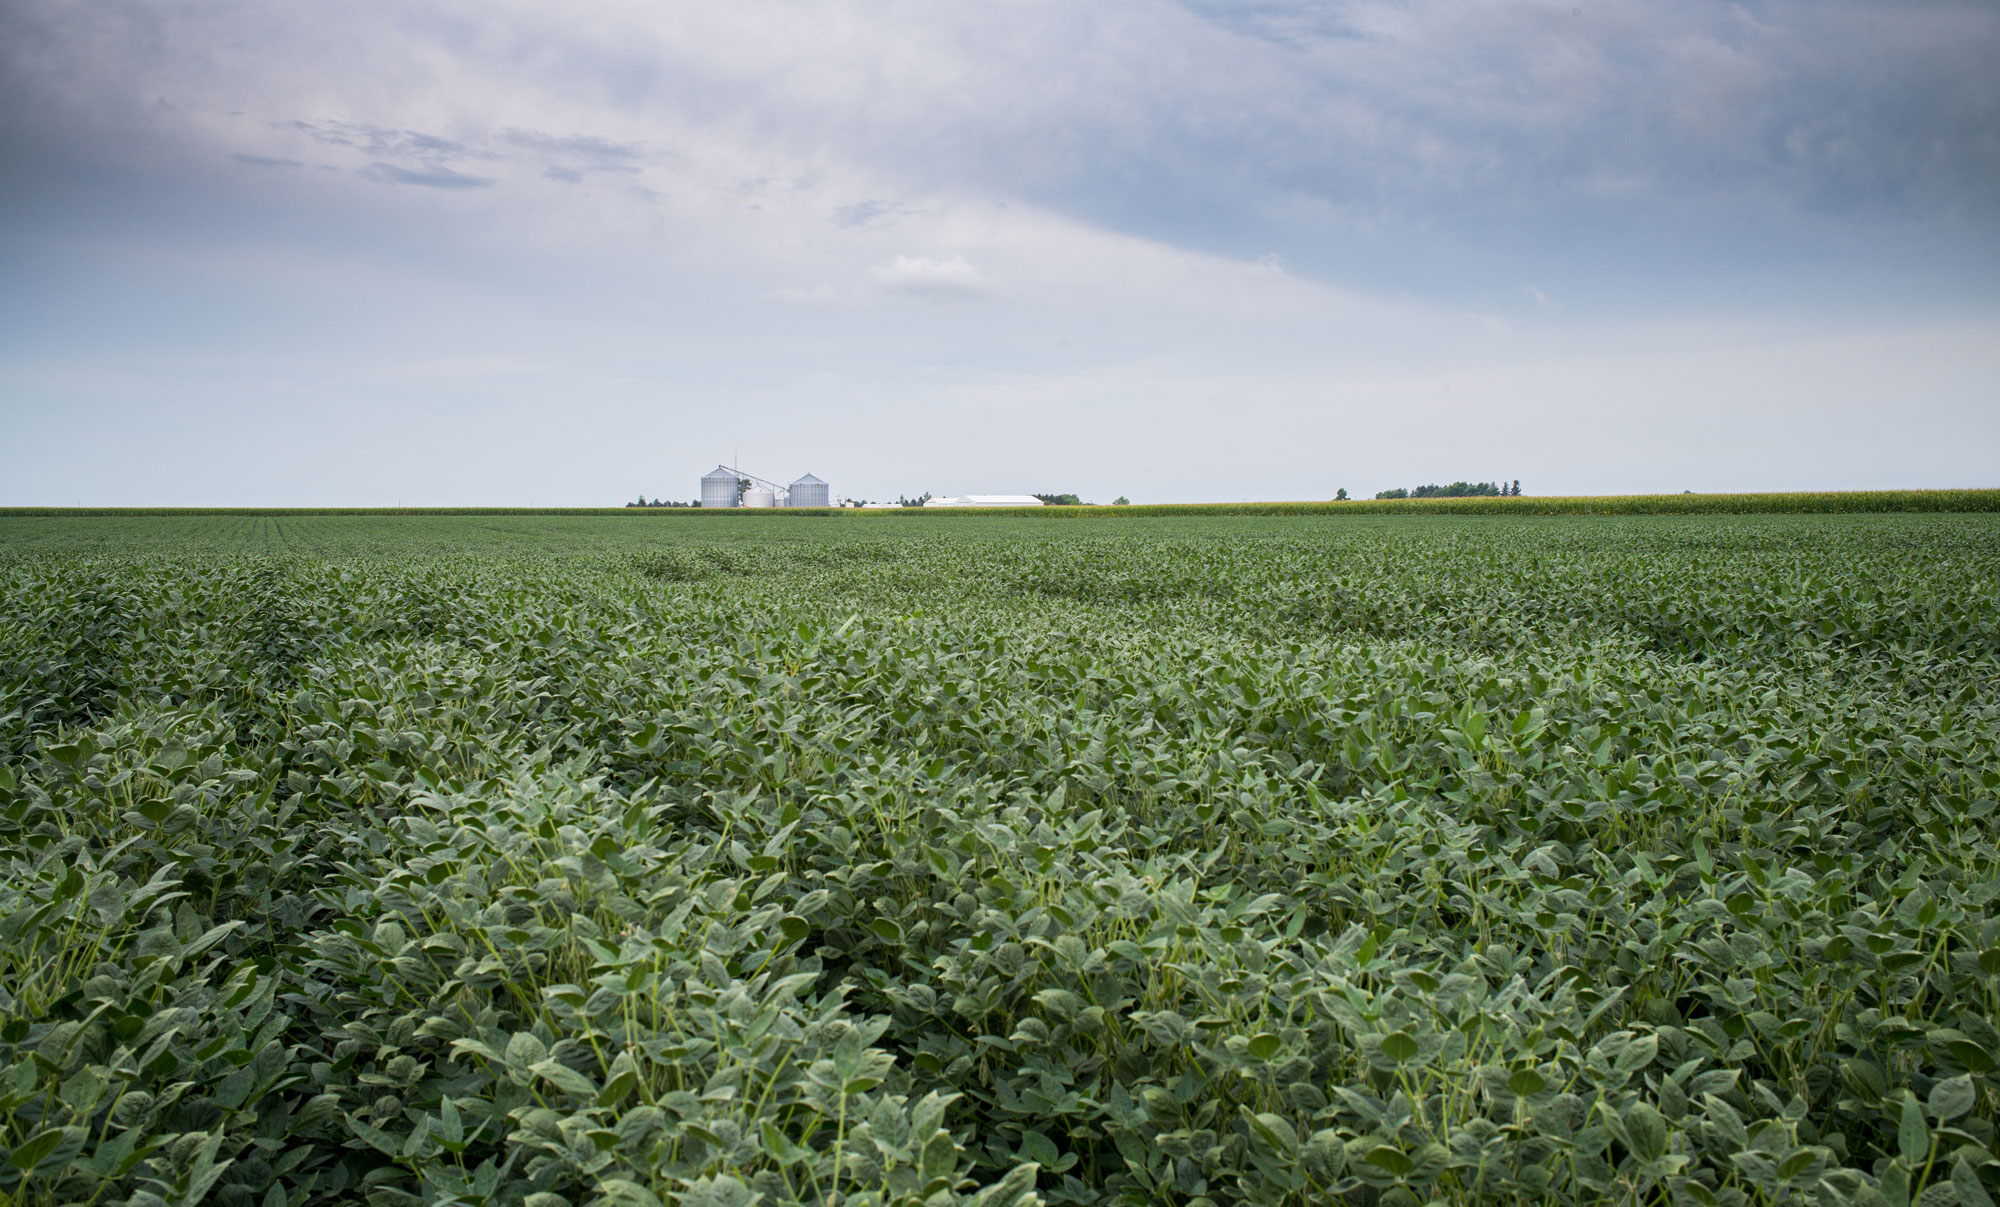
A soybean field in Illinois. Photo by R Boed (flickr, Creative Commons Attribution 2.0 Generic license, image resized).
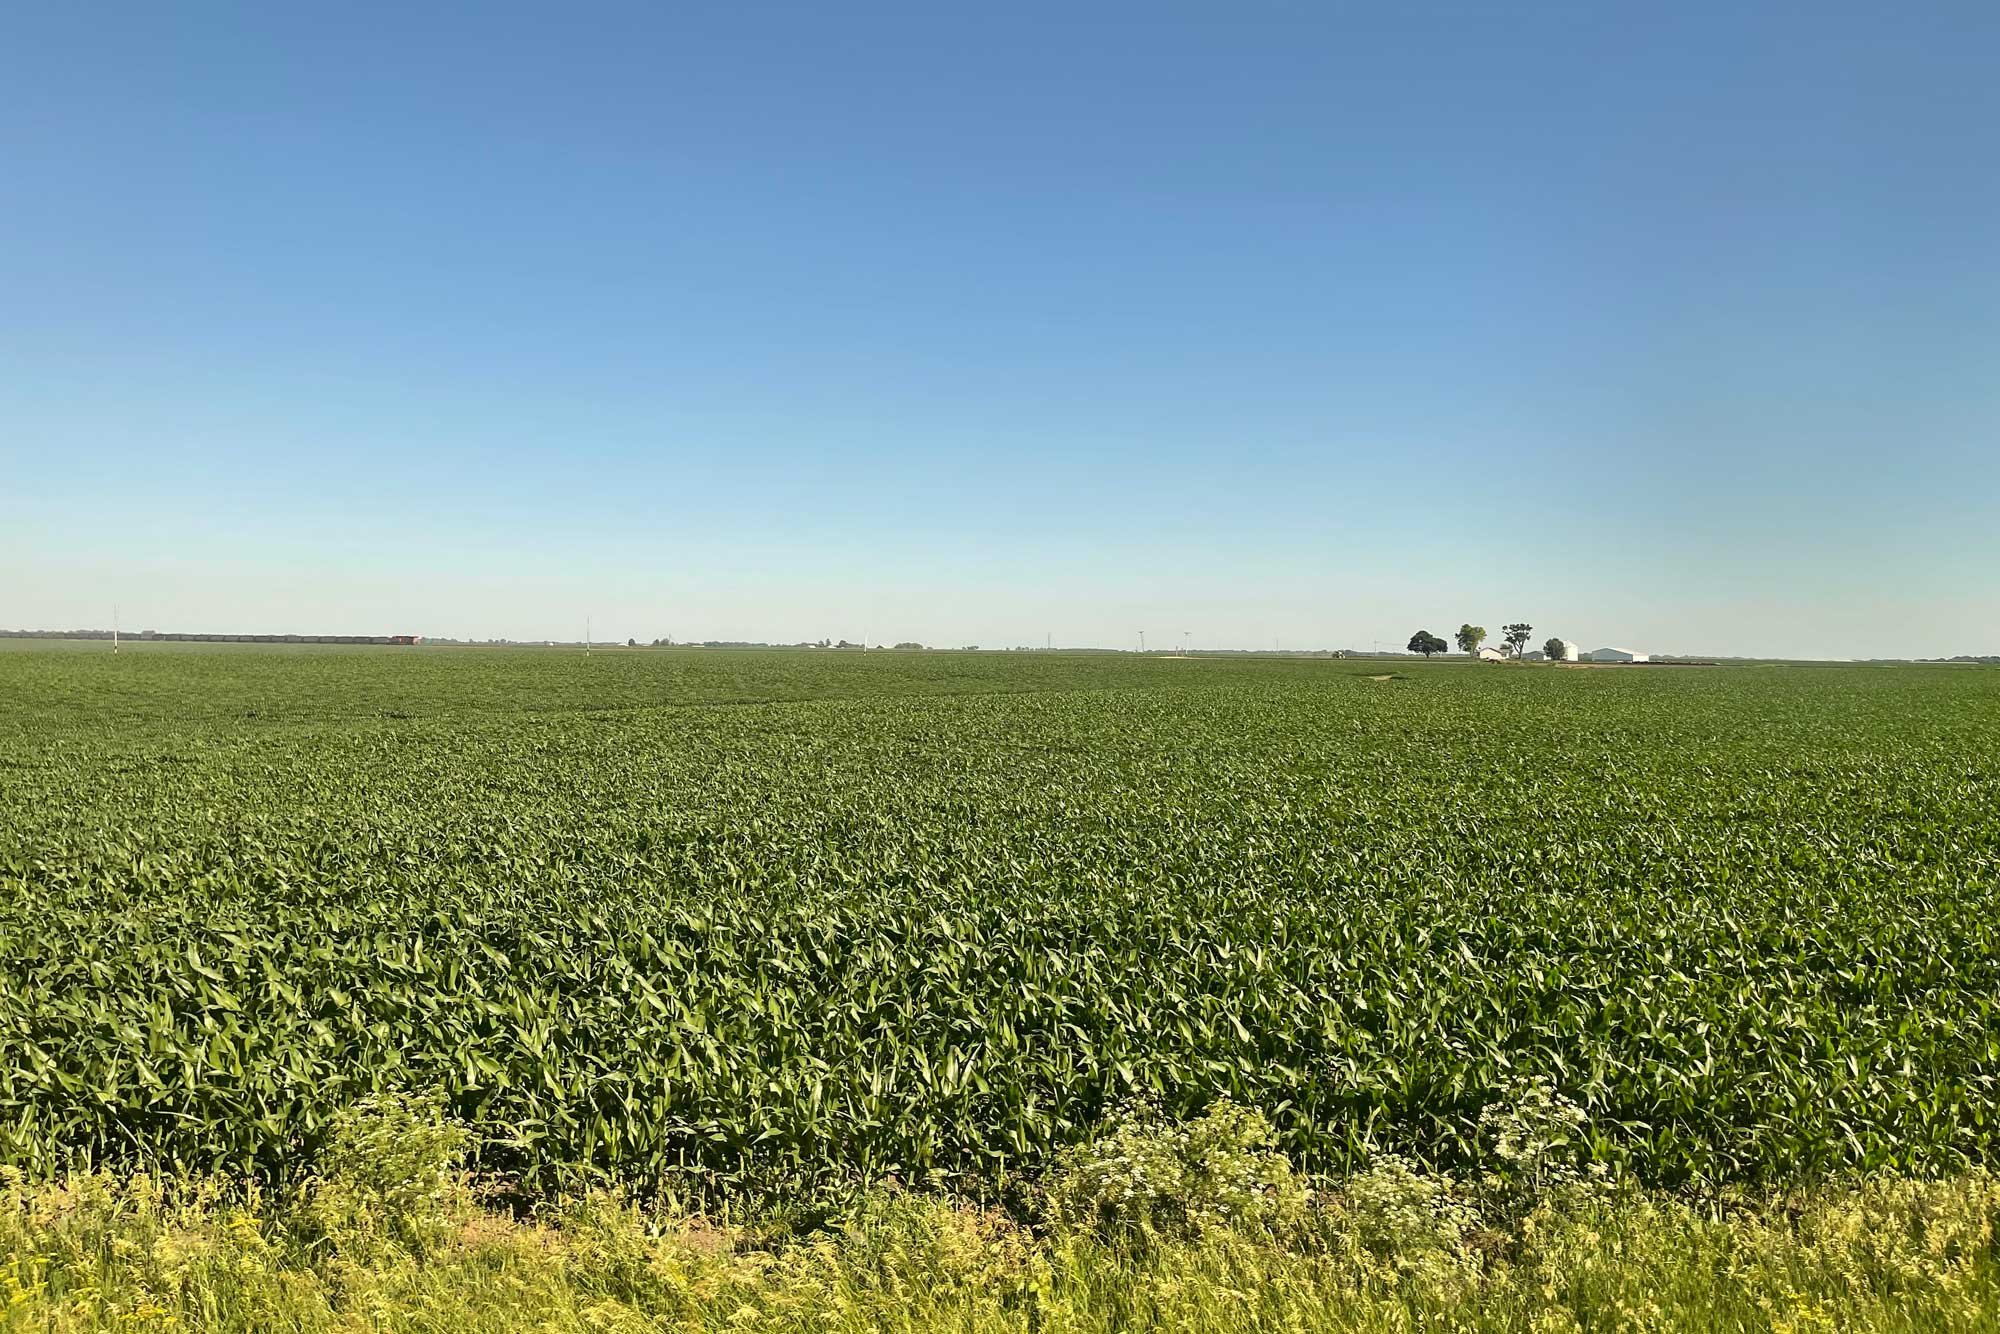
Cornfield, Warren County, Illiniois. Photo by Missvain/Sarah Stierch (Wikimedia Commons, Creative Commons Attribution 4.0 International license, image resized).
Severe weather
In part because of its extreme temperature variation and humidity, the Midwest experiences nearly every variety of severe weather. Because the states are so far from the coasts, they rarely experience hurricanes, but heat waves and cold snaps, droughts, floods, blizzards, and tornados are all fairly regular events.
Thunderstorms and tornados
The geography and climate of the Midwest are nearly ideal for their formation of thunderstorms and tornados, especially in the summer. Storms form when there is strong convection in the atmosphere. Convection occurs when buoyant warm air rises (moves up) while denser cool air sinks (moves down). Convective mixing forces the moisture in warm air to condense as it comes into contact with cool air, forming vapor (clouds) and precipitation (for example, rain or hail). A strong difference in air temperature at different heights creates instability; the warmer the air near the surface is relative to the air above it, the more potential (stored) energy the warm air has to move up, and the more potential for a storm. The final ingredient is wind. Wind moves the air, promoting mixing. The formation of precipitation also causes electrical charging of particles in the atmosphere, which in turn produces lightning.
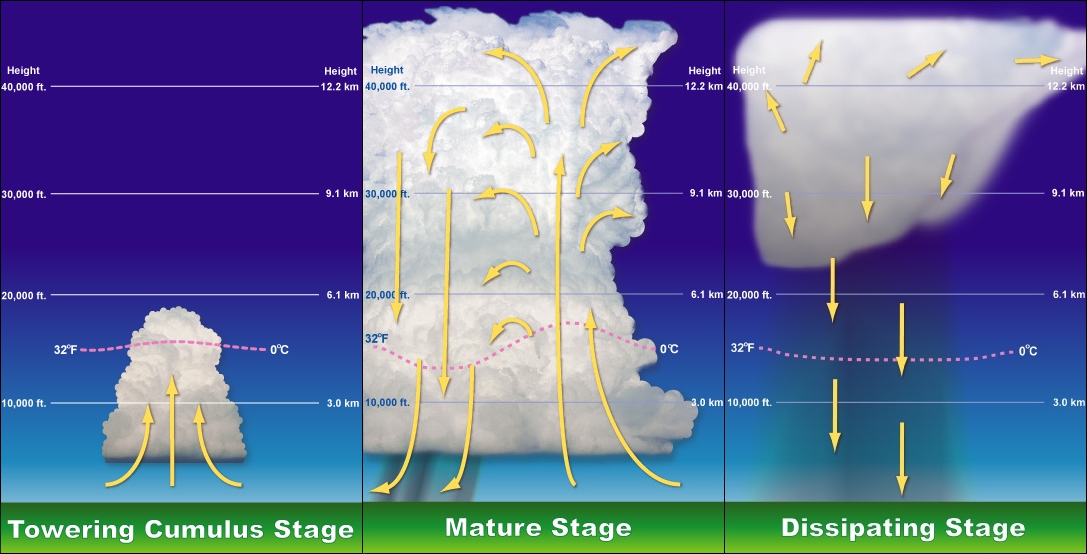
Stages in the formation of a thunderstorm. Left: Warm air rises. Moisture condenses out of the warm air as it comes into contact with cool air, forming clouds. Center: As warm air rises, cool air sinks. Precipitation forms. Right: As the vertical column of air turns over, with warm air at the top and cool air at the bottom, the storm begins to dissipate. Image by The High Fin Sperm Whale, created from images by NOAA National Weather Service training material (Wikimedia Commons, public domain).
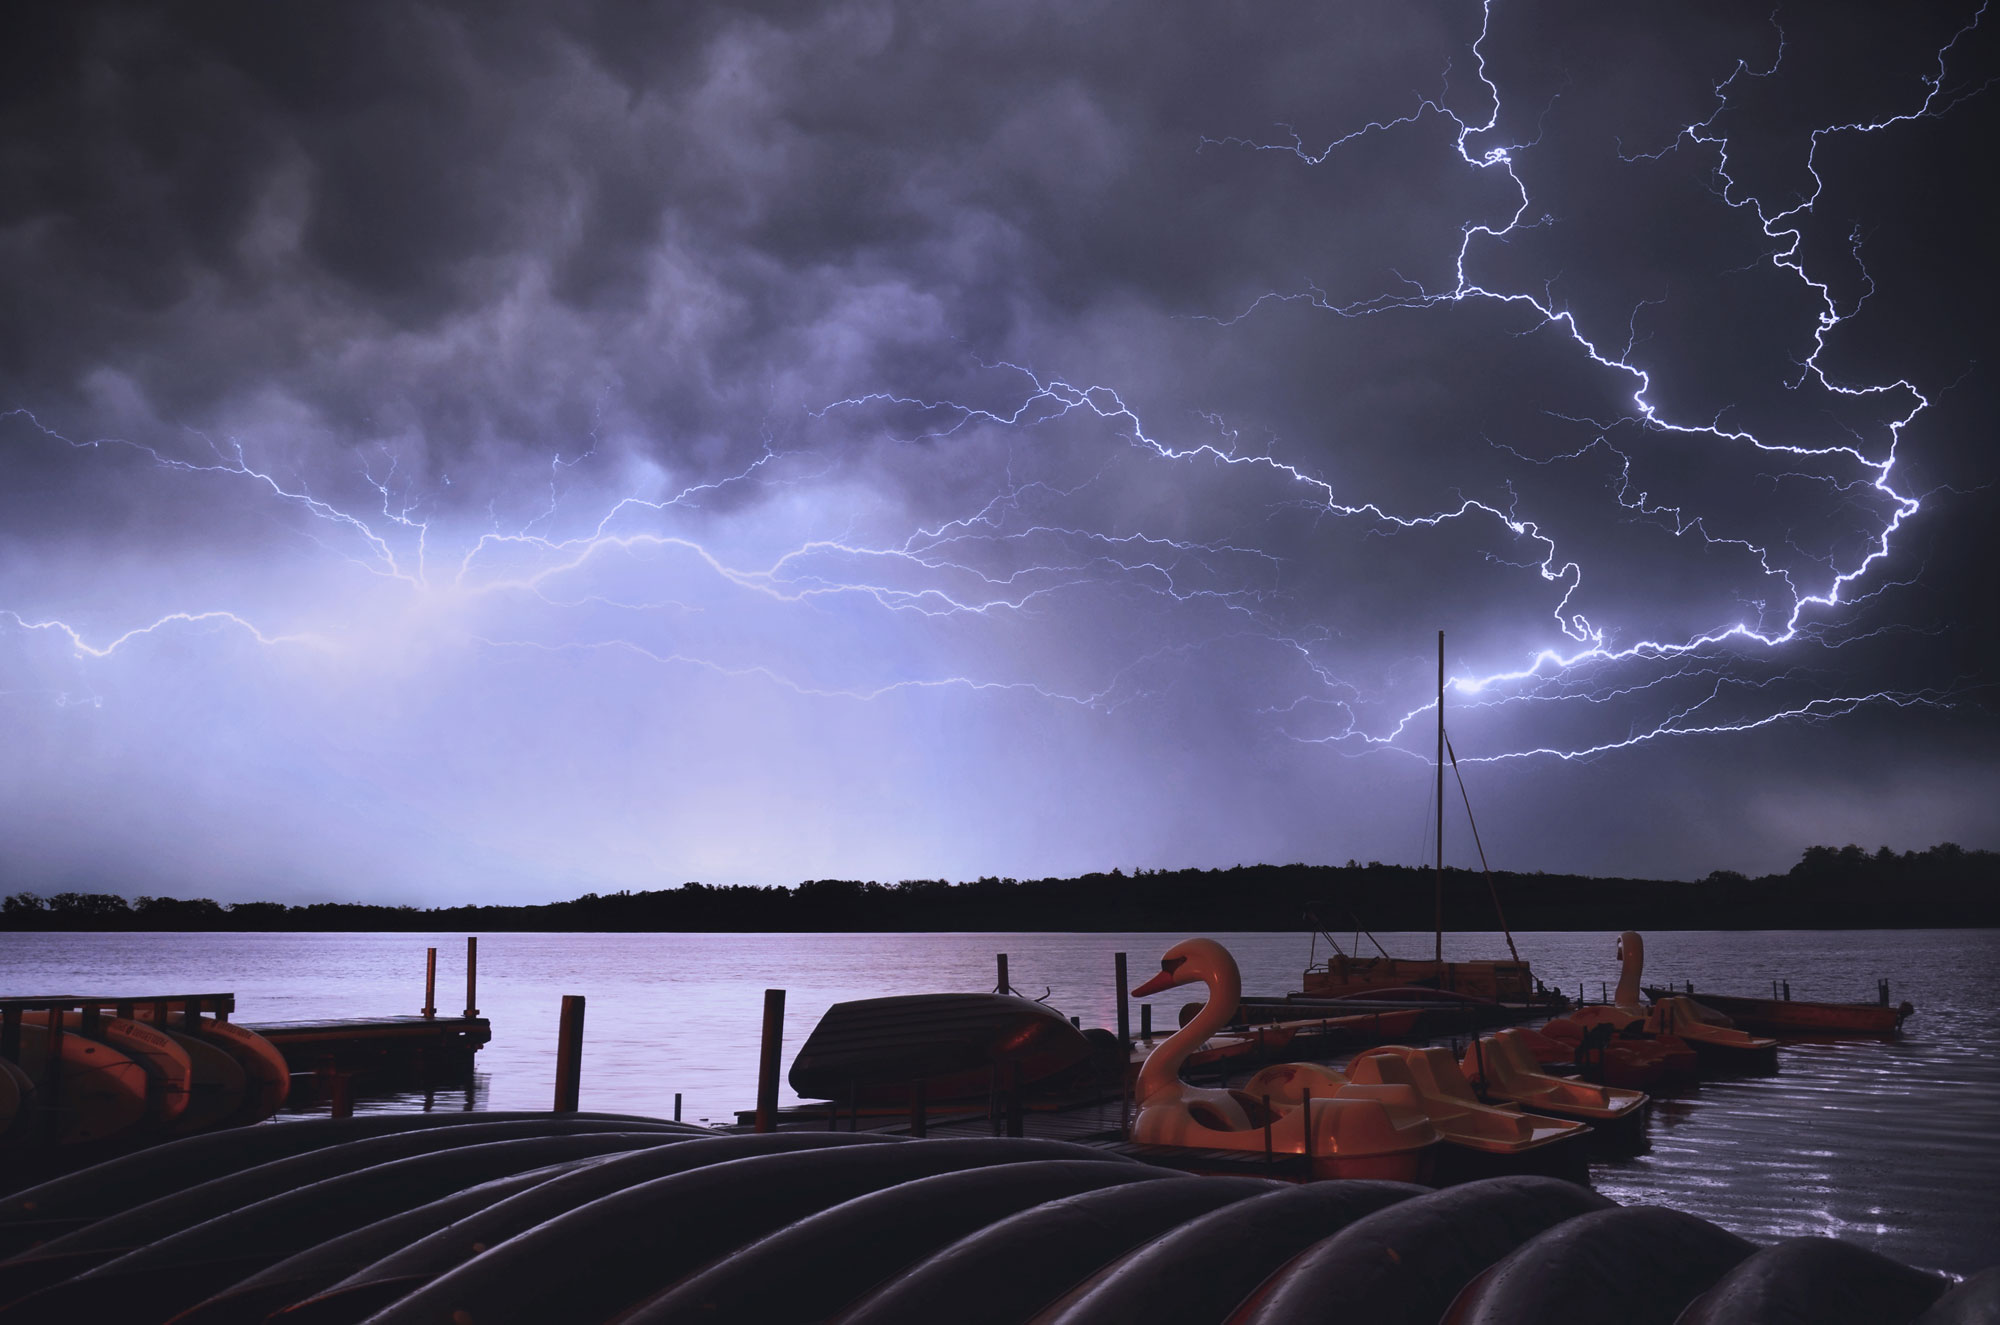
A storm over Madison, Wisconsin, 2013. Photo by Richard Hurd (flickr, Creative Commons Attribution 2.0 Generic license, image resized).
Typically, a storm blows itself out once the warm air has moved up and the cool air has moved down. Convective mixing stops because the vertical column of air has turned over so that the cool air is at the bottom and the warm air is at the top. The directions of air currents in the Midewest, however, promote mixing. The Midwest receives warm, moist air from the Gulf of Mexico, and cold, dry air from the Rocky Mountains and Canada. The warmer, lower air from the Gulf is moving north, constantly adding more heat and moisture. The colder, higher air is moving west. Where these air masses meet, vigorous mixing causes storms. The inputs of warm, dry air from the Gulf of Mexico allow these storms to persist and strengthen.
This movement in different directions is also the reason for the Midwest's unusually high incidence of powerful tornados. Tornado Alley is a nickname for an area extending from Texas to Minnesota (including the western Midwest) that experiences a high number of exceptionally strong tornados. Correcting for size, Indiana and Iowa are the states with the third and fourth most tornados, respectively. A few other places in the world see tornados more frequently per given area, but those in central North America tend to be much more powerful. The thunderstorms discussed above can sometimes produce dozens of violent tornados, called tornado outbreaks.
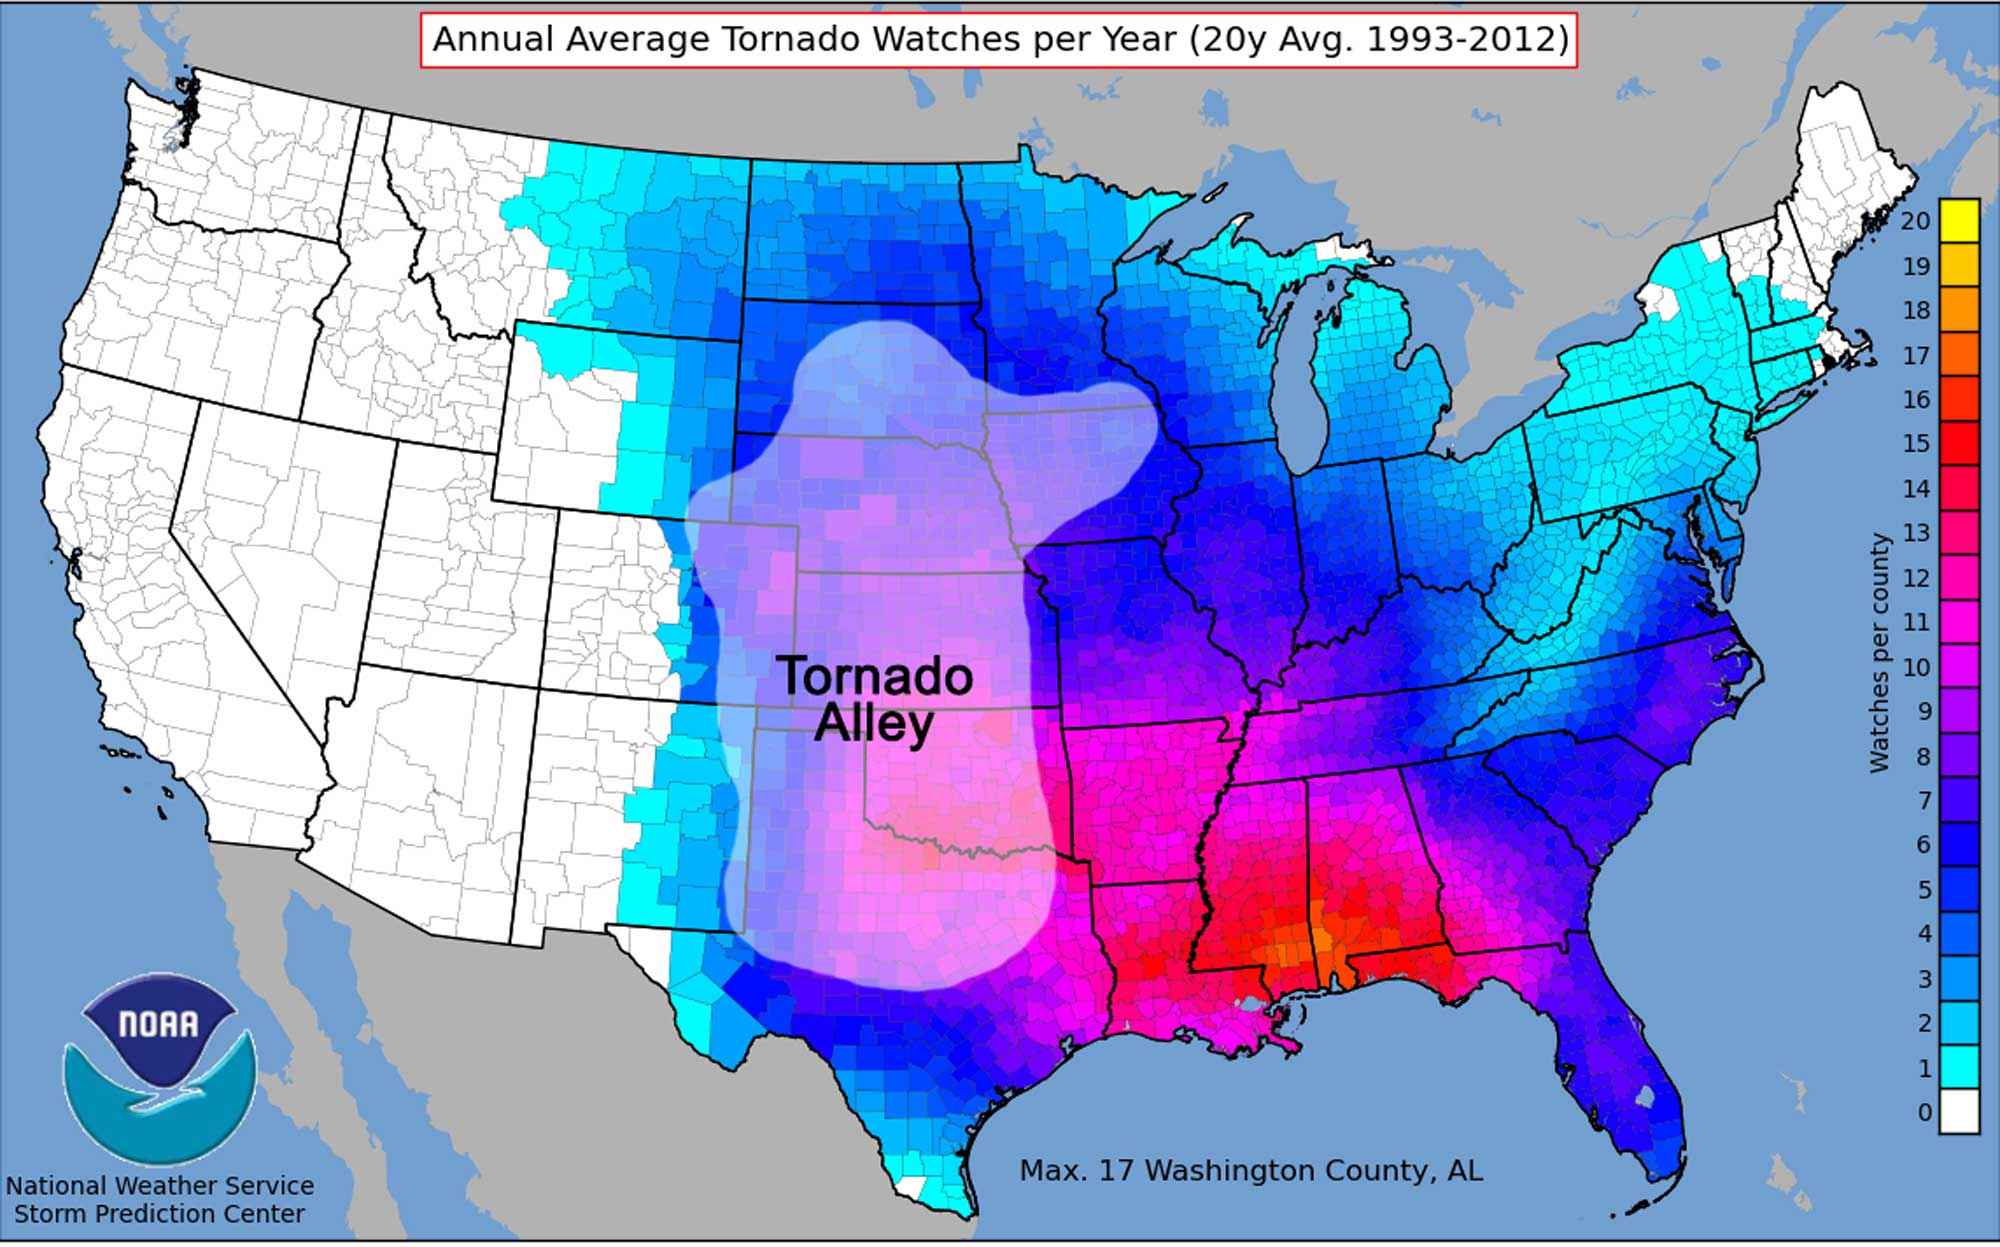
Average yearly tornado watches in each county of the United States between 1993 and 2012. Tornado Alley is identified. Map by NOAA (public domain) modified for the Earth@Home project.
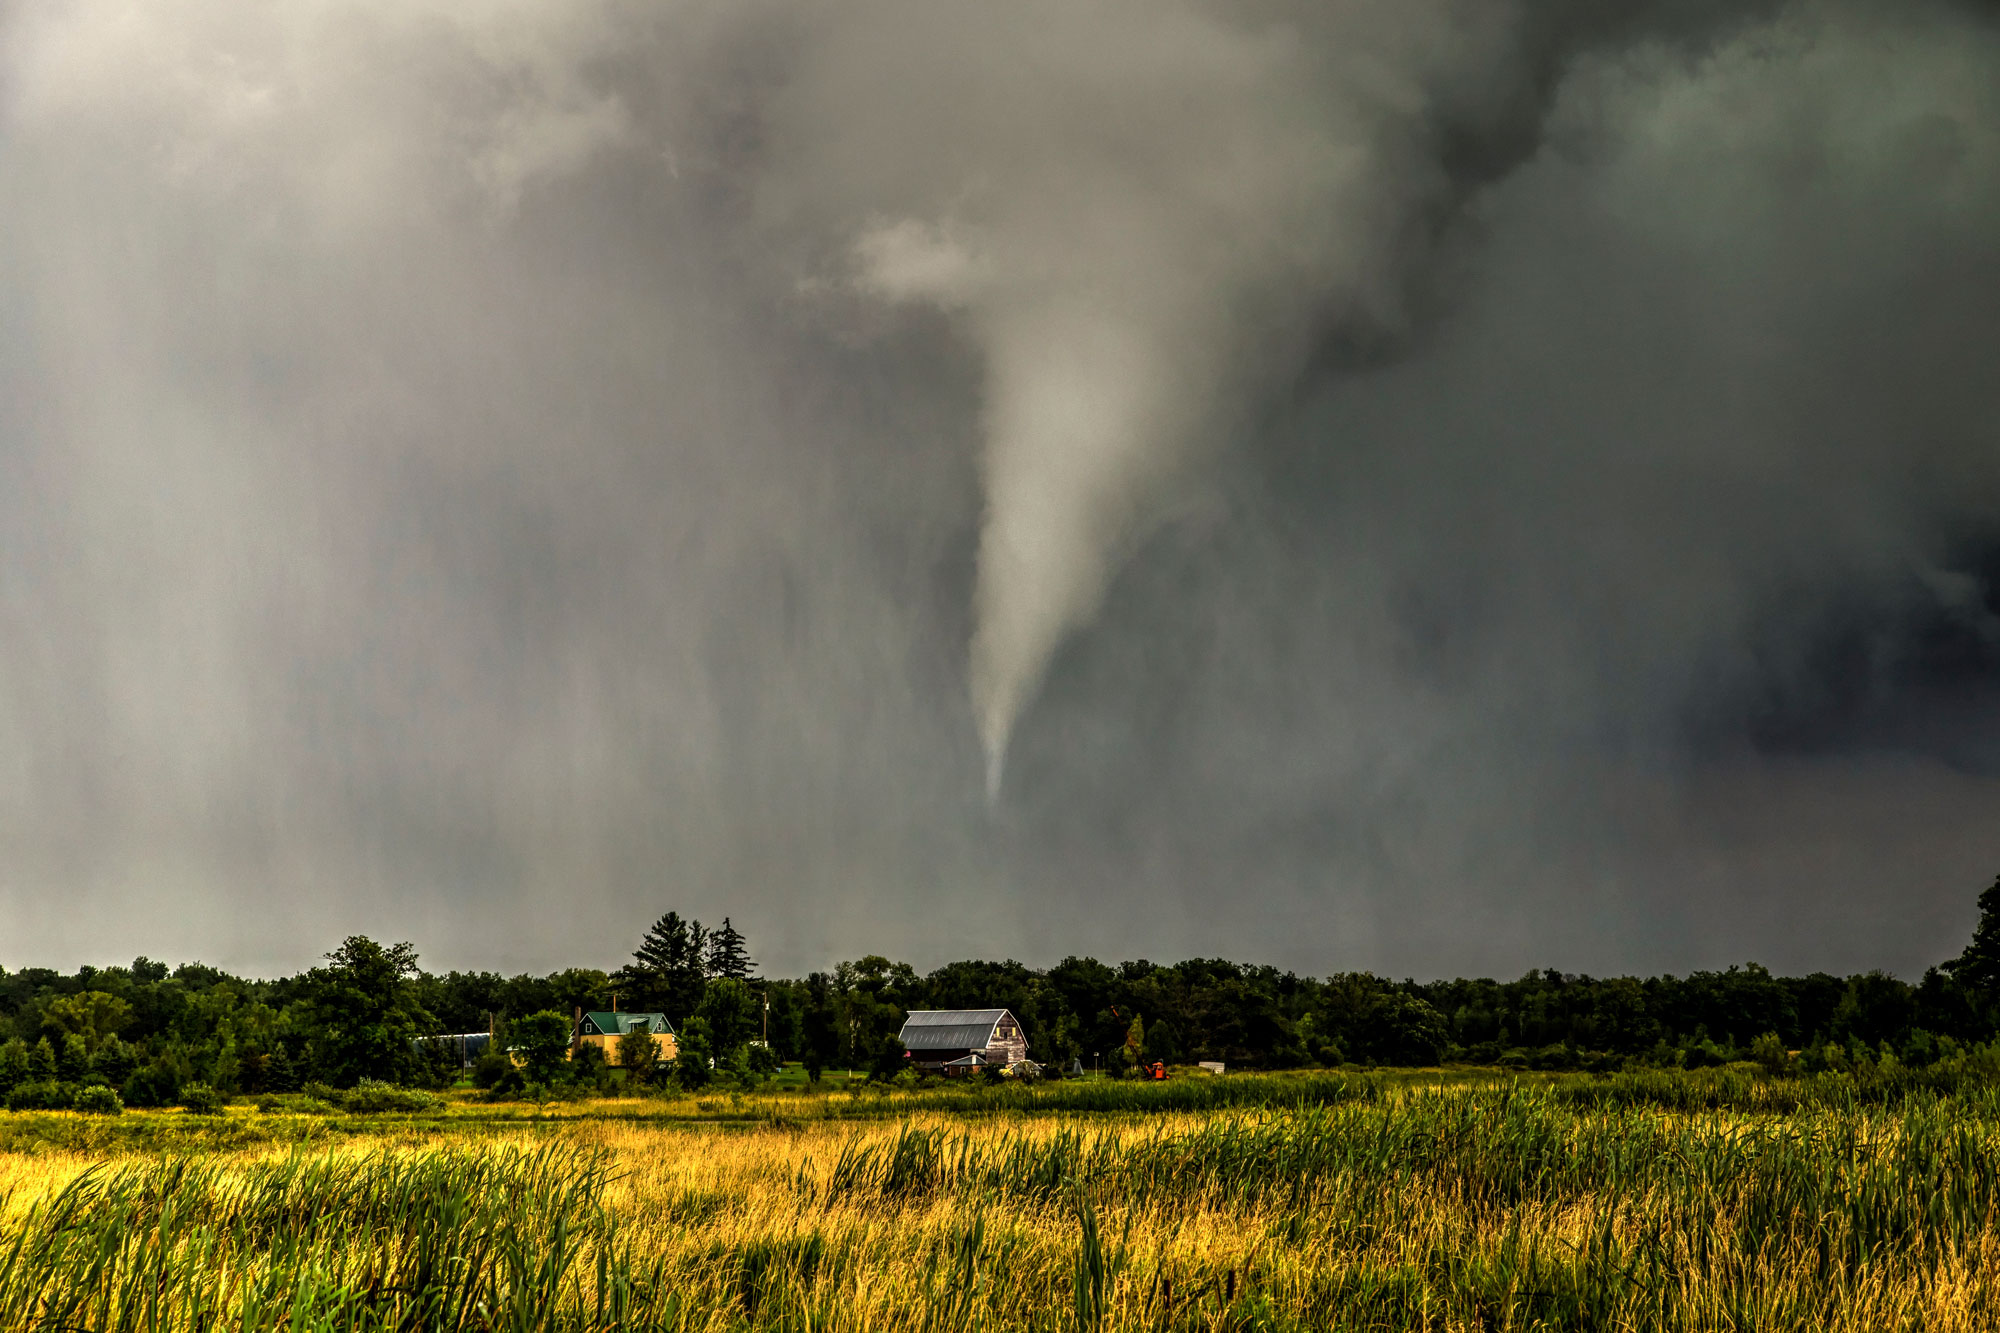
A tornado in Benton County, Minnesota, 2014. Photo by Amanda Hill, NOAA Weather in Focus Photo Contest 2015 (NOAA Photo Library on flickr, Creative Commons Attribution 2.0 Generic license, image resized).
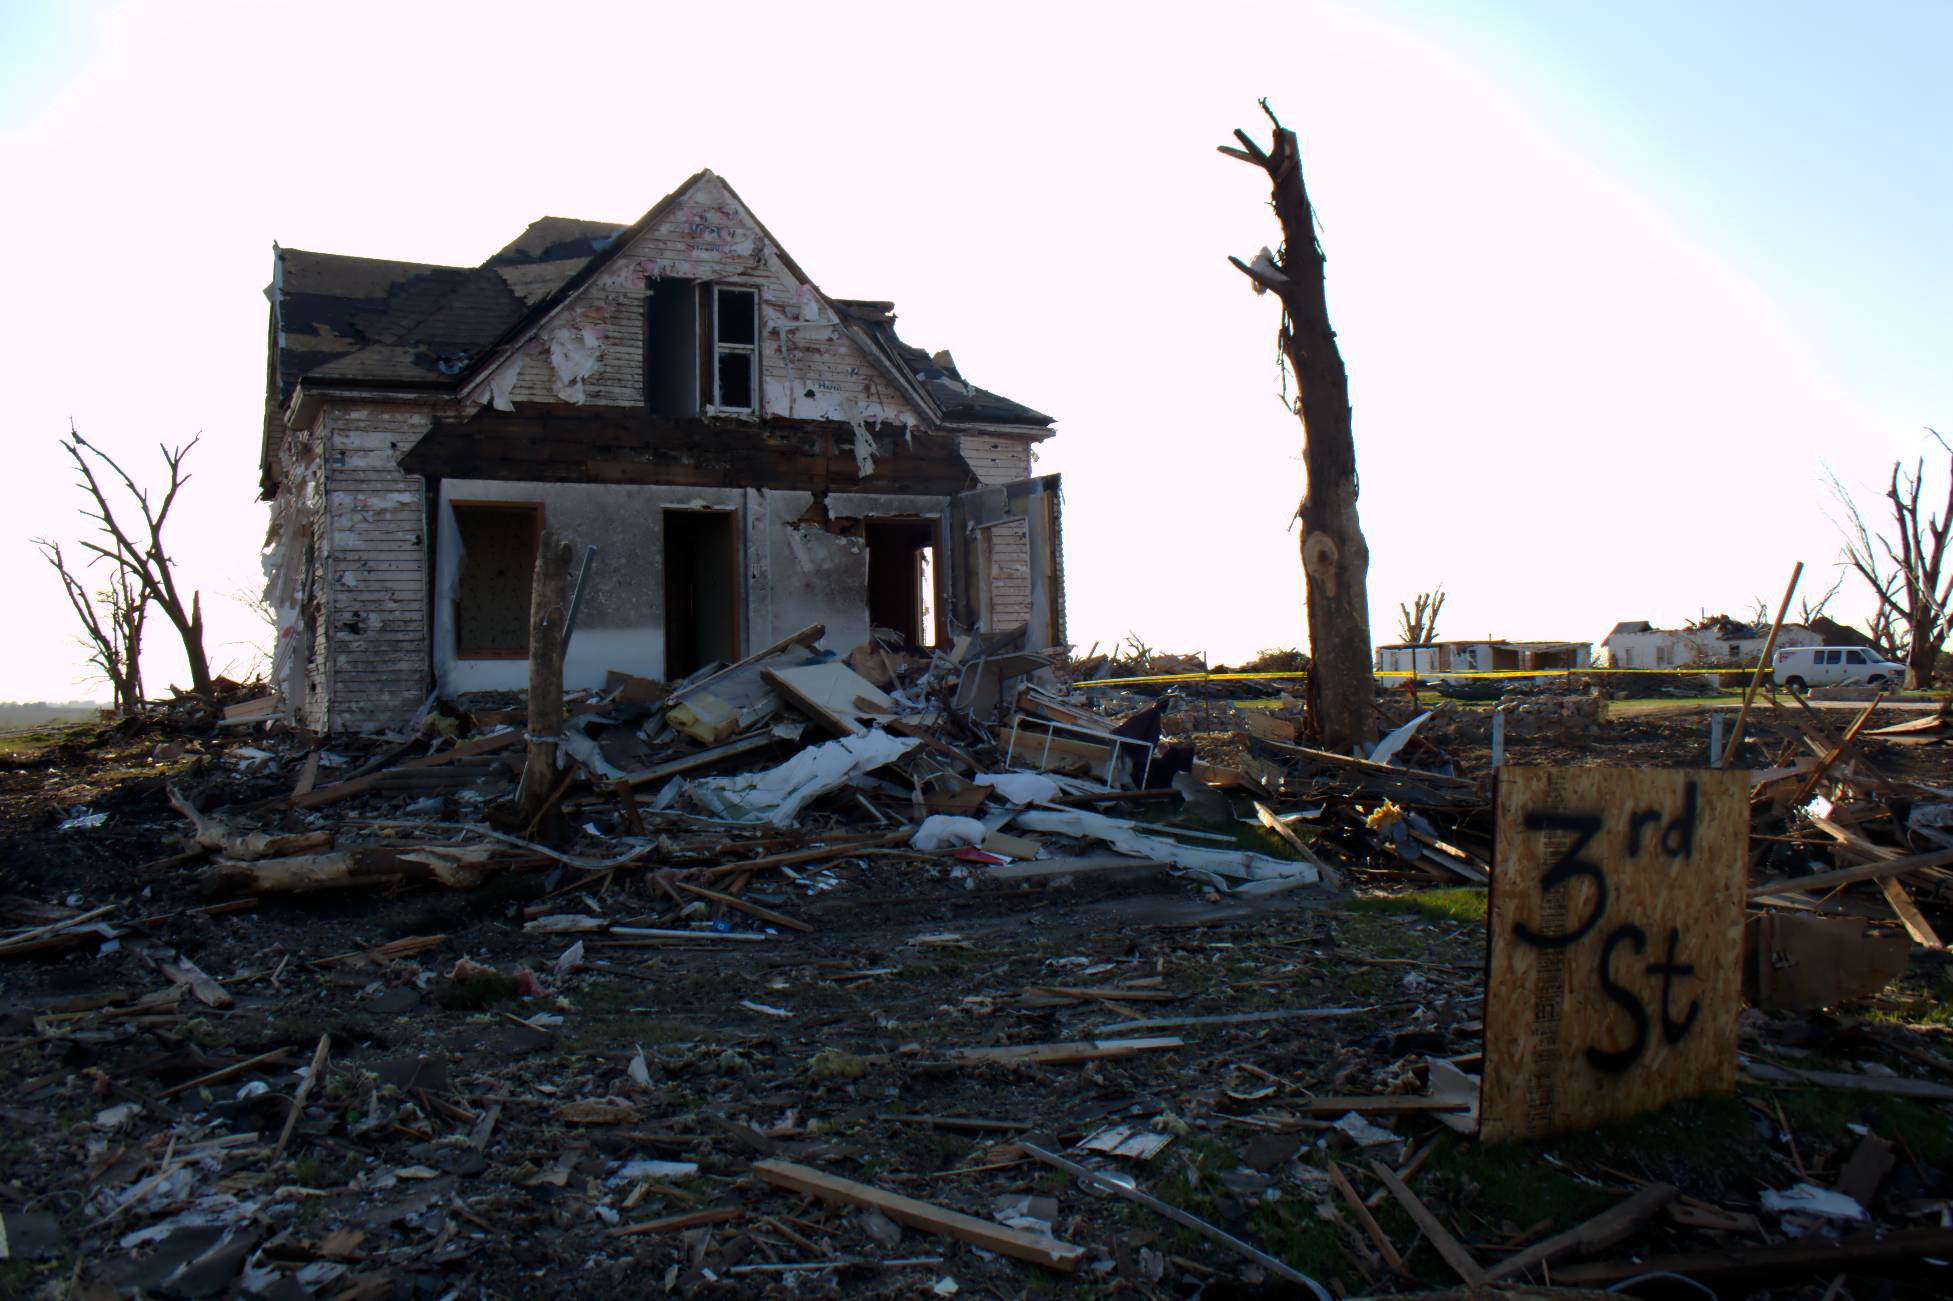
House in Parkersburg, Iowa, destroyed by a tornado, 2008. Photo by Vossman (Wikimedia Commons, Creative Commons Attribution-ShareAlike 3.0 Unported license, image resized).
Polar jet stream and winter storms
Harsh winter storms are a fact of life in the midwestern U.S. These storms are carried in by the polar jet stream, which typically falls near or over the area, especially in the winter. Jet streams—more than one exists—are narrow bands of fast moving air high above Earth's surface. The Earth’s rotation drives these rivers of air and causes them to blow from west to east. Jet streams are typically found between 6 and 13 kilometers (4 and 8 miles) above the surface and can move at speeds tens to hundreds of kilometers (miles) per hour.
"The Polar Jet Stream." Video description: Animation of the Earth showing the north polar jet stream. The video starts with a view centered on the north pole, with the jet stream encircling it in a sinuous wave. The Earth then turns to center on North America, showing the jet stream taking an ever-changing, sinuous route over Canada and the northern United States. Video by NASA Scientific Visualization Studio (via YouTube).
Because jet streams separate warm and cold air masses, their movements influence the weather. Polar jet streams are typically found between 50° and 60° North and South latitude, and subtropical jet streams are typically found around 30° North and South latitude. As the boundaries between hot and cold air are sharpest in the winter months, jet streams are stronger in the winter.
In the midwestern states, the polar jet stream combined with lake effect snow (discussed below) strongly impacts the area’s weather. All of the states of the Midwest experience winter storms to some extent, during which several inches of snow falls. While inconvenient and damaging to infrastructure, these storms do not frequently cause widespread disruption, as residents and governments are usually prepared to clear roads and repair damage. Additionally, schools have snow days calculated into their schedules. Ice storms can be more dangerous; as rain freezes to trees, power lines, and rooftops, they may collapse under the weight. If you are able to free your car, the icy roads are even more dangerous to drive on than snowy ones.
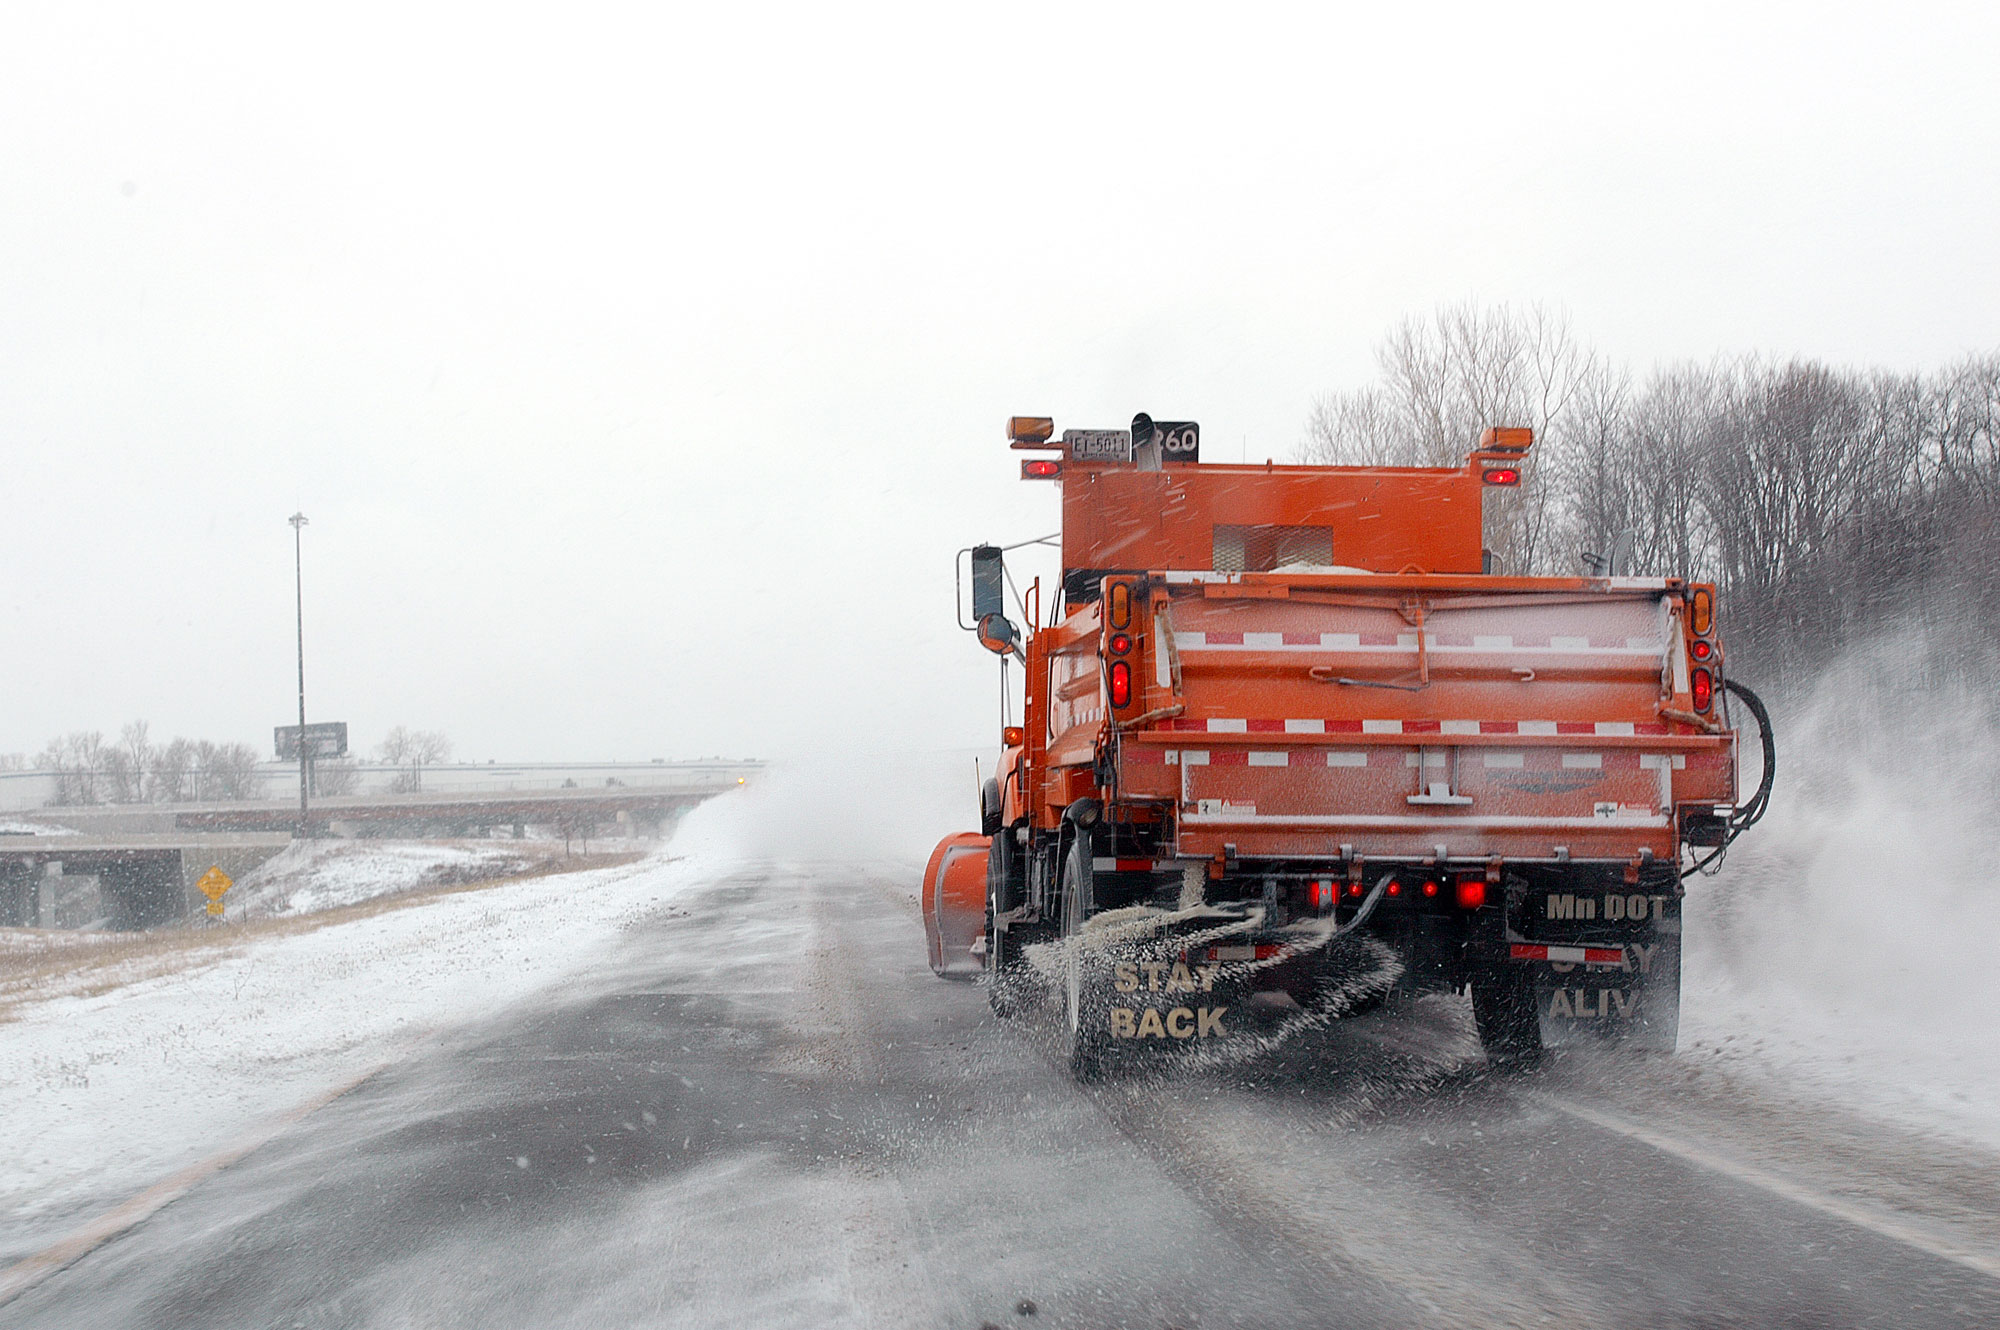
A snowplow spreading salt on a road during the winter, Minnesota. Photo by David R. Gonzalez, Minnesota Department of Transportation (MPCA Photos on flickr, Creative Commons Attribution-NonCommercial 2.0 Generic license, image resized).
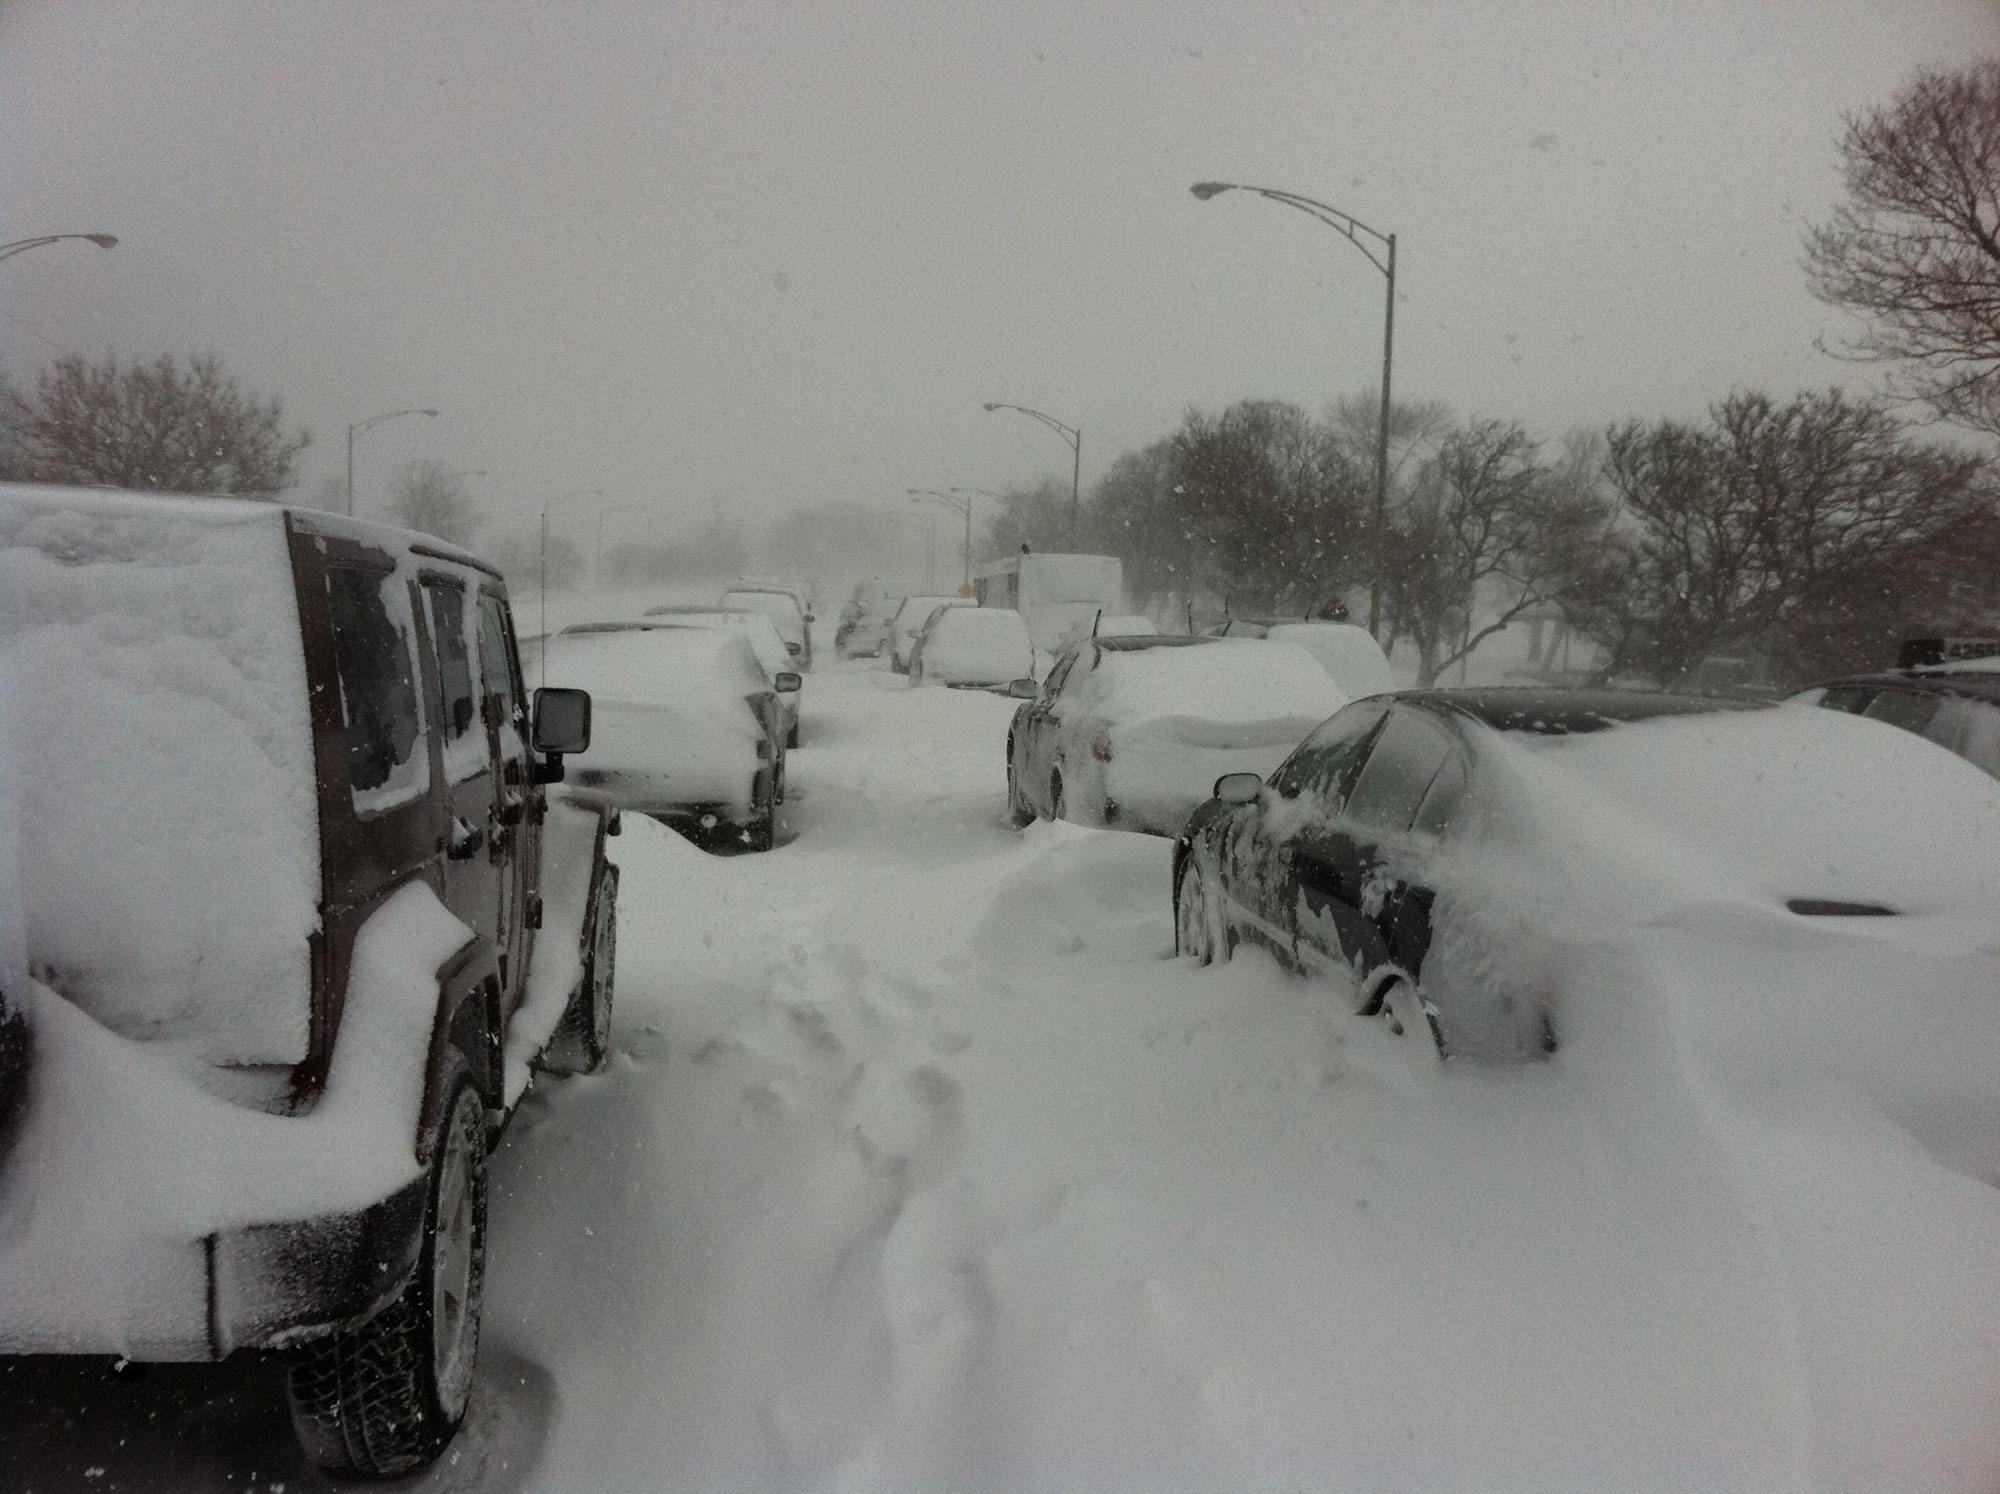
Cars stranded in traffic on Lake Shore Drive, Chicago, Illinois, 2011. The blizzard that hit the city in February 2011 caused an unusual degree of disruption, stranding motorists when snow piled up while they were stuck in traffic. Eleven people died as a result of the storm, an unusually high number for a snowstorm in the United States. Photo Victorgrigas/t3xt (Wikimedia Commons, CC0 1.0 Universal/public domain dedication).
The polar vortex
The polar vortex is a pattern of winds around the North Pole, including the polar jet stream. In the winters of 2013–2014 and 2014–2015, the polar vortex shifted southward, bringing unusual weather patterns to much of North America. Weaker polar vortices can occur when weather near the pole is warmer than usual, and a weak polar vortex allows for a wandering jet stream. Some climate scientists believe the unusual winters of recent years are explained by natural variations, while others suggest that they could be driven due to decreases in sea ice and faster increases in arctic temperatures when compared to areas at lower latitudes.
"NASA's AIRS Sees Polar Vortex Behind U.S. Big Chill." Video description: Video shows an animation of a globe with a view of North America. Color coding indicates temperature in degrees Kelvin. The polar vortex is indicated by dark blue to purple, and reaches as far south as the northern United States, especially the northwest-central and Great Lakes regions. Video by airsnews (via YouTube).
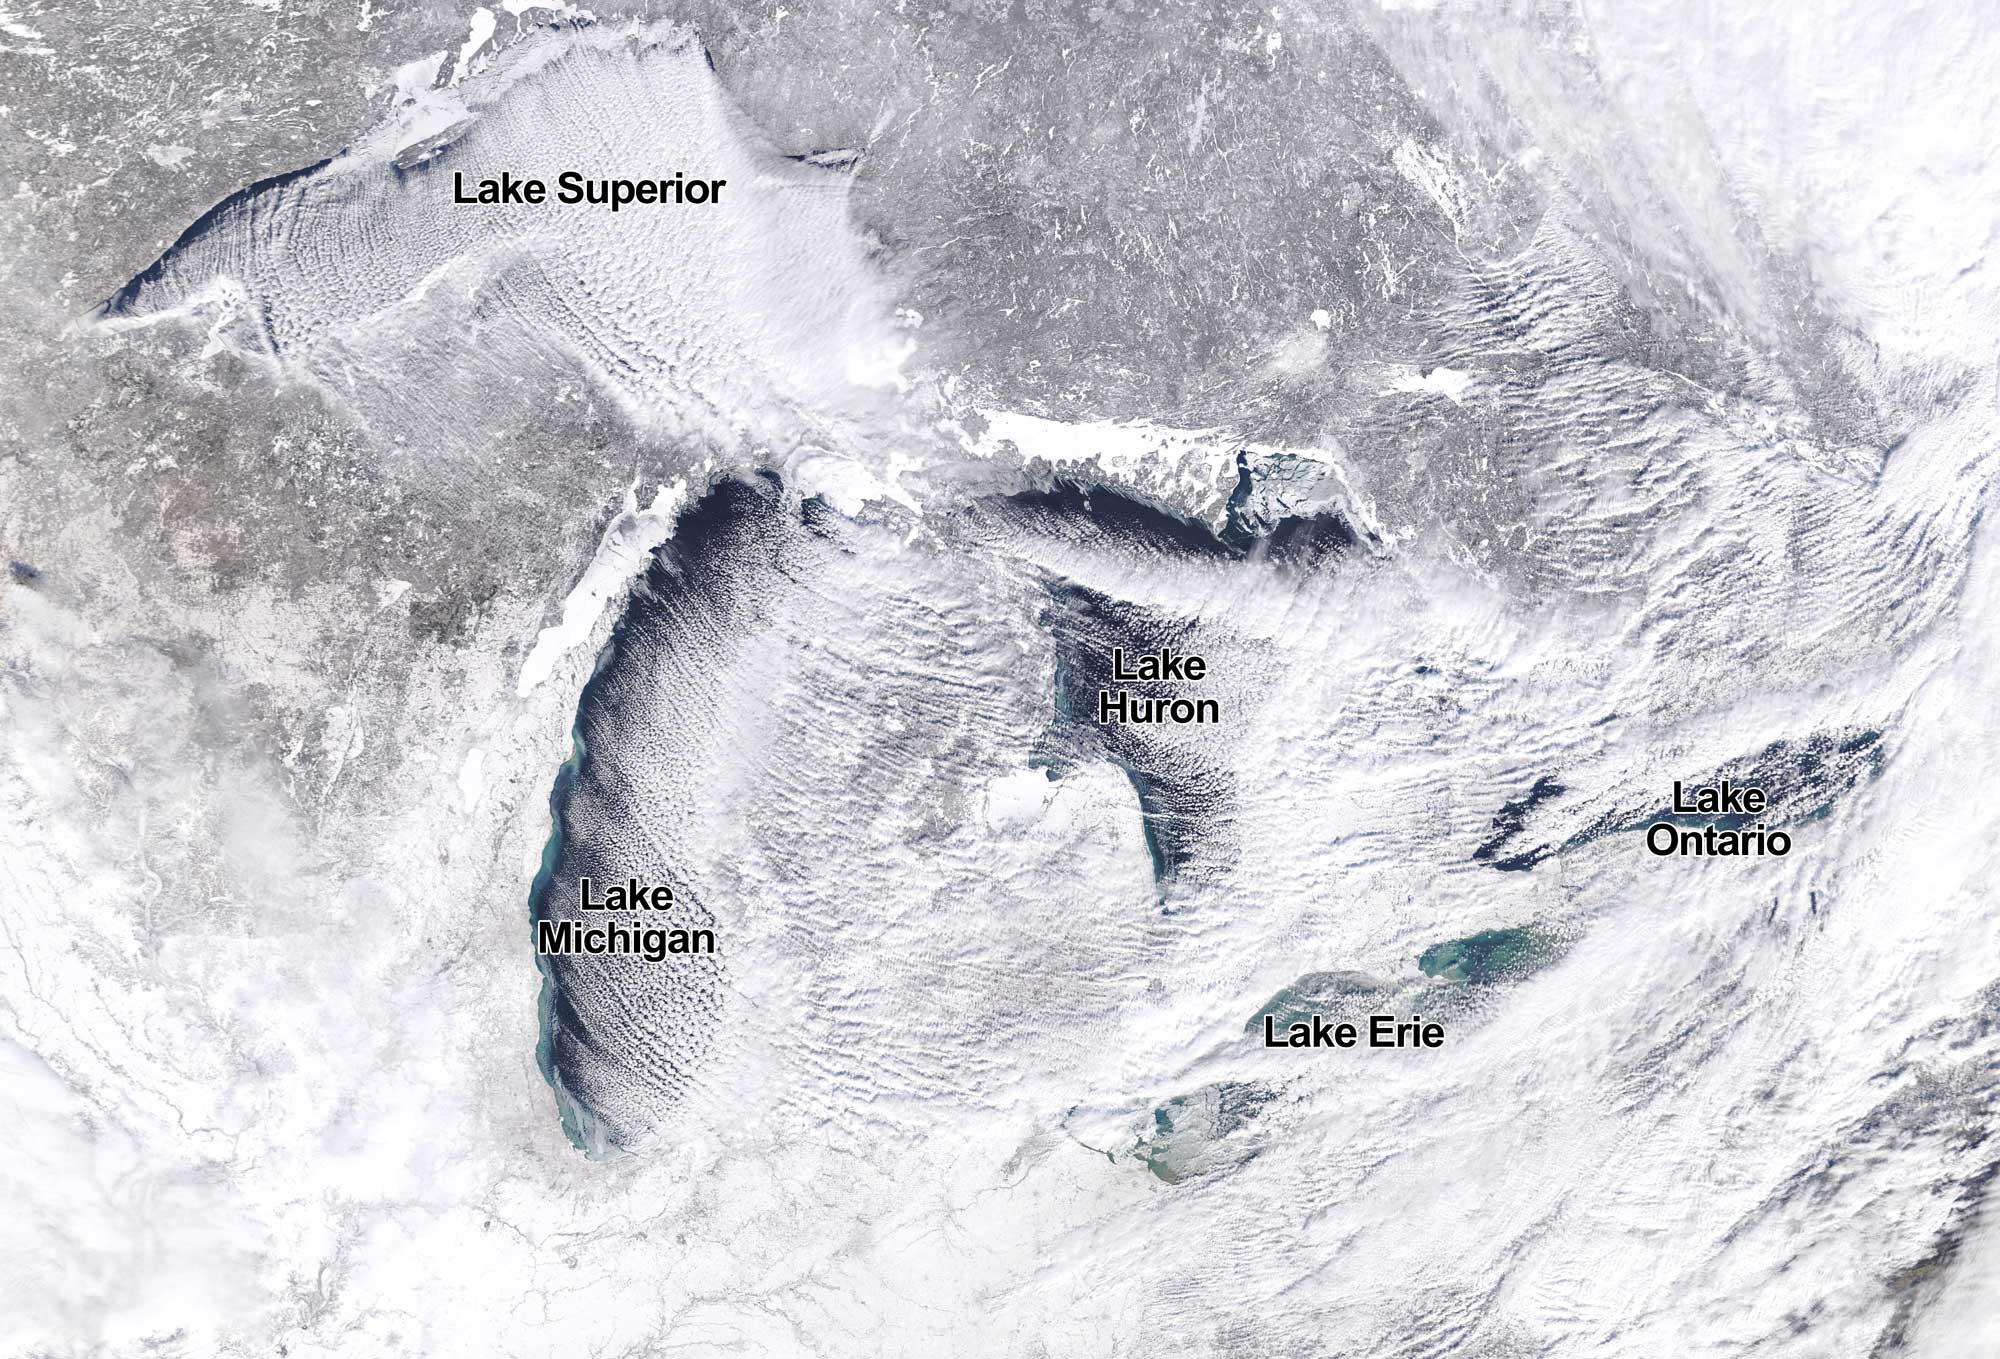
Satellite image showing the Great Lakes region of the United States and Canada during a polar vortex, January 27, 2019. The streaks of snow coming off the Great Lakes are "cloud streets" indicative of lake effect snow. Source: NASA Earth Observatory image by Josh Stevens (used following NASA's image use policy).
Lake effect snow
The Great Lakes create an interesting phenomenon primarily on their eastern shores, mainly affecting Michigan as well as parts of the Northeast, known as the lake effect. During the winter, the large volume of water in the Great Lakes acts as a reservoir of heat, making the air above it relatively warm and humid. When cold air moves across the warmer lake, convection begins, and, as described above, a storm can form. The moisture from the lake begins to precipitate soon after the air cools. The Upper Peninsula of Michigan usually receives over five meters (200 inches) of snow per year, second only to Tug Hill Plateau in New York, which also gets lake effect snow. The highest recorded winter snowfall total was 9.9 meters (390.4 inches) in 1978 to 1979 in Keweenaw County.
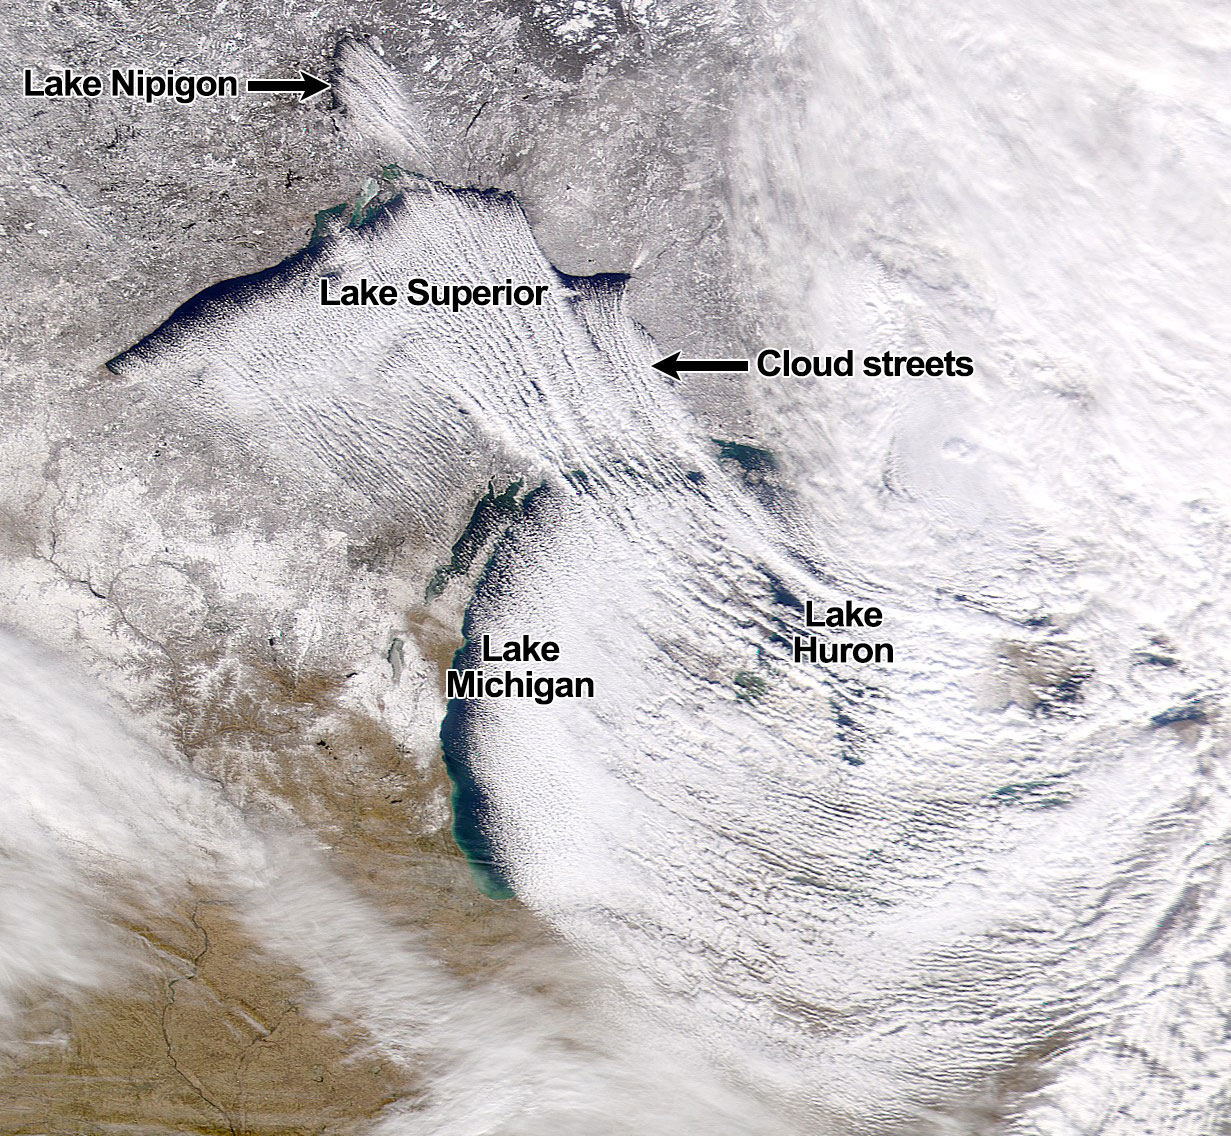
Satellite image showing the Great Lakes region of the United States and Canada on December 5, 2000. The streaks of snow coming off the Great Lakes are "cloud streets" indicative of lake effect snow. Lake Erie and Lake Ontario are almost entirely obscured by clouds in this image. Lake Nipigon is in Ontario, Canada (not technically one of the Great Lakes, it is part of the same drainage basin). Source: NASA Earth Observatory, image by SeaWiFS Project, NASA/Goddard Space Flight Center, and ORBIMAGE (used following NASA's image use policy).
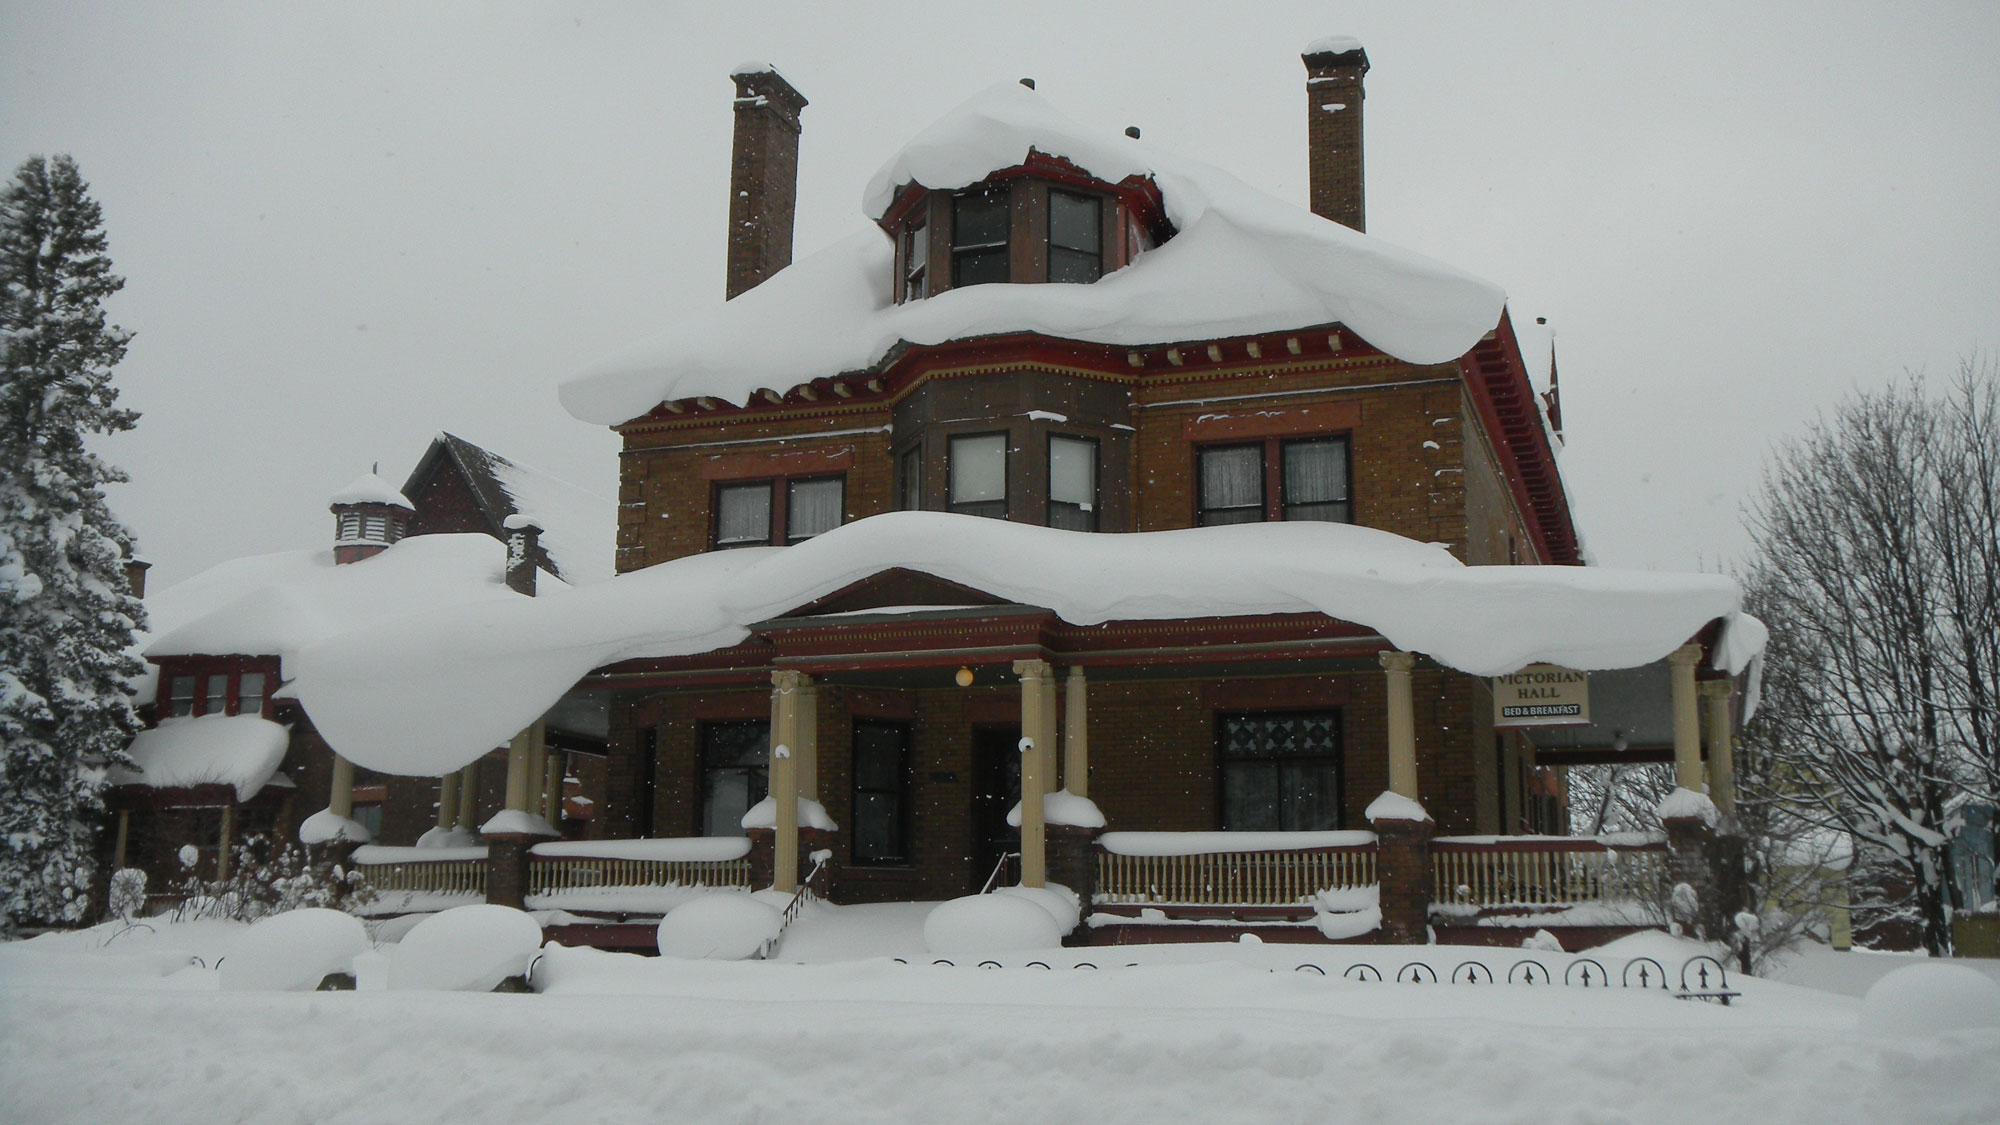
Snow on Victorian Hall, Laurium, Upper Peninsula of Michigan, January 26, 2013. Photo by Saukkomies (Wikimedia Commons, Creative Commons Attribution-ShareAlike 3.0 Unported license, image resized).
Past climate of the midwestern U.S.
This section covers the climate of the midwestern U.S. through the Phanerozoic, from about 541 million years ago to the recent. For the climate on early Earth, see the Intro to Climate section.
Paleozoic (541 to 252 million years ago)
Cambrian to Ordovician (541 to 444 million years ago)
At the beginning of the Paleozoic era, climates across the world were warm, and North America was located in the low and warmer latitudes of the Southern Hemisphere. As the Cambrian progressed, North America moved northward; by about 480 million years ago, what would become much of the midwestern U.S. was located between the Tropic of Capricorn and the Equator. Marine invertebrate fossils reveal that most of the area was probably covered by warm, shallow seas from the Cambrian into the Ordovician.
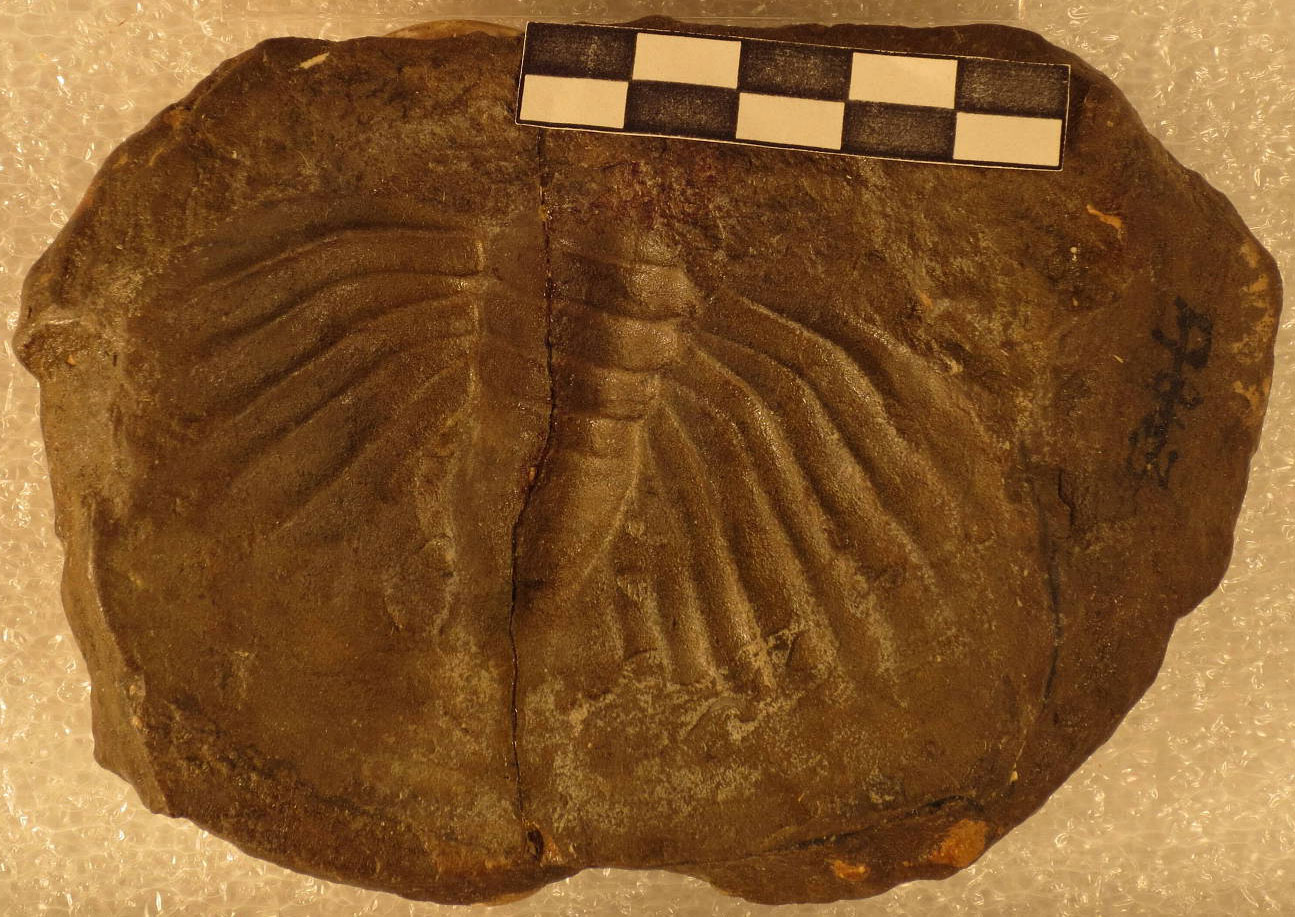
Trilobite pygidium (Dikelocephalus minnesotensis), Cambrian Trempealeau Formation, Washington County, Minnesota. Photo of USNM PAL 17863 by Department of Paleobiology (National Museum of Natural History, Smithsonian Institution, CC0/public domain).
During the middle Ordovician, much of the Midwest was covered by very pure, quartz-rich sand, which is today makes up the St. Peter Sandstone. Quartz is extremely resistant to weathering, and it is often the last mineral left when other minerals have weathered away. The purity of the St. Peter Sandstone suggests that the climate was intensely wet and warm when the sand was deposited. Further, it suggests that the sand was heavily weathered, perhaps by being washed or blown (or both!) back and forth for a long time before being buried.
Mining of St. Peter Sandstone in Auburn, Wisconsin, 2013. St. Peter Sandstone is used in frack sand, used in the process of horizontal drilling and hydraulic fracturing, a method of extracting natural gas from shales. Photo by Ted Auch, FracTracker Alliance, 2013 (FracTracker Alliance on flickr, Creative Commons Attribution-NonCommercial-NoDerivs 2.0 Generic license).
Fossil evidence in Wisconsin and elsewhere in the Midwest shows that at least some of the Midwest was covered by a warm inland sea in the late Ordovician, following deposition of the St. Peter Sandstone. Limestone formed from the innumerable remains of living creatures was the predominate sediment in this sea. The sea persisted in some form for several hundred million years.
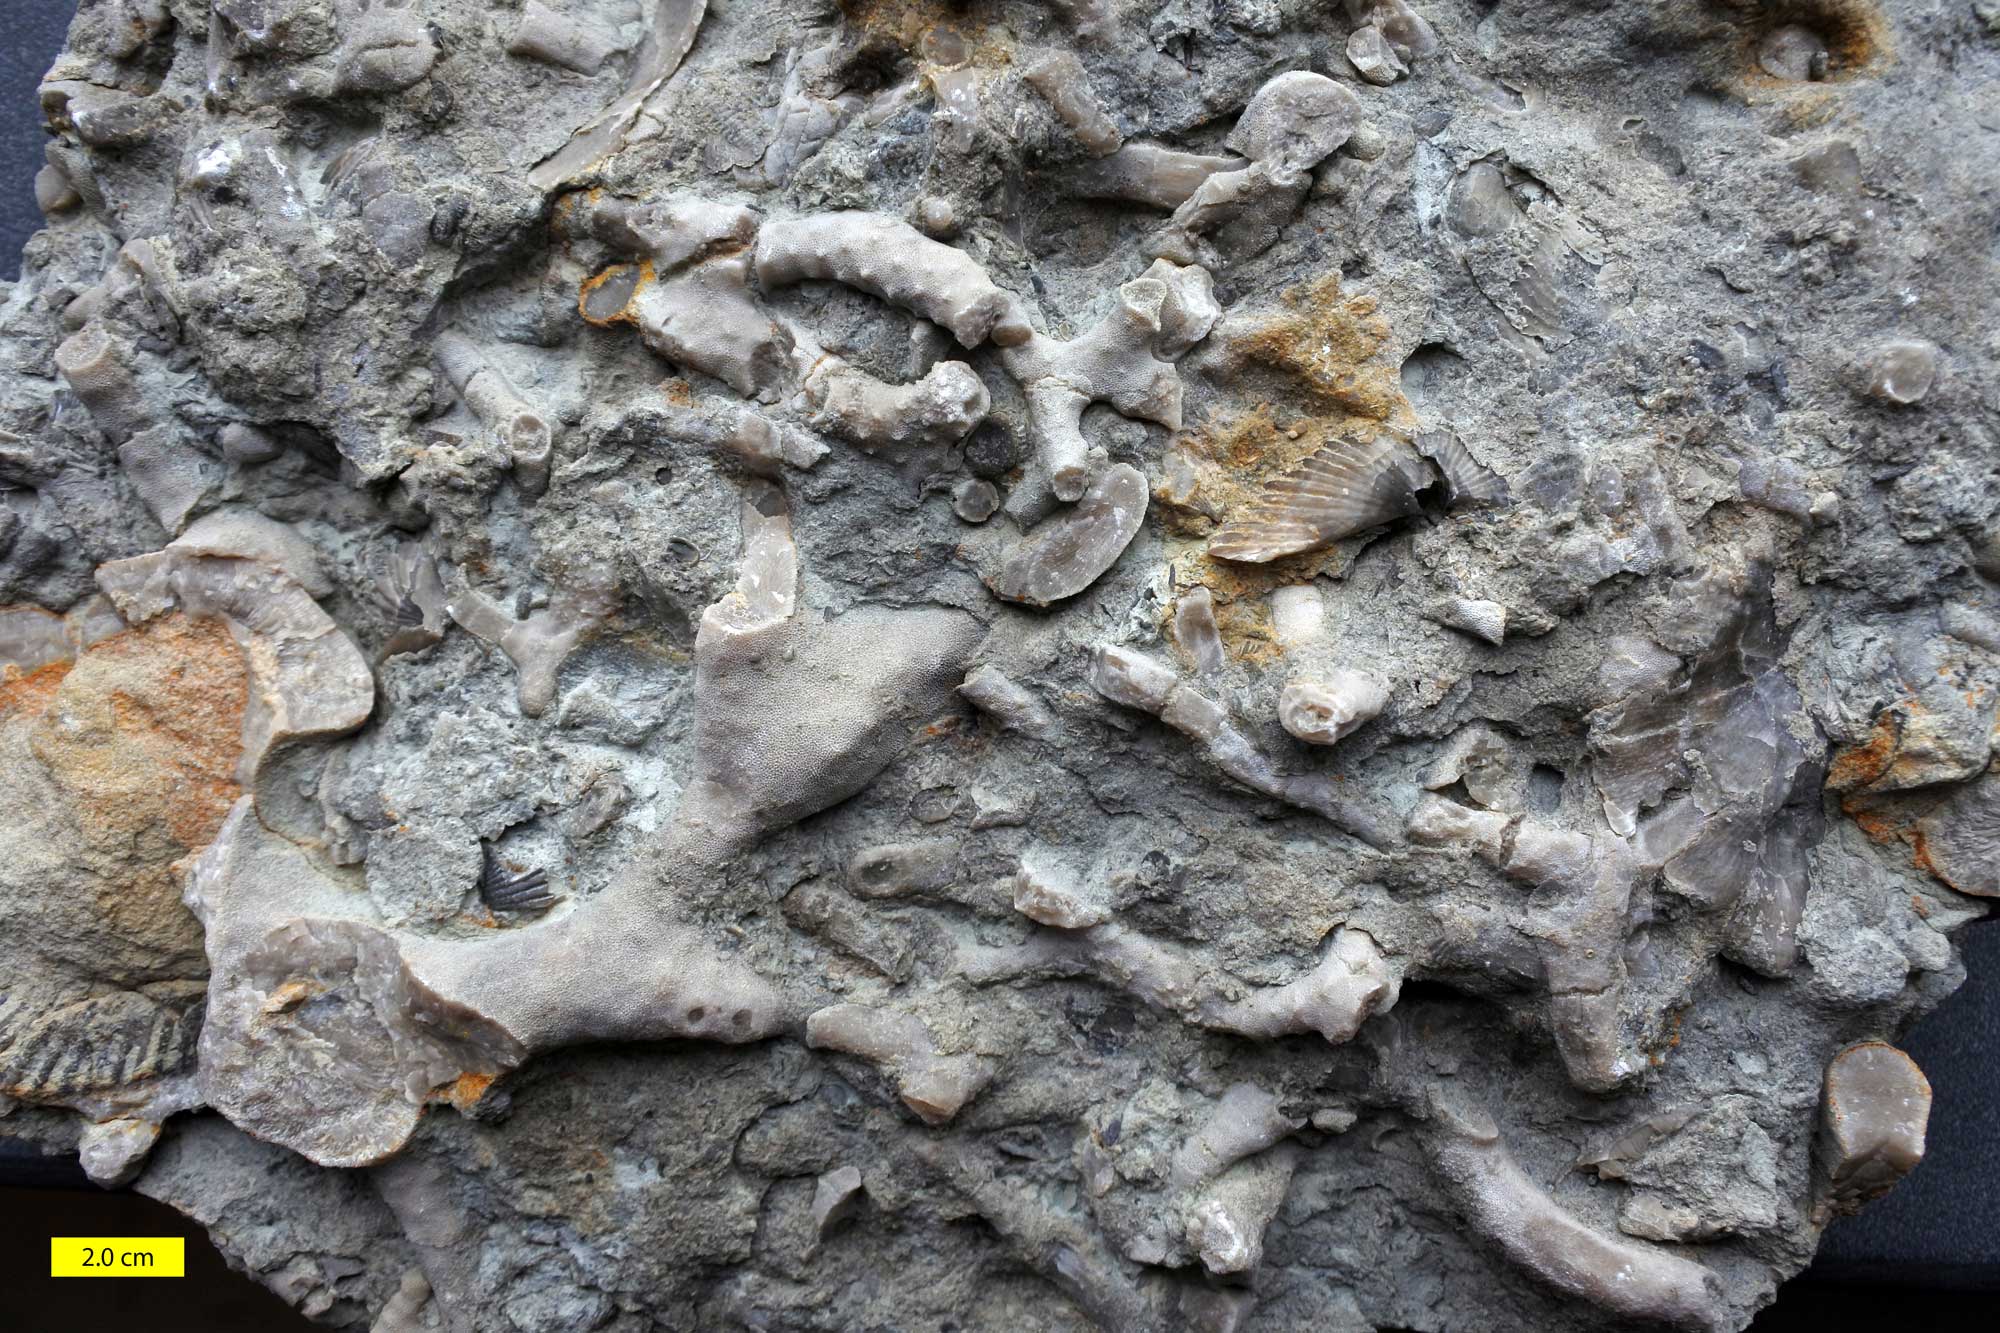
Bryozoans and brachiopods, late Ordovician Whitewater Formation, Indiana. Photo by Mark A. Wilson (Wikimedia Commons, CC0 1.0 Universal/public domain dedication).
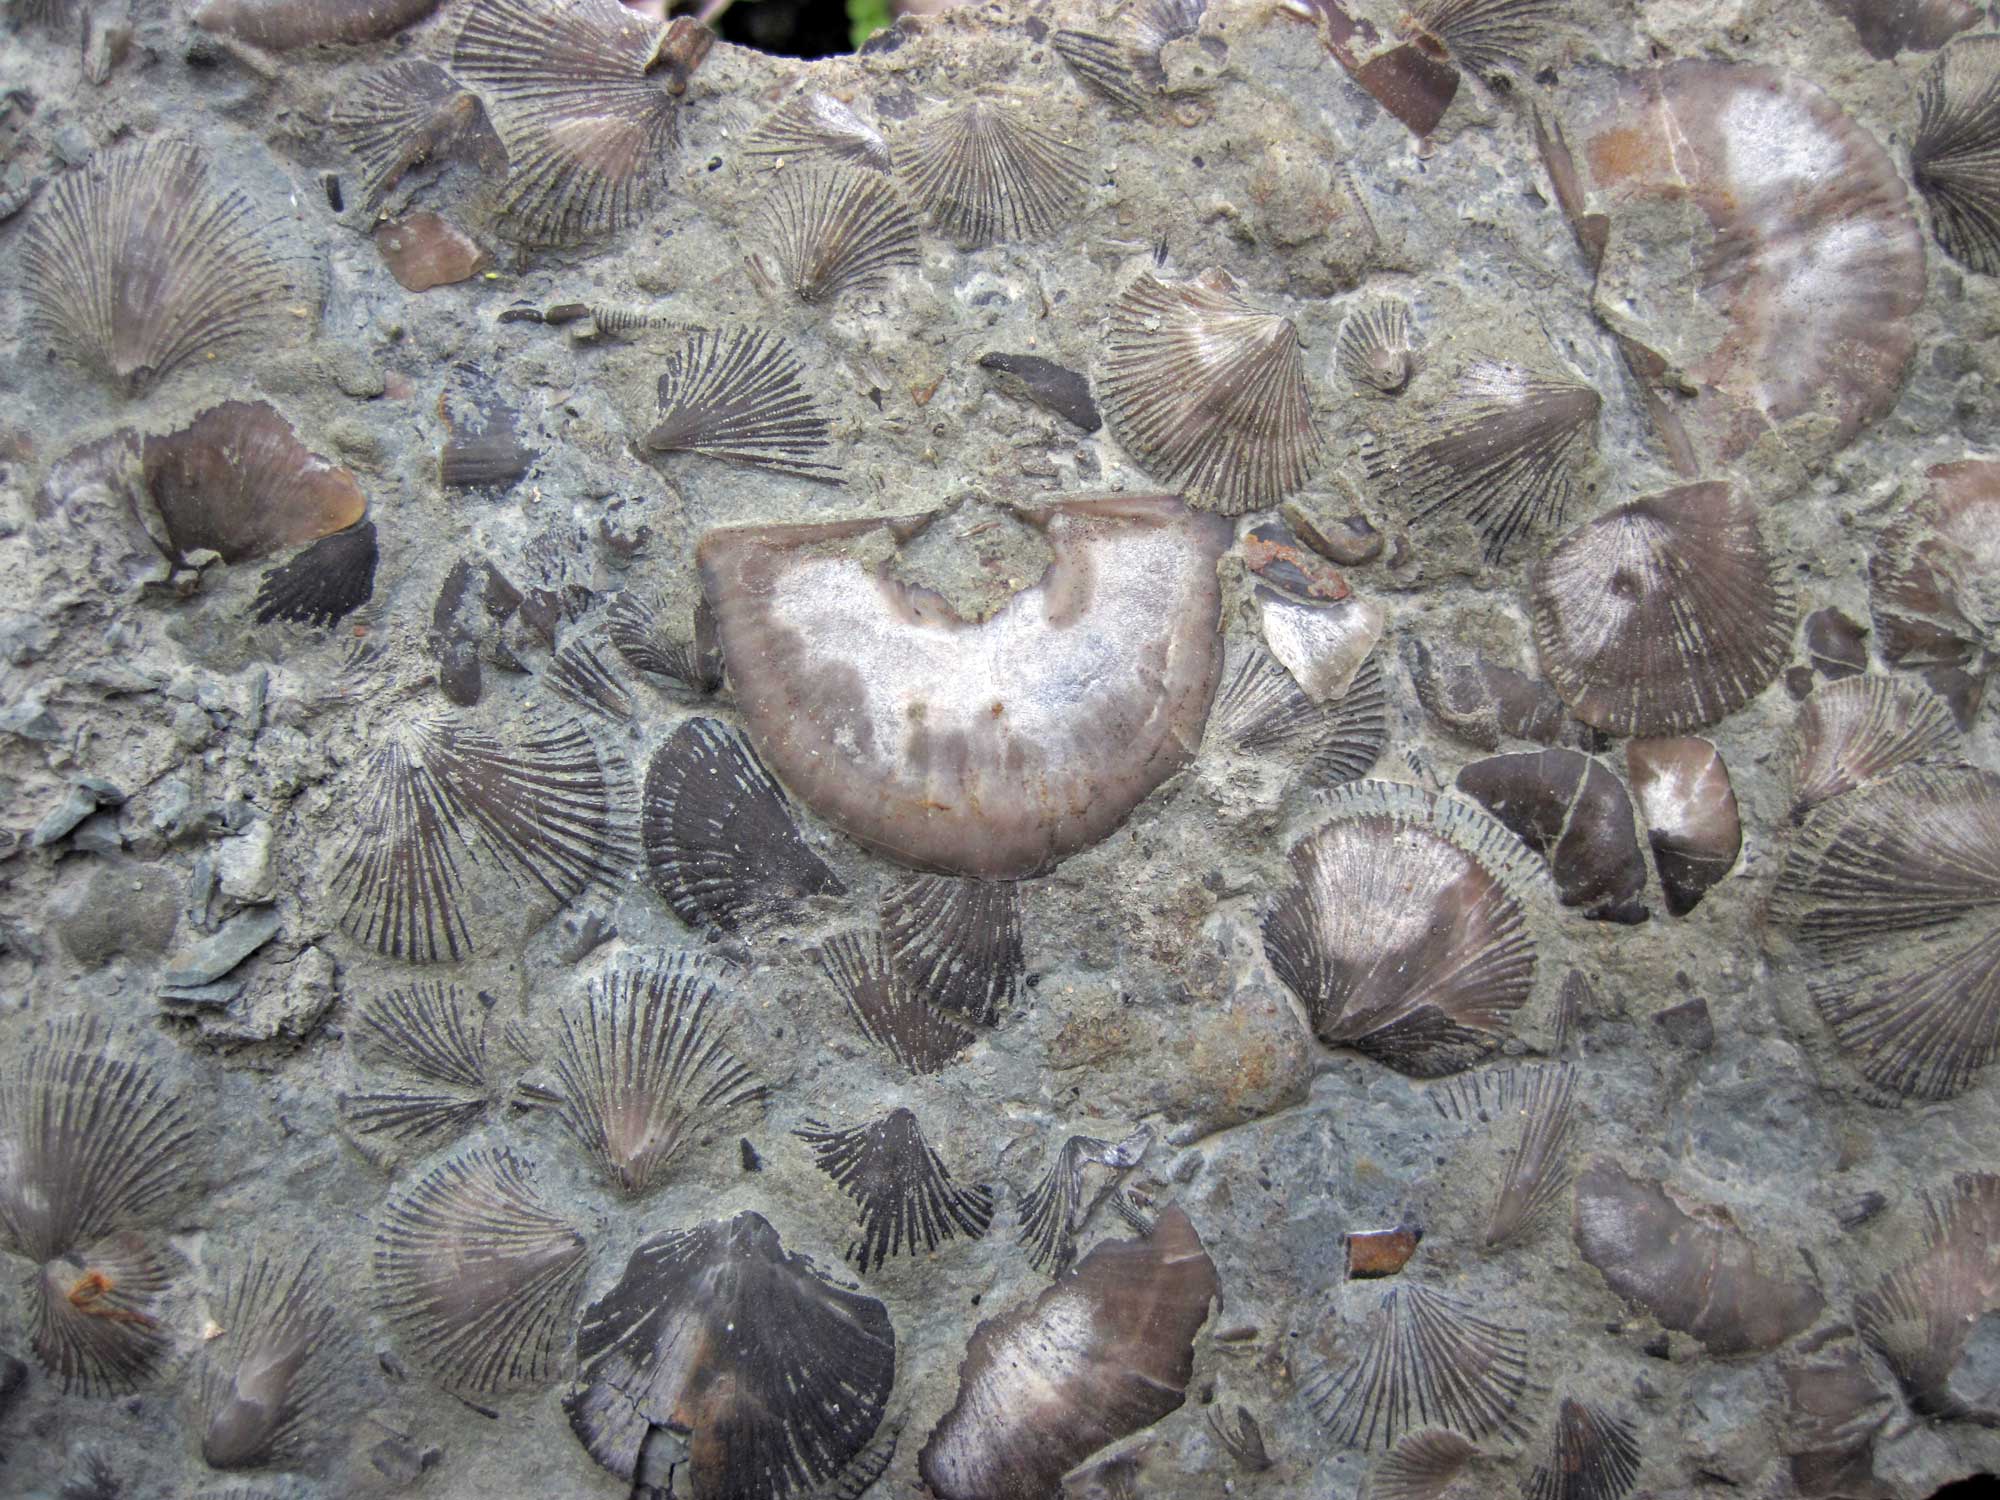
Brachiopods, late Ordovician Waynesville Formation, Warren County, Ohio. Photo by James St. John (flickr, Creative Commons Attribution 2.0 Generic license, image resized).
Silurian to Devonian (444 to 359 million years ago)
An ice age in the late Ordovician caused a global dip in temperature from 460 to 430 million years ago. Despite cooler global temperatures, the midwestern sea remained warm enough to sustain tropical reef ecosystems. One of the largest reefs the world has ever seen existed in the Midwest during this time. The reef grew around the shallow edges of a wide basin centered on Michigan. Today, the limestone reef deposits (as limestone) can be found in much of the Midwest. They are thickest in Indiana and Illinois, where they can reach thicknesses of 300 meters (1000 feet)! Although much of this limestone is under the surface, limestone quarries throughout the area reveal the richness of the fauna.
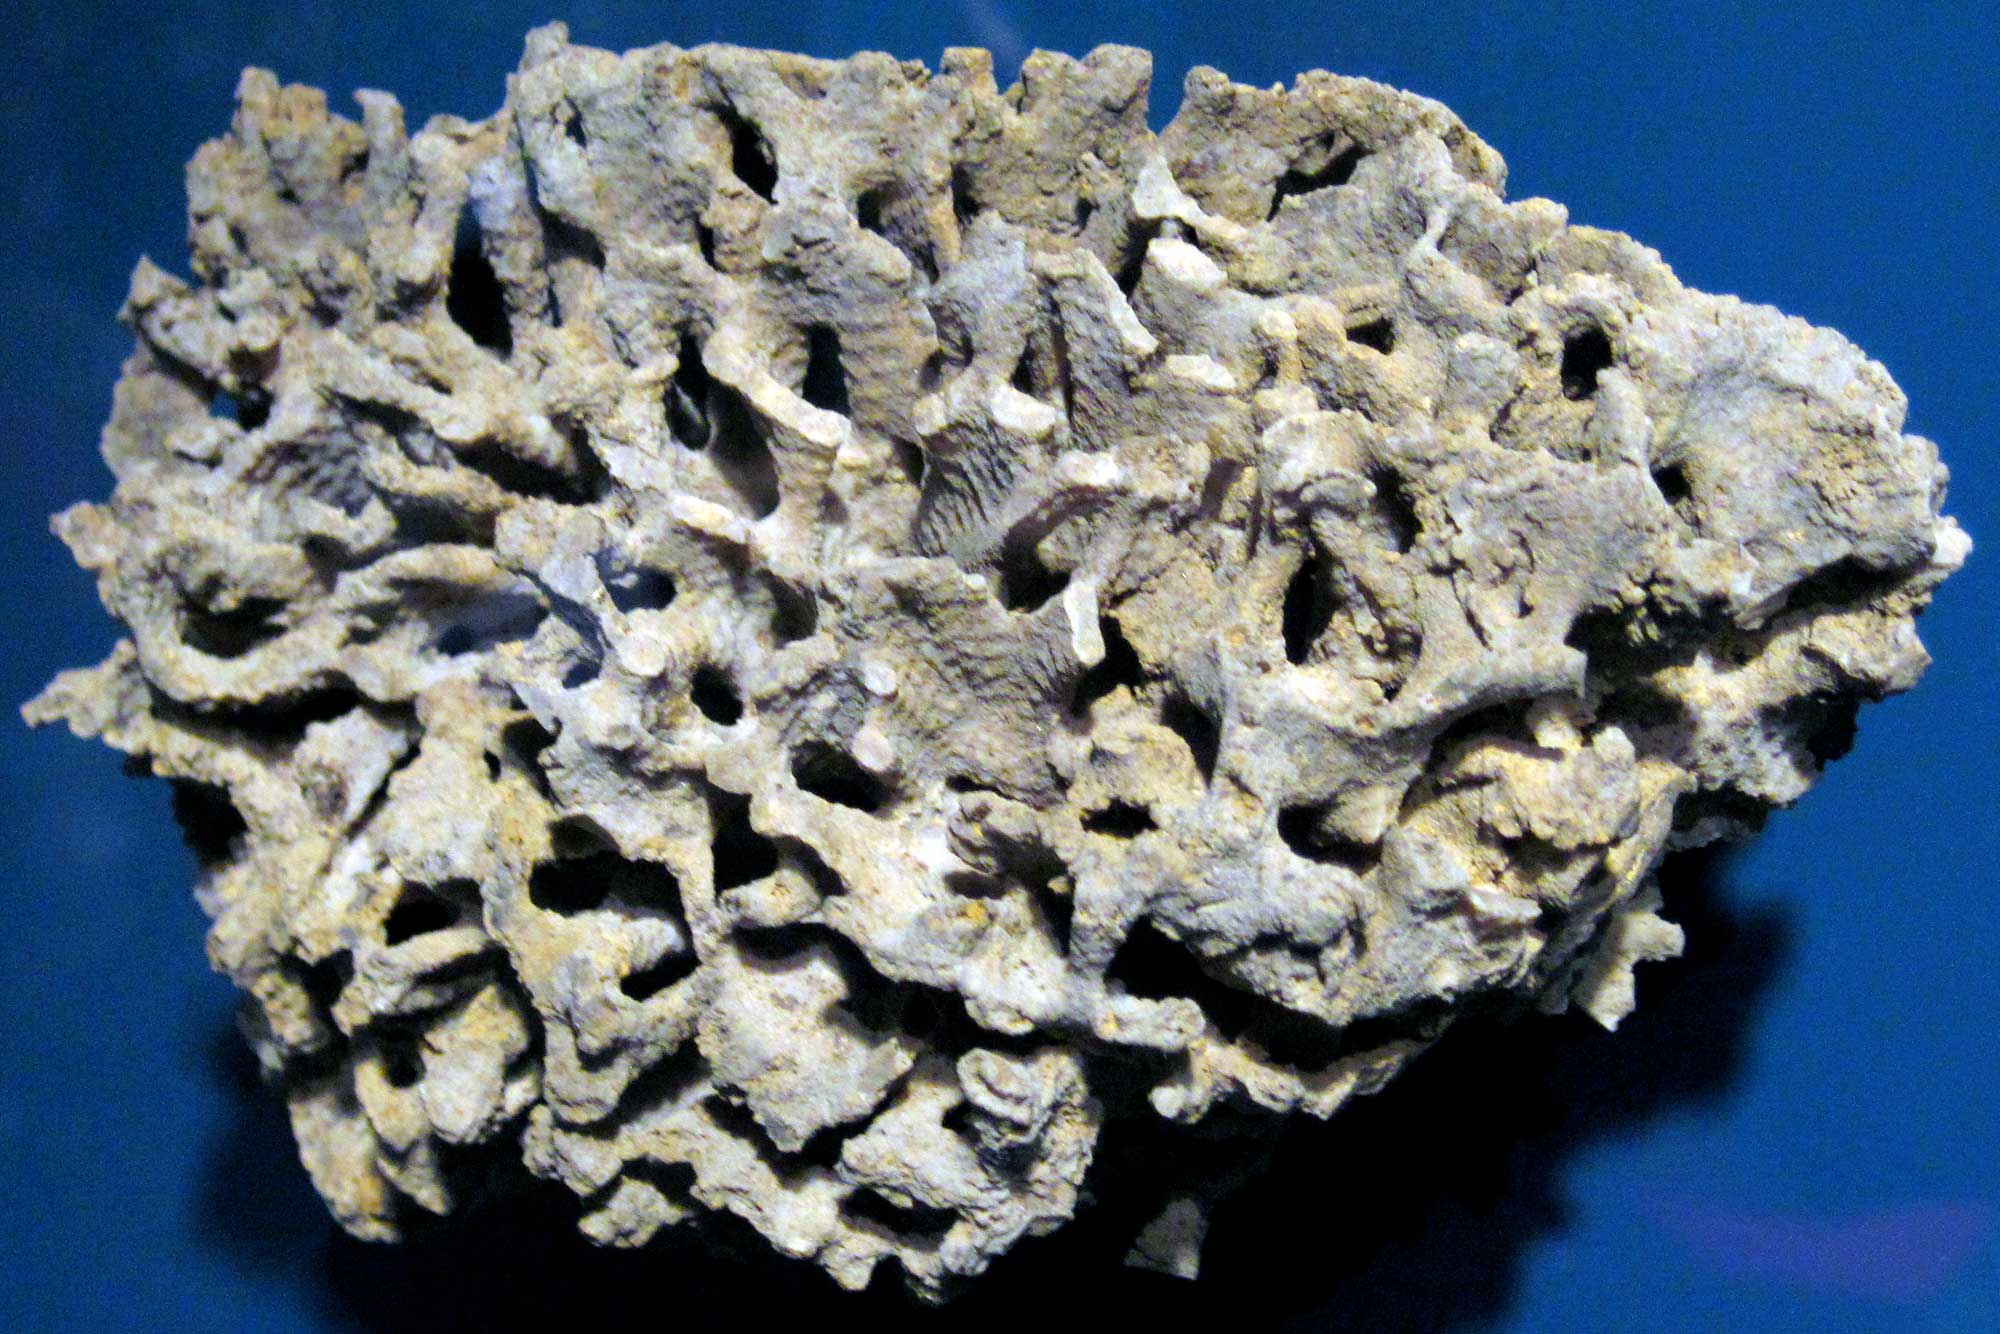
A bryozoan (Fistulipora neglecta), Silurian, Illinois. Photo by James St. John (flickr, Creative Commons 2.0 Generic license, image resized).
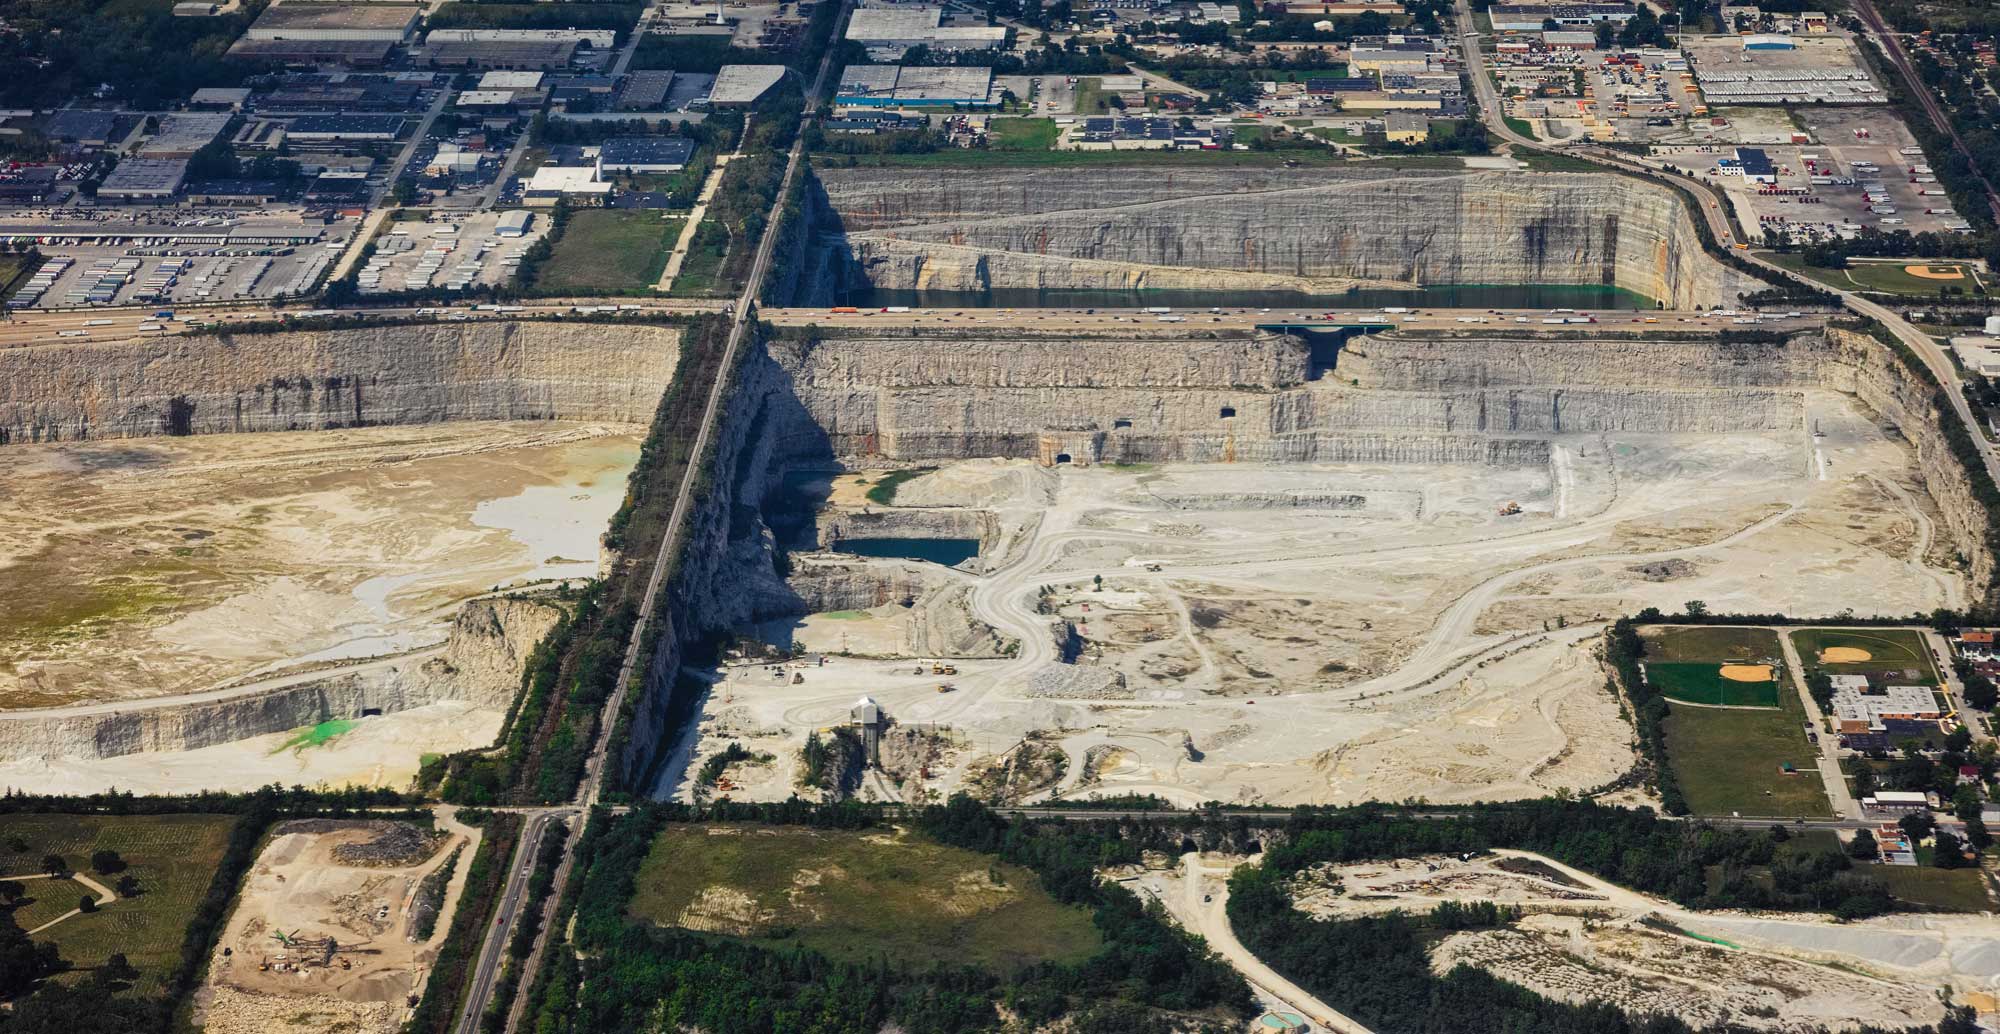
Aerial photo showing part of Thornton Quarry, northern Illinois, 2017. This quarry produces aggregates (crushed stone) from Silurian Niagara limestone. The quarry is said to measure about 2.4 kilometers (1.5 miles) by 0.8 kilometers (0.5 miles) in size. Photo by Sam LaRussa (flickr, Creative Commons Attribution 2.0 Generic license, image cropped and resized).
Silurian deposits of salt centered on Michigan indicate that the North American climate experienced little precipitation during the warm period beginning 430 million years ago. Eventually, the salinity in the shallow seas of the ancient Midwest returned to normal in the Devonian, and a rich and diverse fauna occupied the sea floor, including reefs and other habitats. At the end of the Devonian, however, the fauna suffered a mass extinction that eliminated many of the important reef-builders and other animals that occupied the shallow seas. The causes of this mass extinction, which actually occurred in a series of steps, are still uncertain.
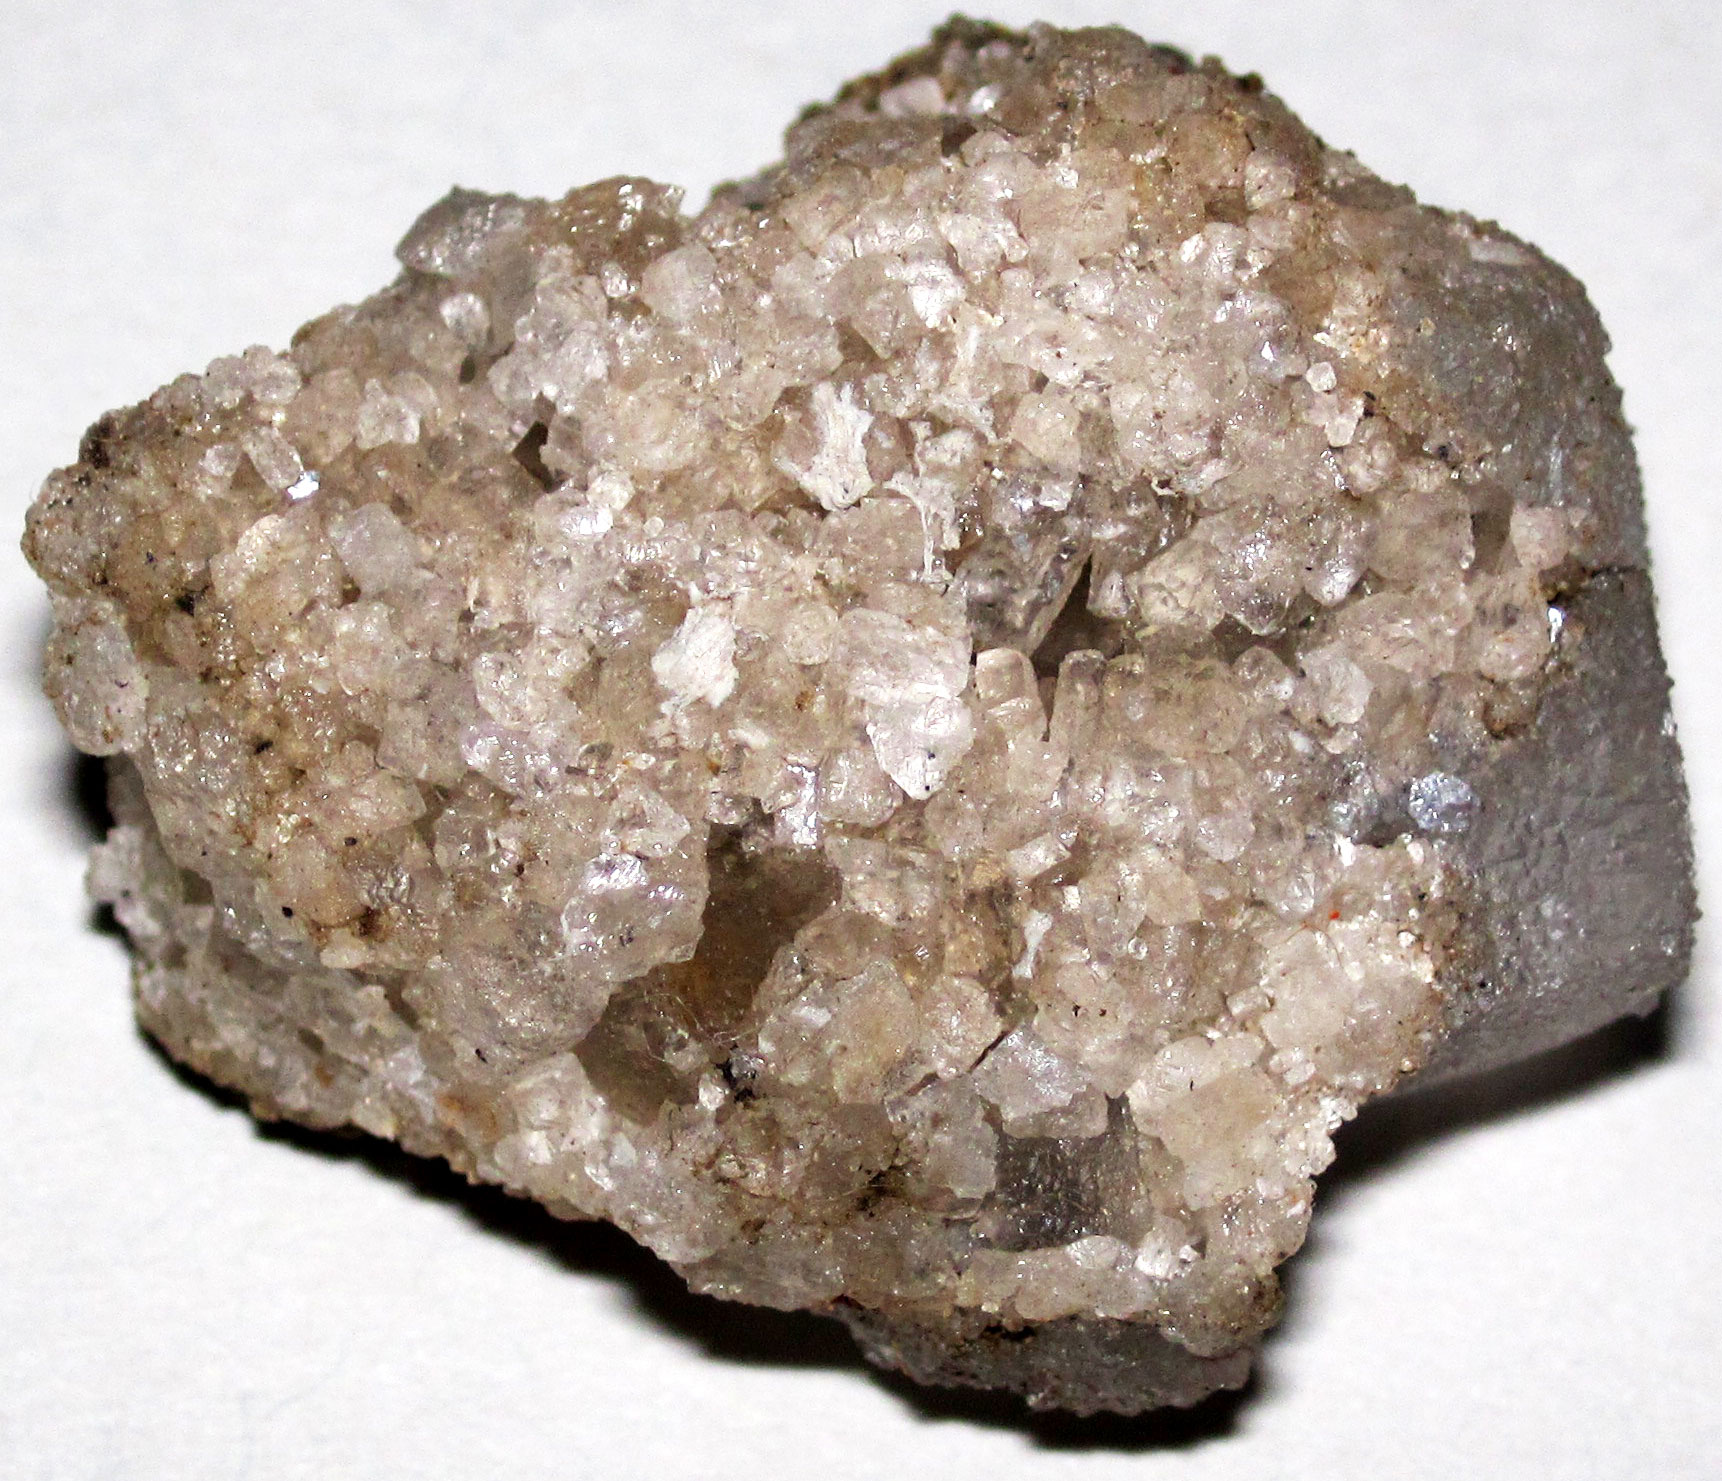
Silurian rock salt (halite) from the Detroit Salt Company, Michigan. Photo by James St. John (flickr, Creative Commons Attribution 2.0 Generic license, image cropped and resized).
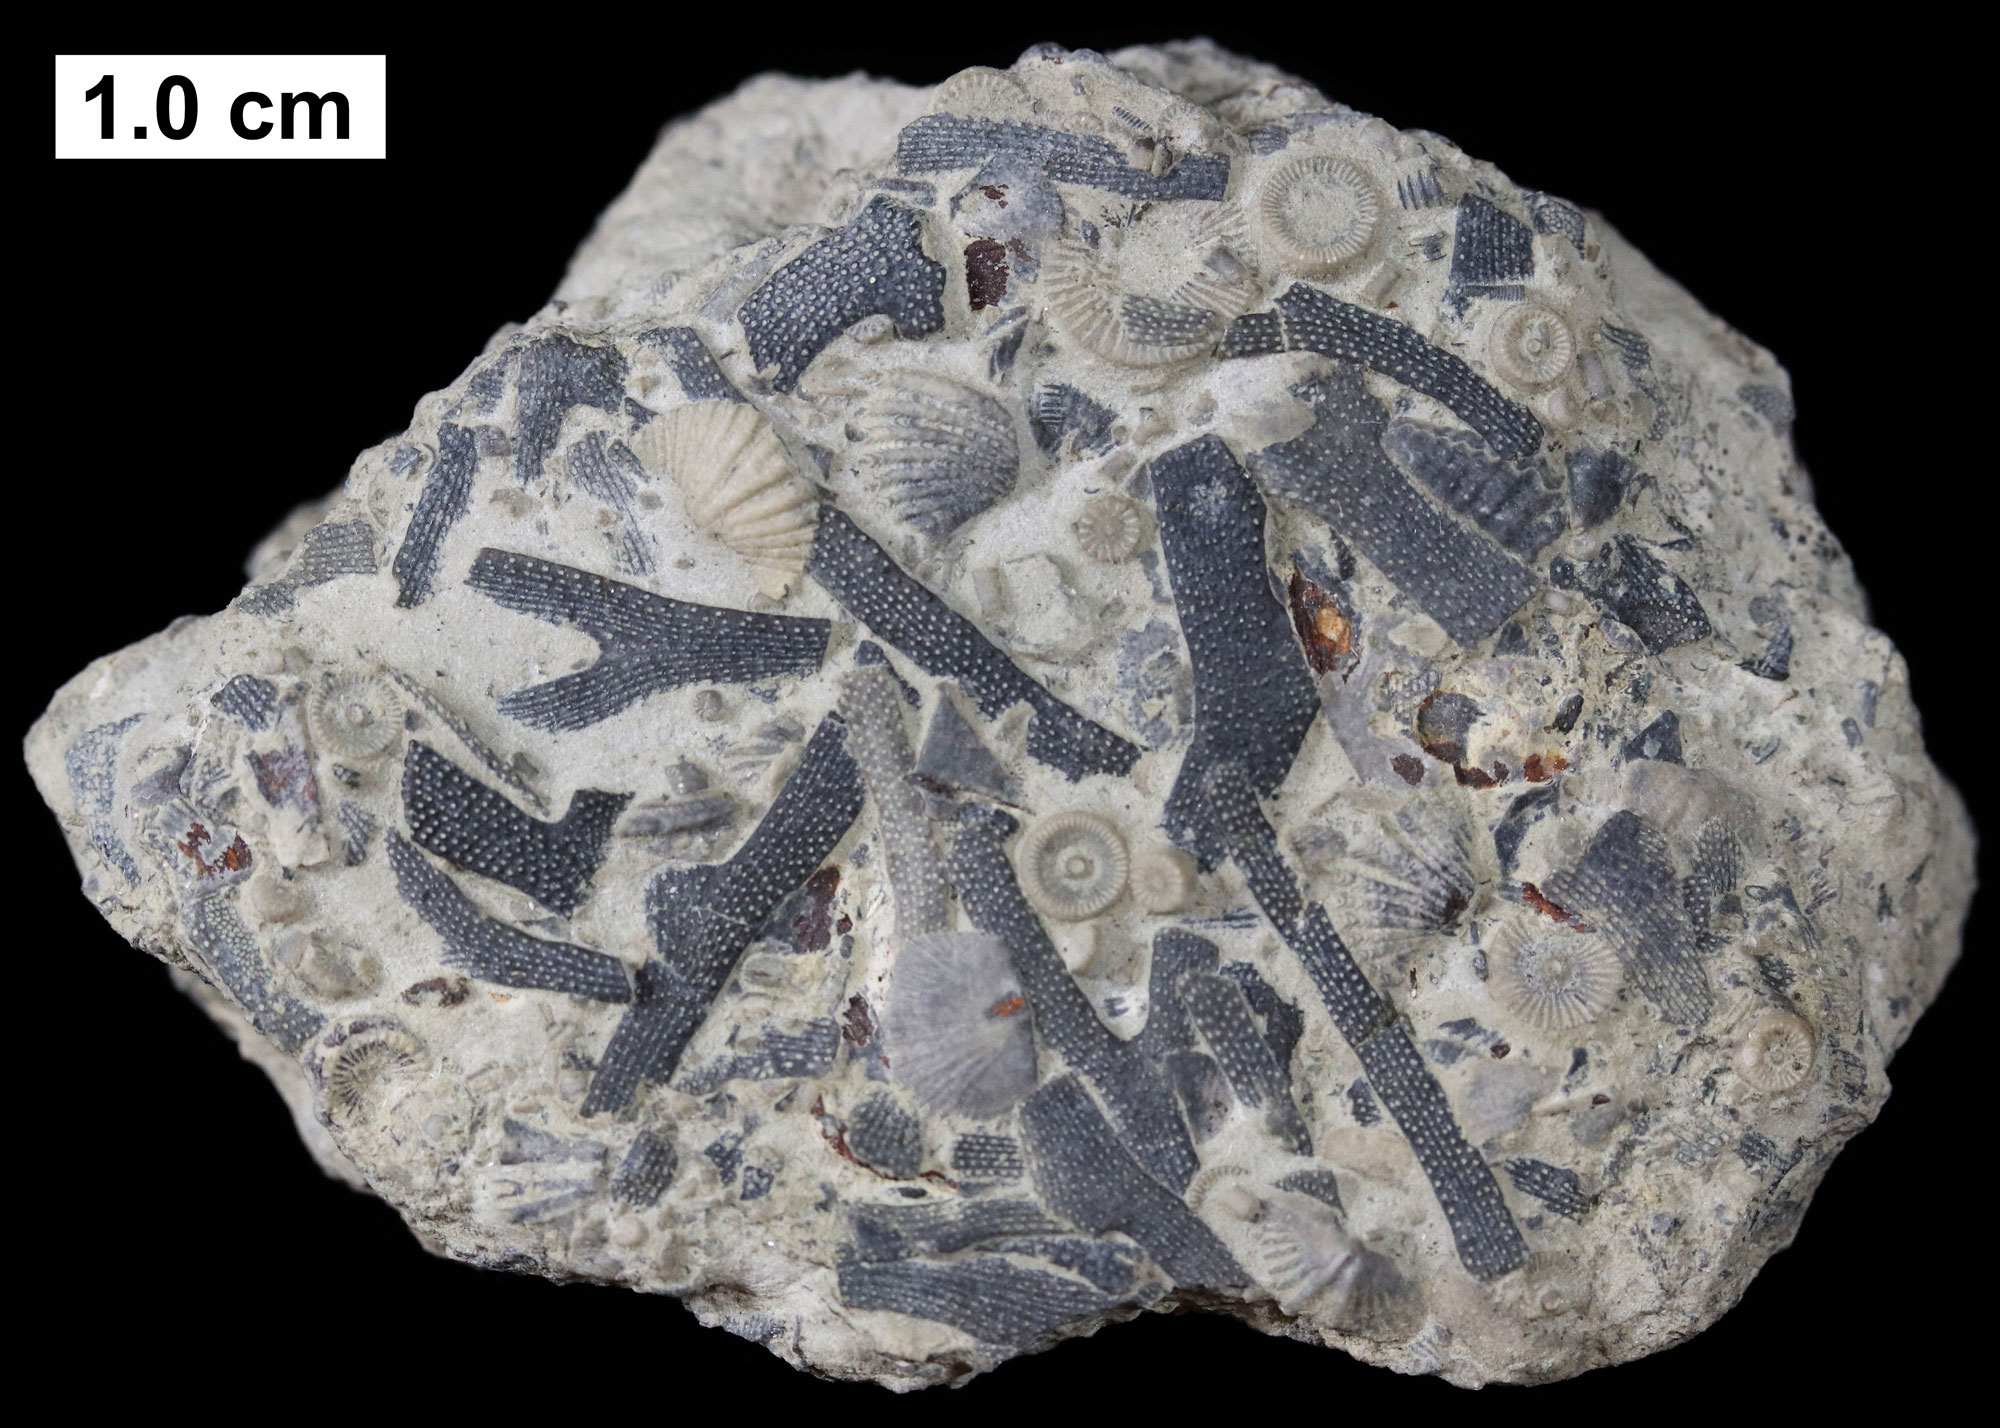
Bryozoans (Sulcoretepora) with brachiopods and crinoid columnals (stalk segments), Devonian Milwaukee Formation, Wisconsin. Photo by Kennethcgass (Wikimedia Commons, Creative Commons Attribution-ShareAlike 4.0 International license, image resized).
Carboniferous to Permian (359 to 252 million years ago)
As the continent continued across the Tropic of Capricorn and the Equator, the cycle of warming and cooling repeated yet again. By 360 million years ago, glaciers formed near the South Pole. Although the Earth’s temperature was falling during this time, the Midwest remained relatively warm.
Shallow, tropical seas continued to cover most of the Midwest until sea level dropped in the middle of the Carboniferous. By this time, complex land plants had evolved and diversified; these plants rapidly colonized the newly exposed landscape. Terrestrial fossils from this time show that the climate was humid and supported swamp forests. These swamps eventually became the coal deposits of the southern Midwest, especially in southern Illinois, Indiana, and Ohio. Farther north, the land was exposed and no rock record exists. It is likely that the area was traversed by rivers.
The ice age that had started near the end of the Devonian around 360 million years ago intensified during the later part of the Carboniferous. Deposits in the southern part of the Midwest, in particular, show a cyclicity of rising and falling sea level that was caused by advance and retreat of the large ice cap in the Southern Hemisphere. This ice age lasted well into the Permian period, ending about 260 million years ago, when warm temperatures again became the norm.
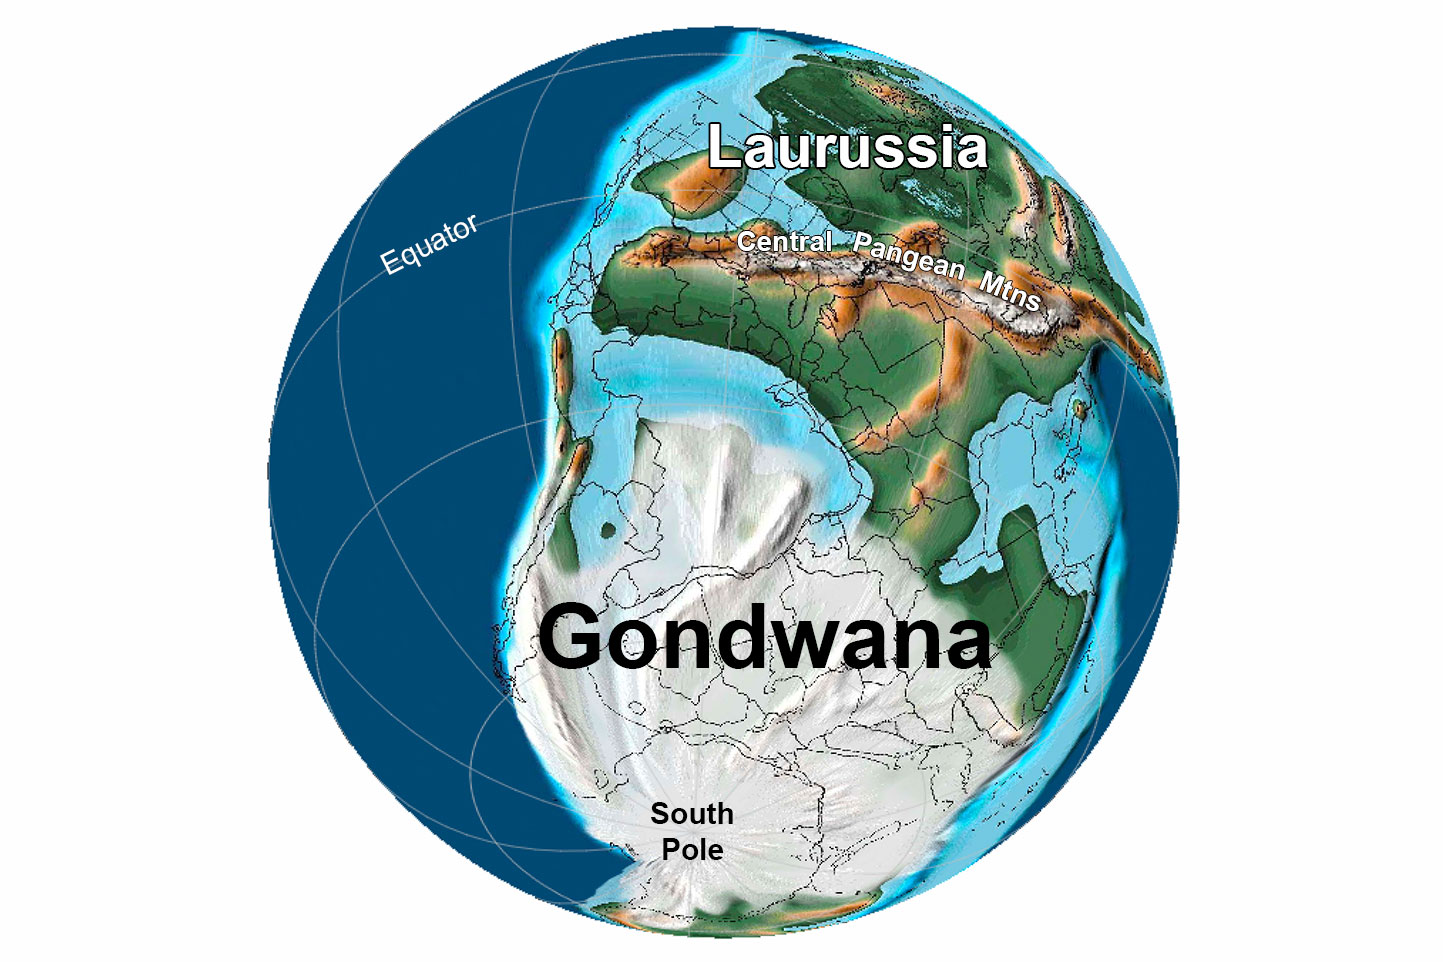
Earth 300 million years ago, during the end of the Carboniferous Period (Pennsylvanian). Pangaea was completed when North America finally collided with Gondwana. Reconstruction created using basemap from the PALEOMAP PaleoAtlas for GPlates and the PaleoData Plotter Program, PALEOMAP Project by C. R. Scotese (2016); map annotations by Jonathan R. Hendricks & Elizabeth J. Hermsen for PRI's Earth@Home project (CC BY-NC-SA 4.0 license).
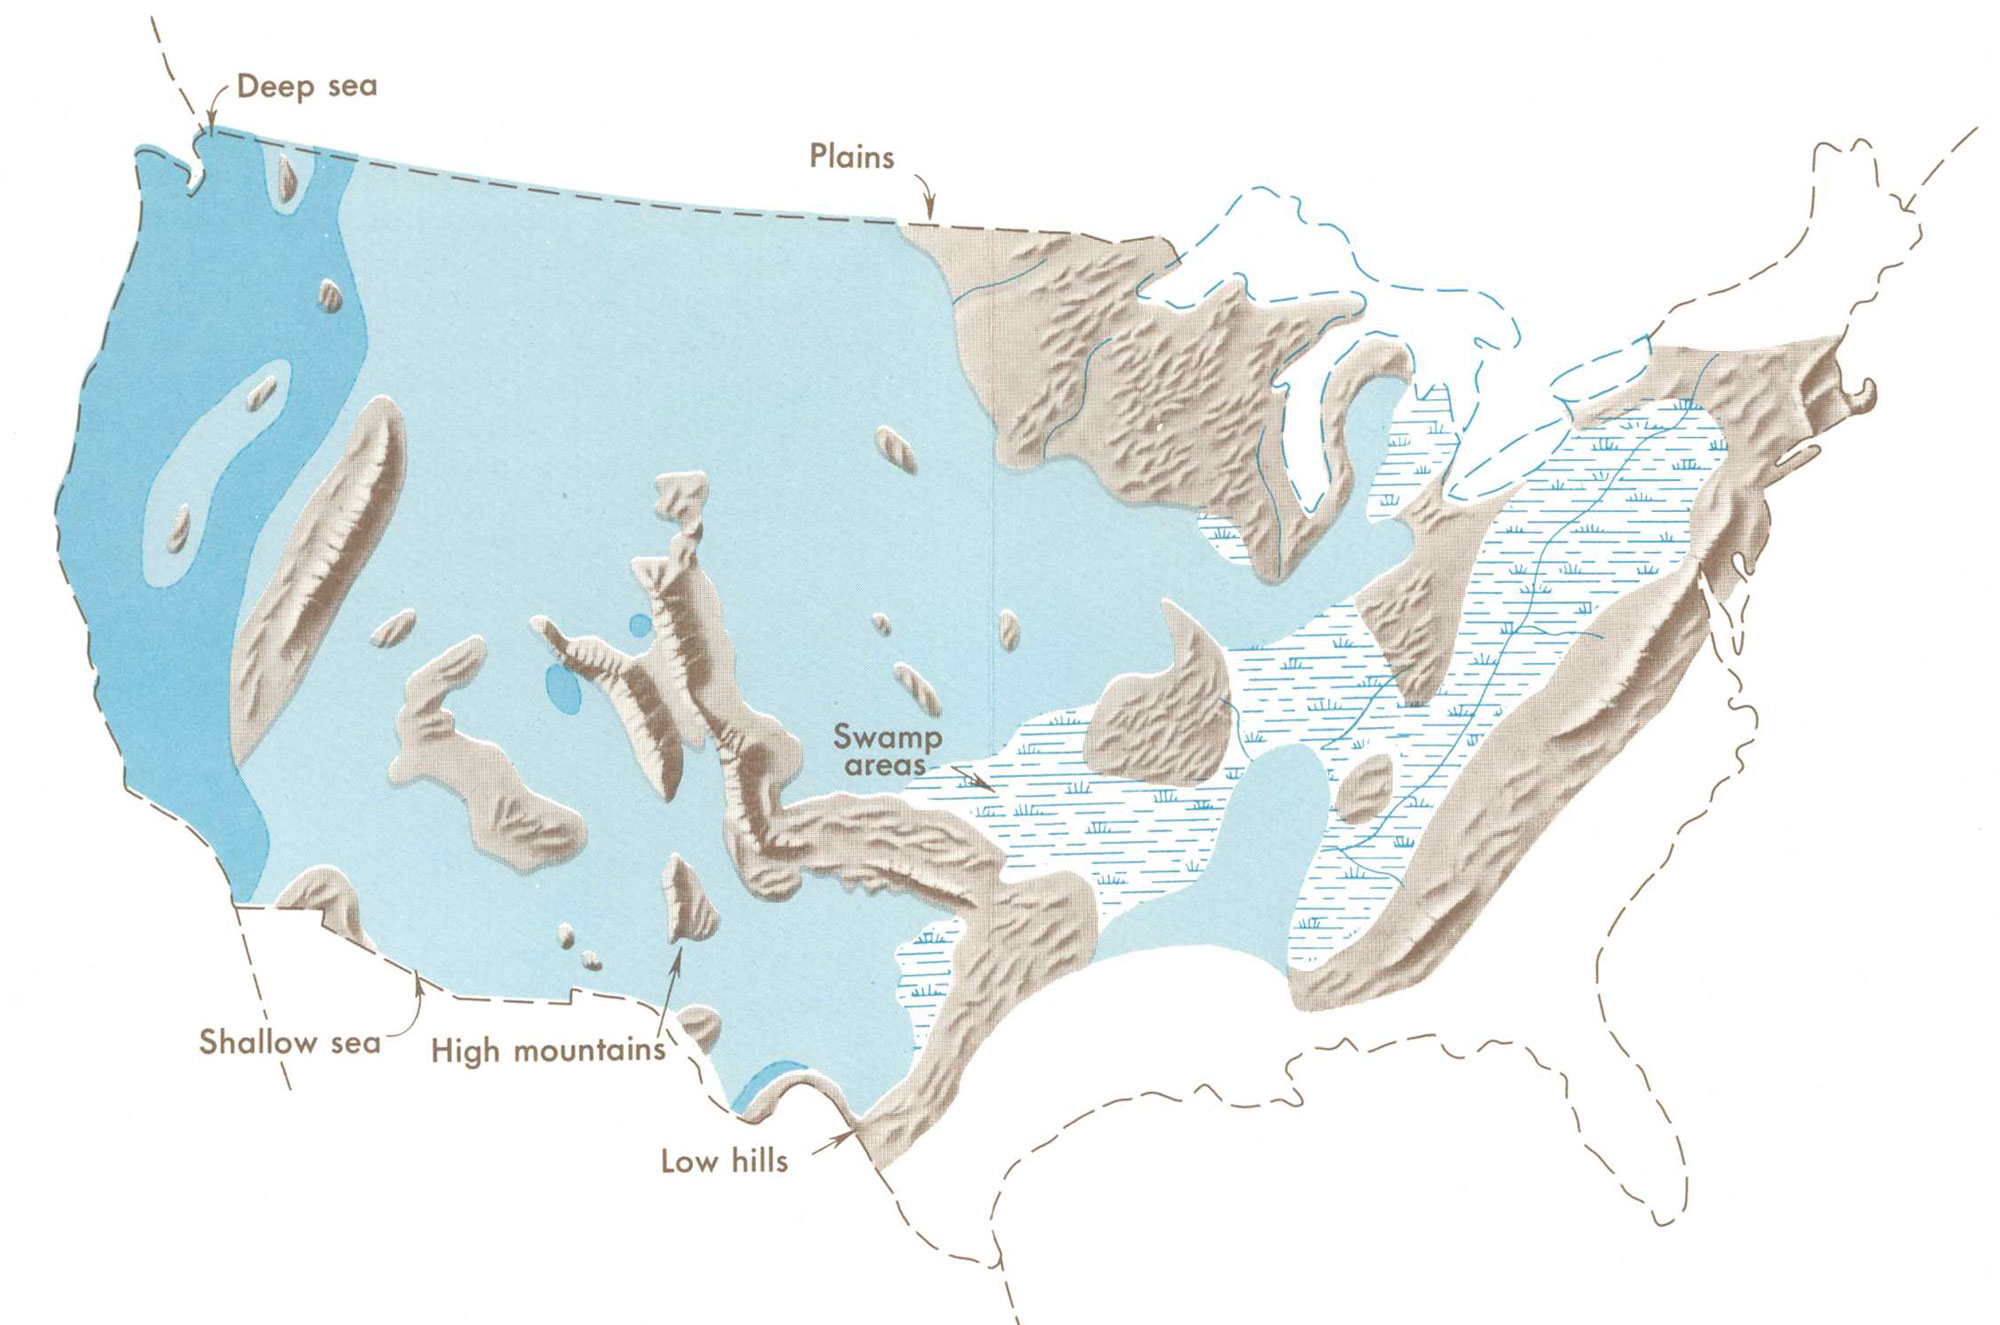
Distribution of Pennsylvanian swamps and highland areas relative to the outline of the modern United States. Map from Our changing continent, USGS Monograph, published 1969.
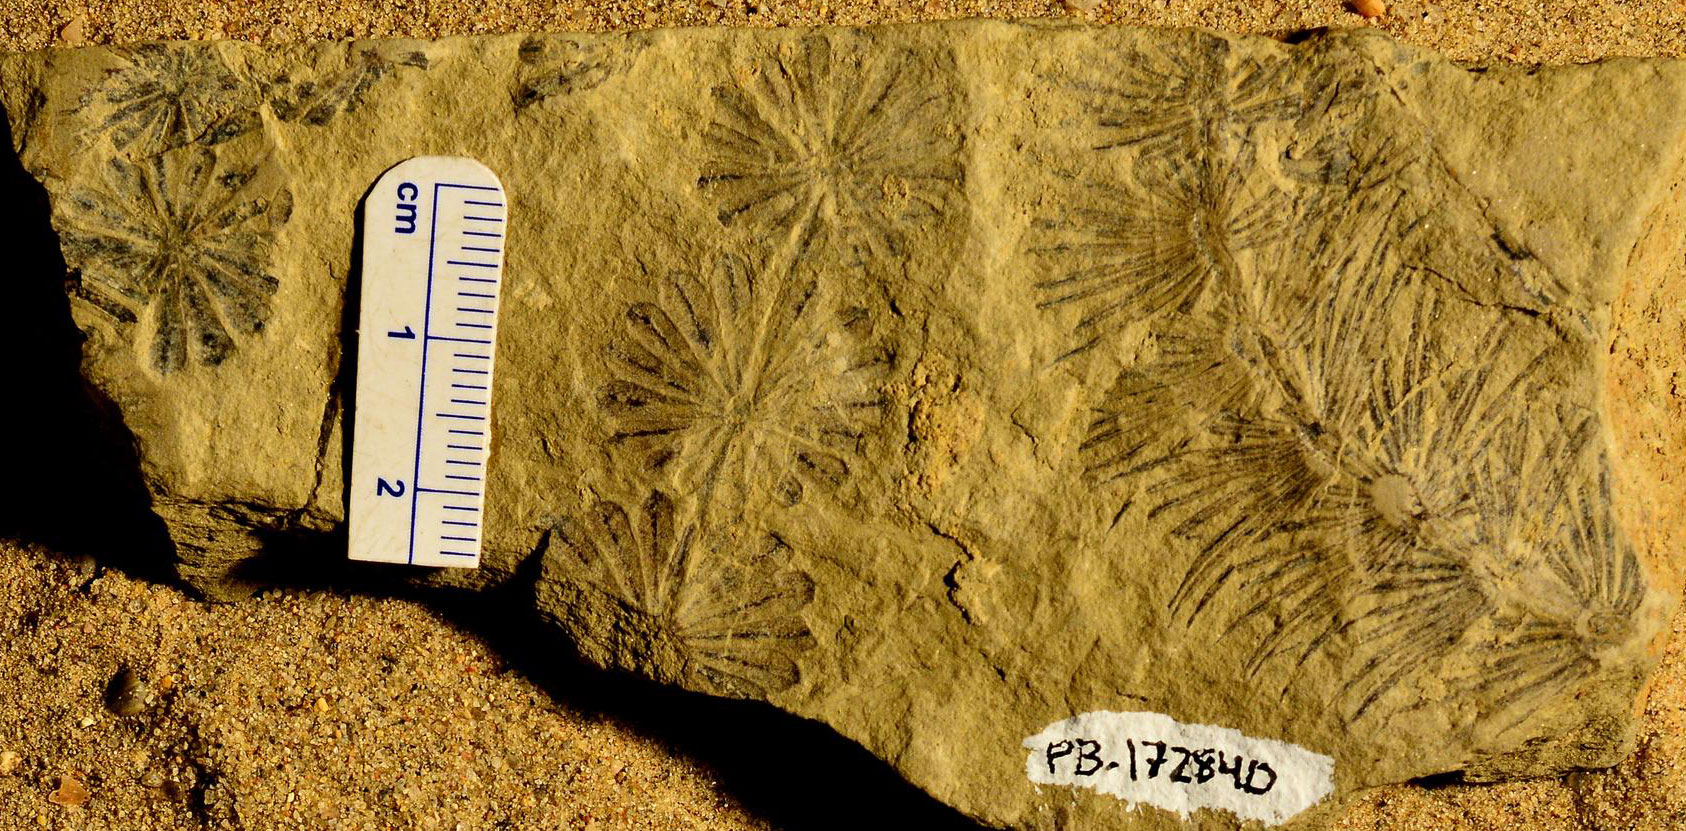
Foliage of ancient sphenophyte trees (Annularia and Asterophyllites), Pennsylvanian Allegheny Formation, Muskingum County, Ohio. Photo of YPM PB 172840 by Fiona O'Brien (Yale Peabody Museum of Natural History/YPM on GBIF.org, CC0 1.0 Universal/public domain dedication).
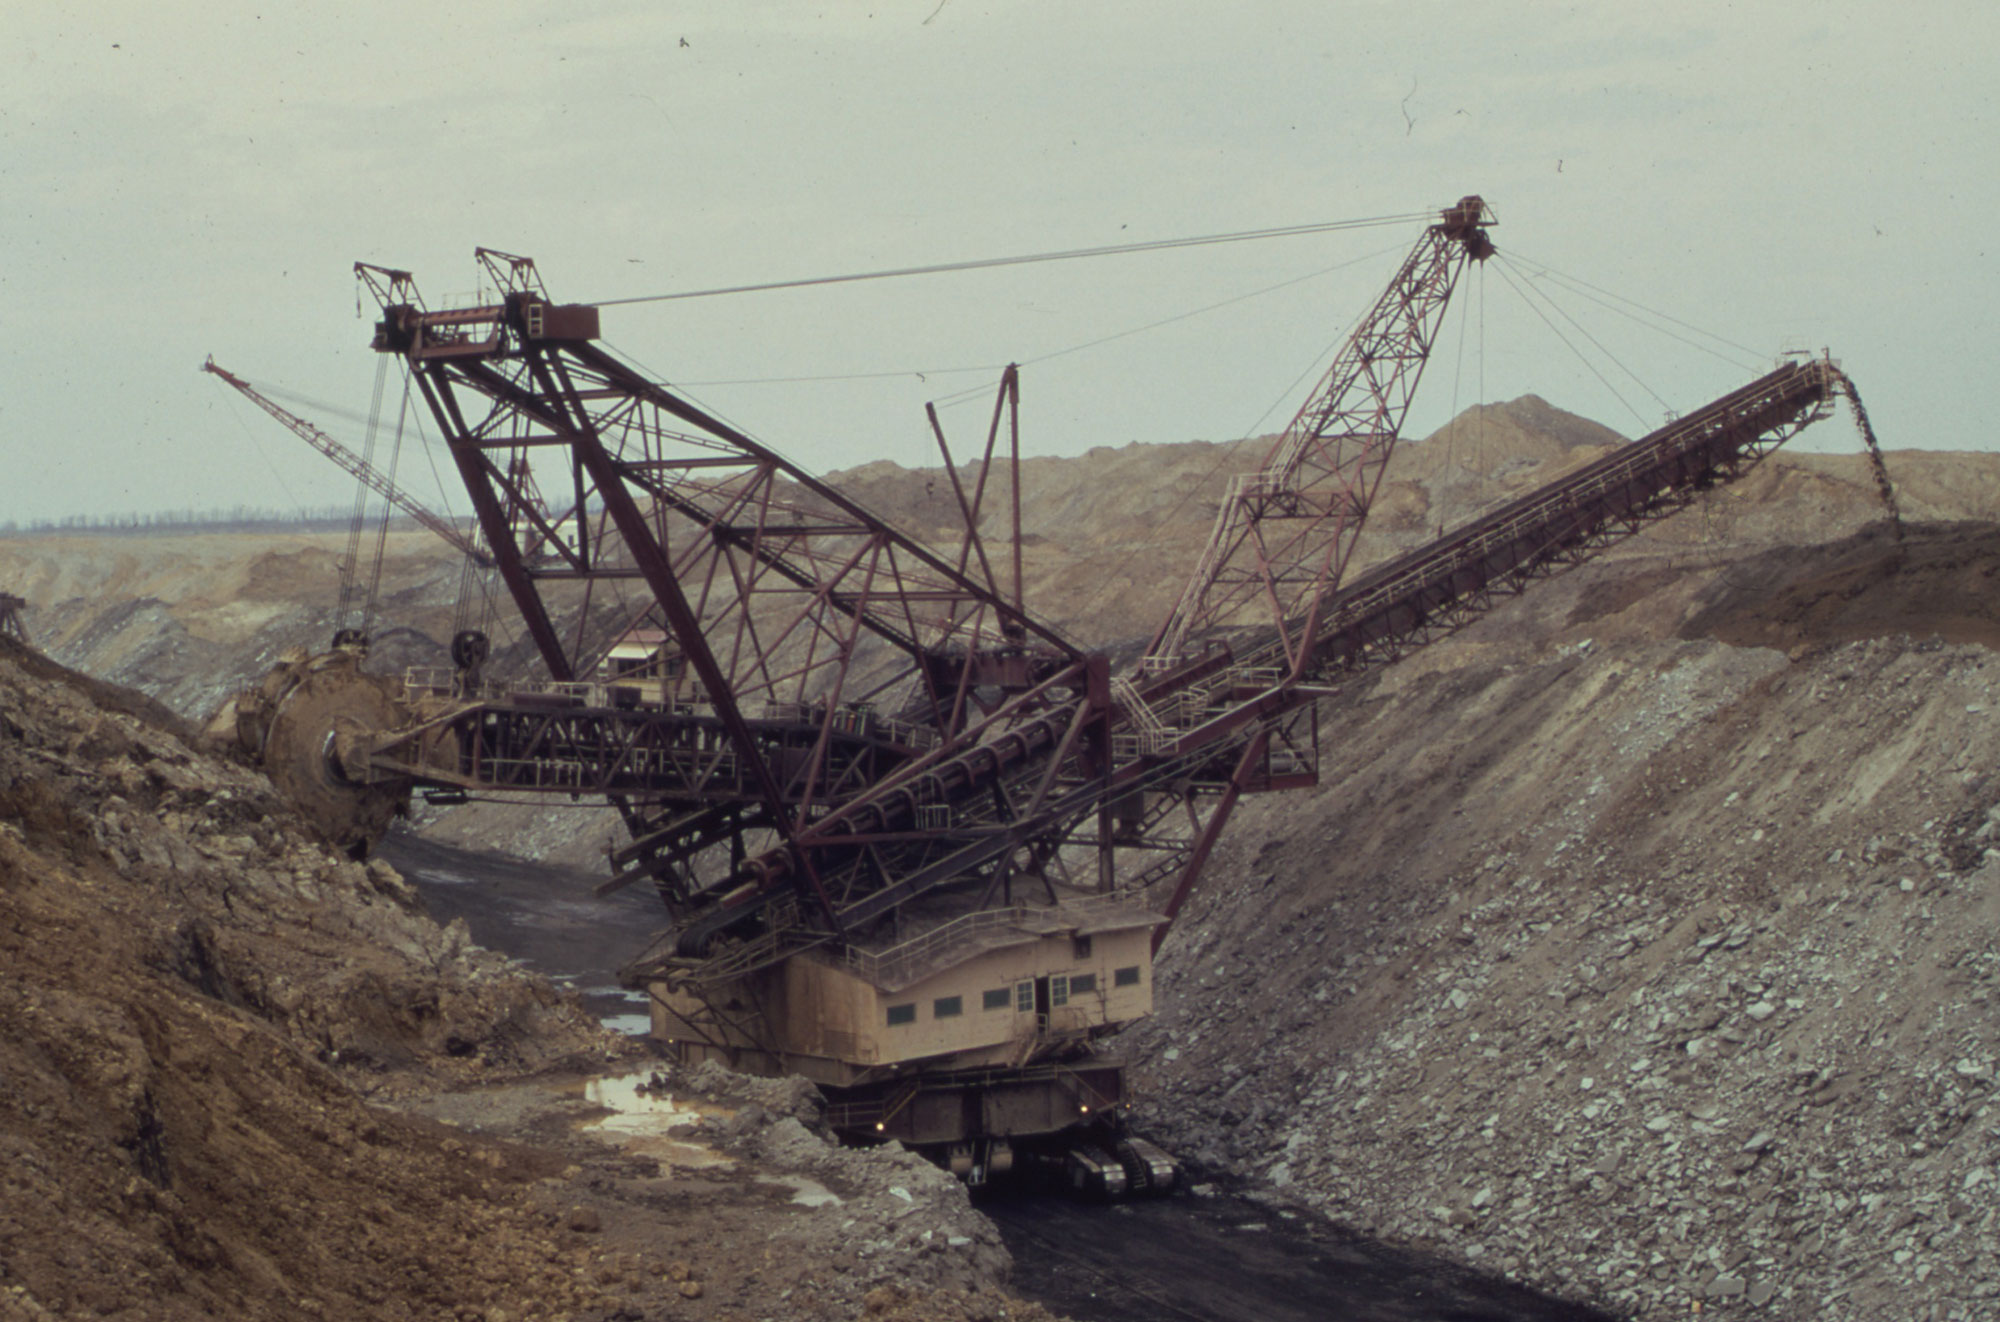
Strip mining coal, Fulton County, Illinois, 1973. Photo by Arthur Greenburg (EPA, National Archives and Records Administration, via Wikimedia Commons, public domain).
Mesozoic (252 to 66 million years ago)
By the beginning of the Mesozoic, tectonic forces had by then pushed the Midwest above sea level, and erosional forces tended to dominate, so little direct evidence of the climate during this time is preserved. Evidence from adjacent regions indicates that climate in the Midwest was probably very warm and relatively arid.
Worldwide temperatures began to dip again around 150 million years ago, though perhaps not enough for ice sheets to form. The tropics, presumably including the Midwest, became more humid. Pangaea, a supercontinent composed of nearly all the landmass on Earth, broke up into continents that would drift into increasingly familiar positions. By the Cretaceous, the world was heating up again. A new body of water, the Western Interior Seaway, covered parts of North America, leaving fossils of tropical marine animals in Iowa and Minnesota.
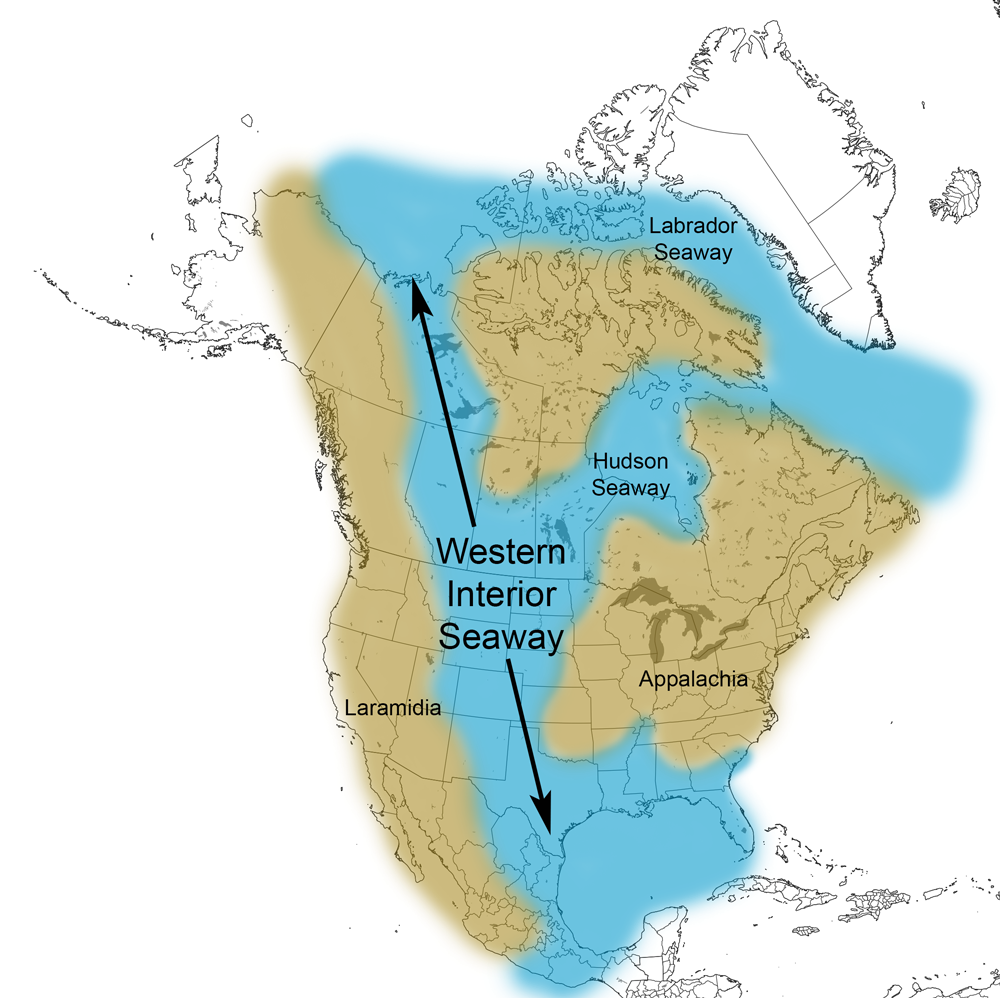
Extent of the Western Interior Seaway during the Cretaceous Period. Image from Cretaceous Atlas of Ancient Life: Western Interior Seaway (Creative Commons Attribution-NonCommercial-ShareAlike 4.0 International license).
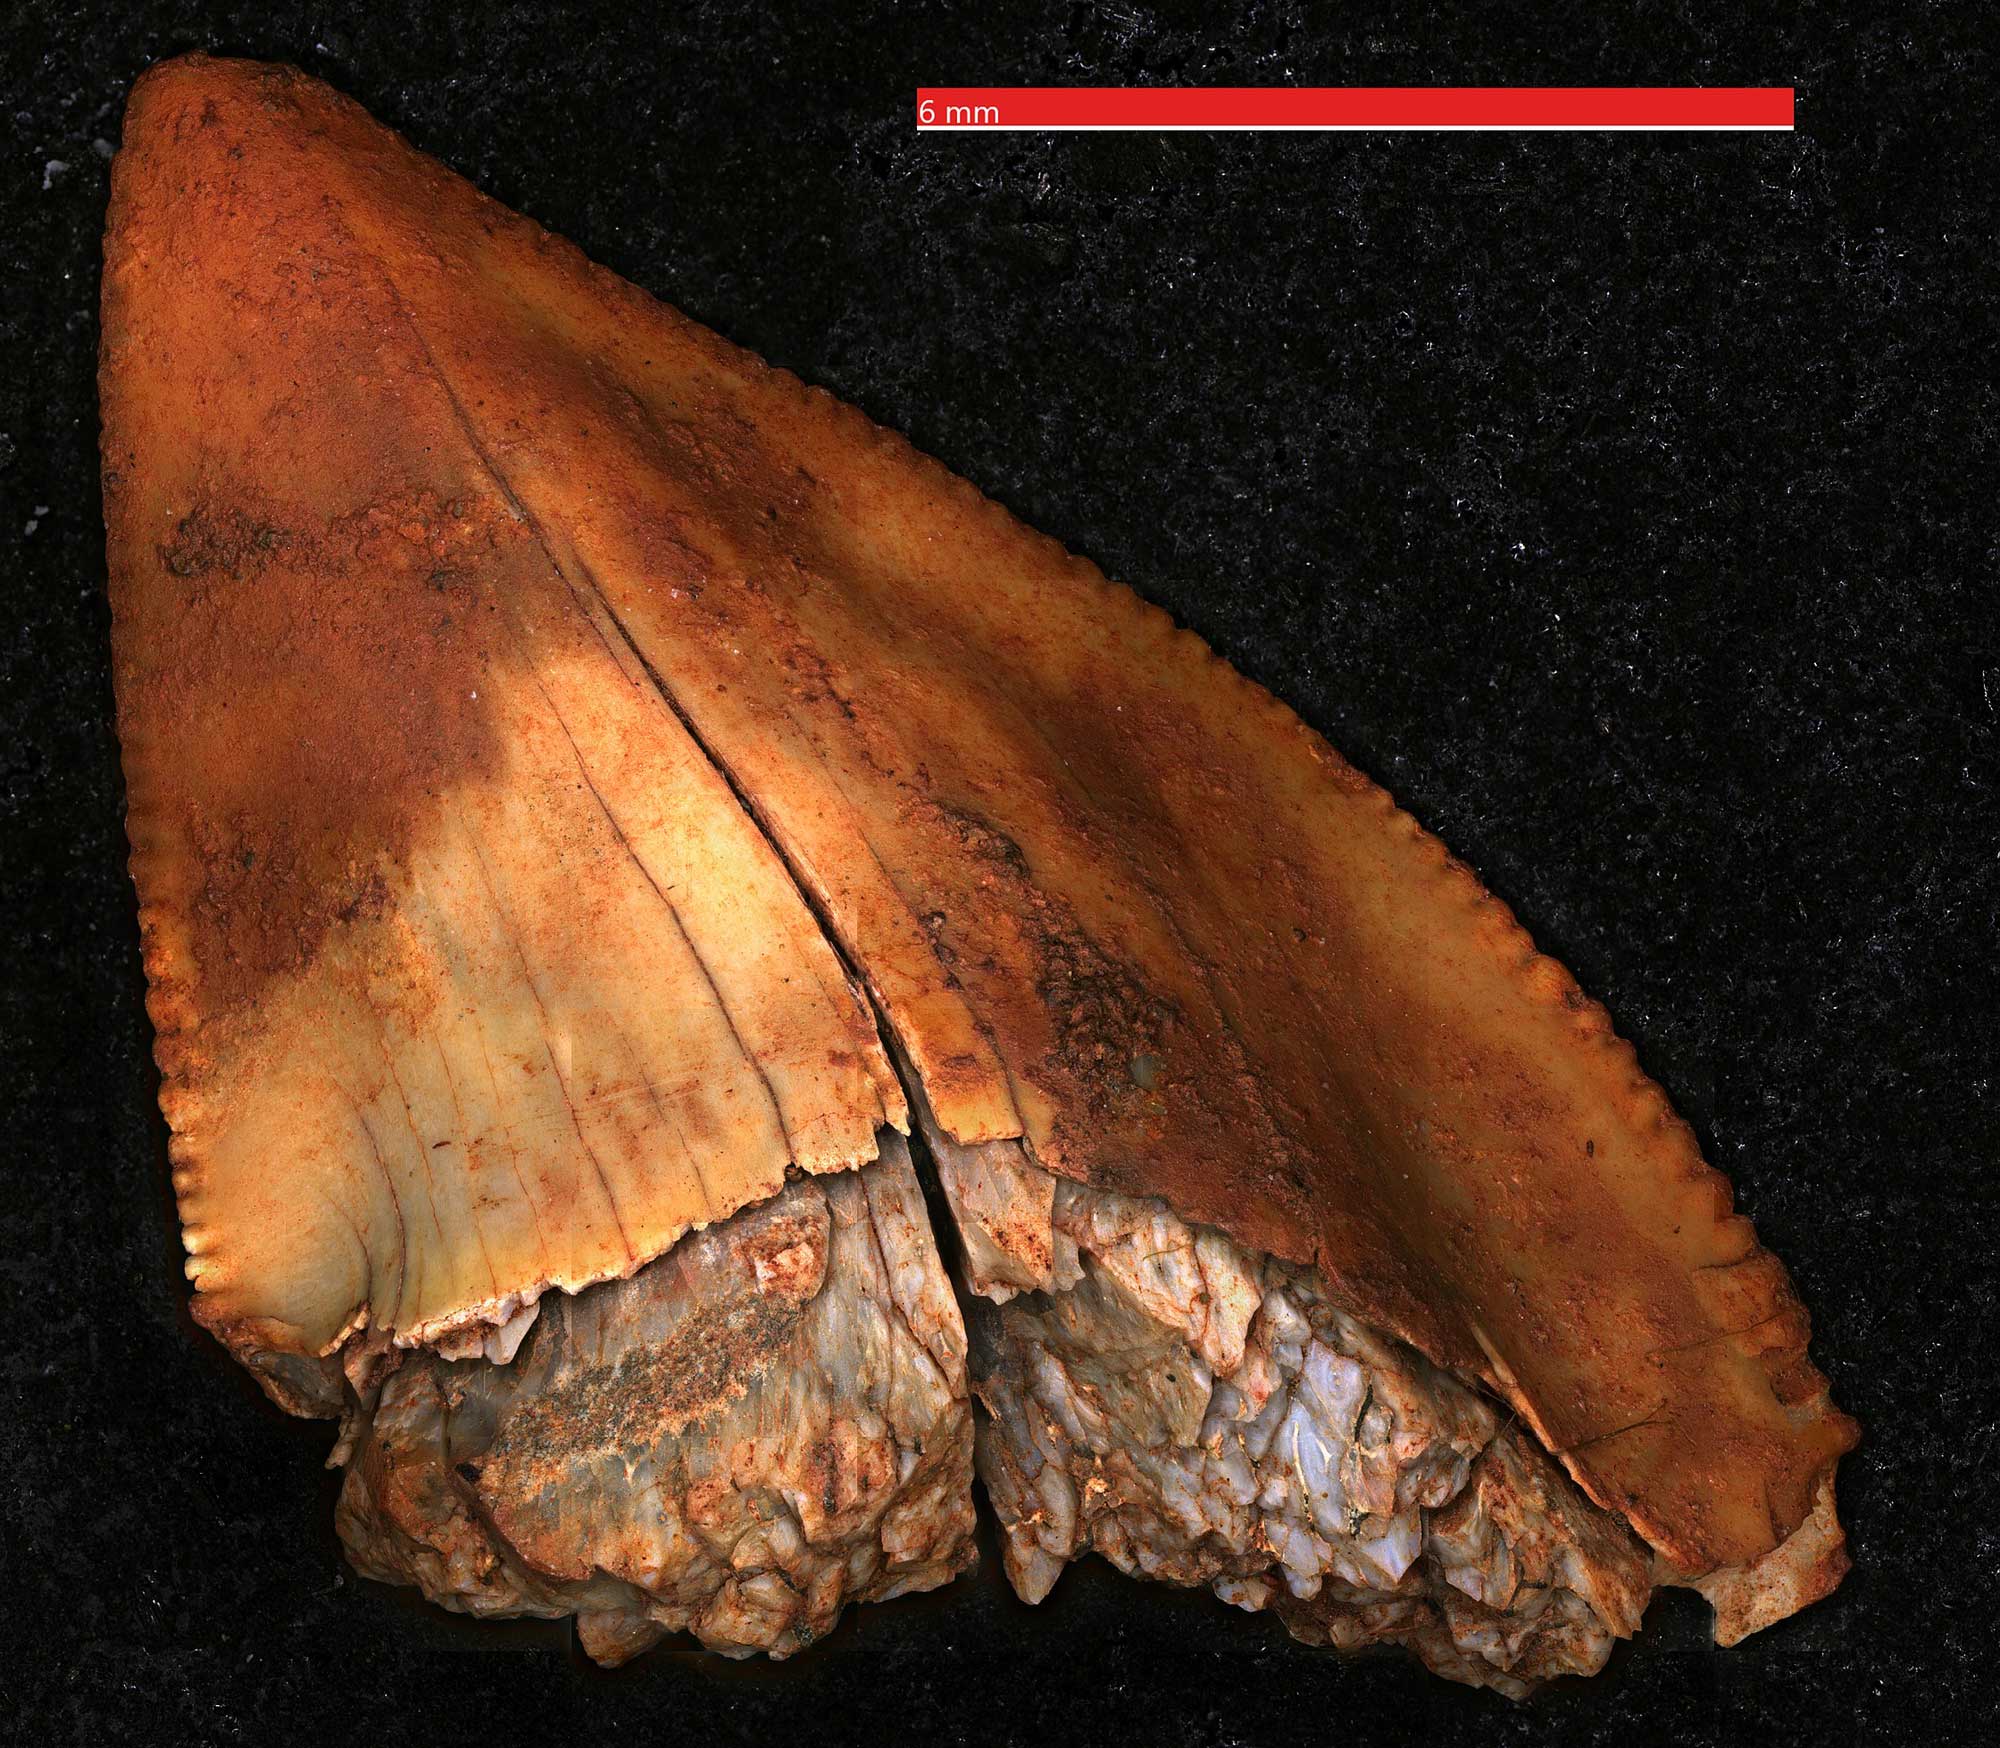
Crow shark tooth (Squalicorax), Late Cretaceous Coleraine Formation, Calumet, Minnesota. Photo by Rylan Bachman (Wikimedia Commons, Creative Commons Attribution 4.0 International license, image resized).
At the very end of the Cretaceous, the Gulf Coast experienced an enormous disruption when an asteroid or comet collided with Earth in what is now the northern Yucatán Peninsula in Mexico. The impact vaporized both water and rock, blocking out sunlight for weeks to years, leading to a collapse of photosynthesis and food webs on land and in the oceans. After this event, the climate may have cooled briefly, but it soon rebounded to a warmer state.
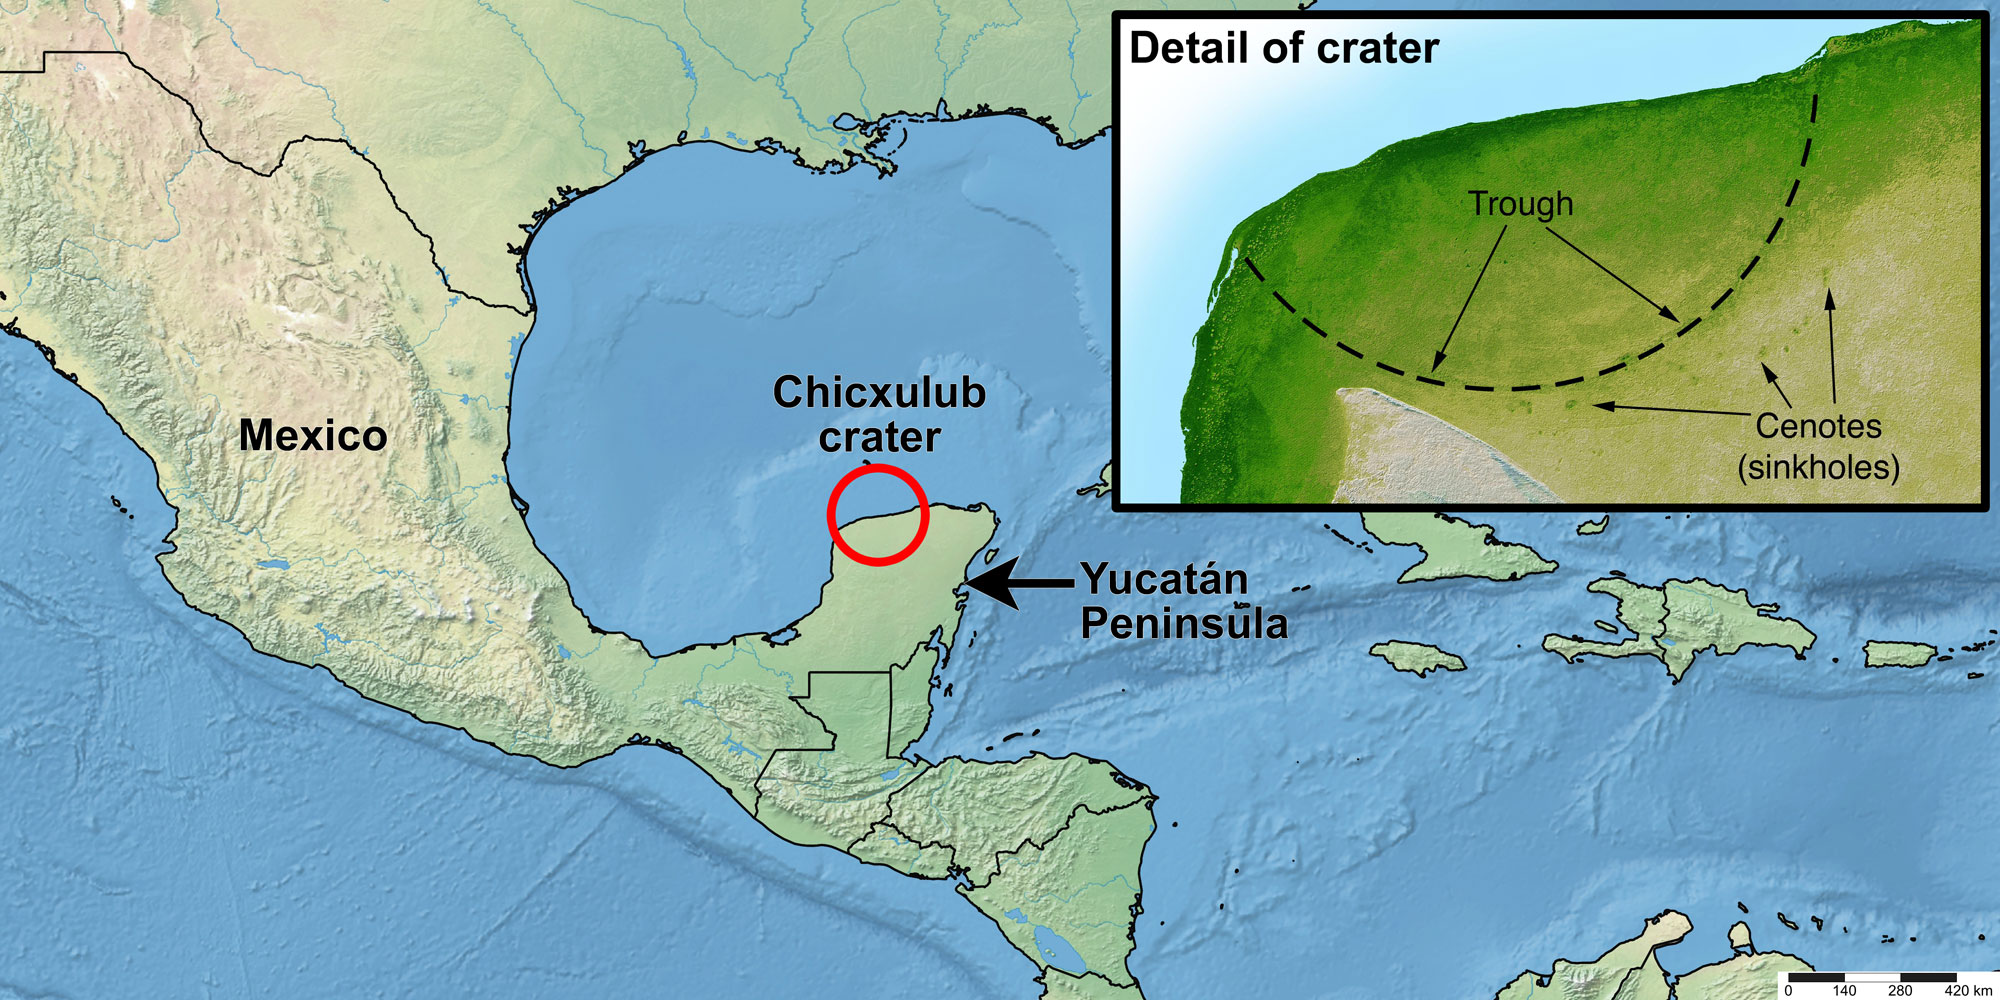
Map of the modern Yucatán Peninsula region showing the location of the Chicxulub impact crater. The inset image is a shaded relief image that shows the edge of the crater on the Yucatán Peninsula with sinkholes in the rock surrounding it. Map made by Elizabeth J. Hermsen using Simplemappr and modified in Photoshop. Inset image from the NASA Jet Propulsion Laboratory (PIA03397).
Cenozoic (66 million years ago to present)
Paleogene to Neogene (66 to 2.6 million years ago)
With the end of the Cretaceous and the extinction of the dinosaurs 65 million years ago, the world was cooling again. Antarctica moved south, and by 30 million years ago temperatures were low enough that glaciers were growing on its mountains. About 15 million years ago, ice covered much of that continent and had begun to form on Greenland. Eventually, by about 2 million years ago, a sheet of sea-ice formed over the Arctic, and other sheets spread over northern Asia, Europe, and North America and then pushed their way south. This is where the geologic record of climate in the Midwest picks up again.
Quaternary (2.6 million years ago to present)
Eventually, a sheet of sea ice formed over the Arctic, and ice sheets spread over northern Asia, Europe, and North America, signaling the start of the most recent ice age. Since 800,000 years ago, an equilibrium has been reached between warming and cooling, with the ice caps growing and retreating primarily due to the influence of astronomical forces (i.e., the combined gravitational effects of the Earth, Sun, moon, and planets). The ice sheets in the Northern Hemisphere covered much of the Midwest.
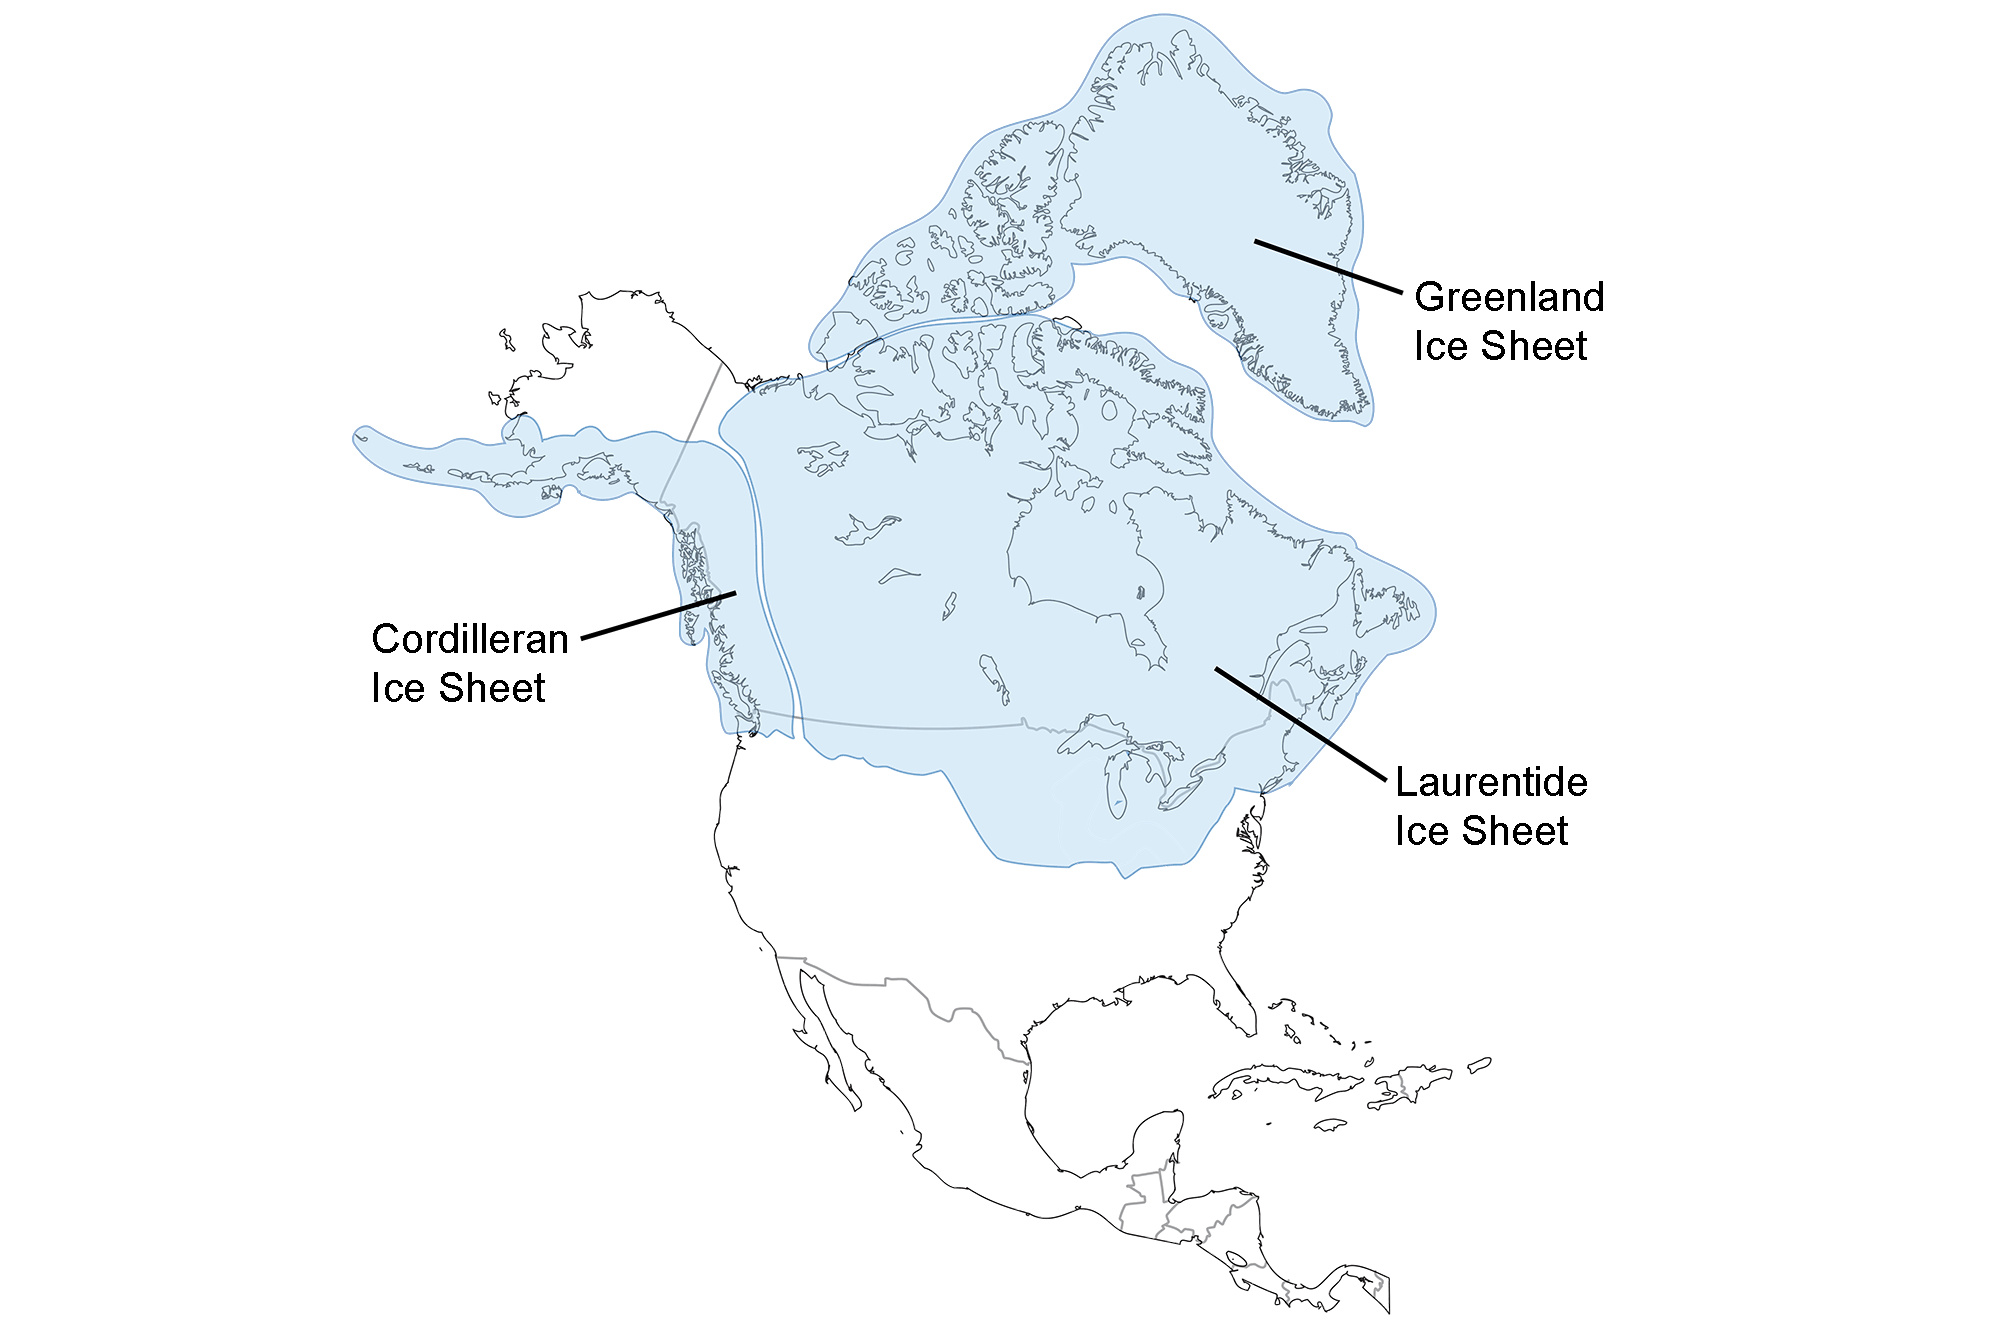
Extent of glaciation over North America at the Last Glacial Maximum. Image adapted from map by the USGS (public domain).
During the ice’s maximum extent, it reached from the North Pole to where Chicago is now located, covering the northern half of the Midwest. The southern half of the Midwest was far colder than it is today. The temperatures in areas not covered in ice were moderated by the presence of ice. While the summers were much cooler, the winters were only a little cooler than they are today. The region was also somewhat wetter than it is today, with wetlands and forests covering much of what would later become grassland.
The glaciers last retreated from the Midwest around 10,000 years ago, leaving behind the Great Lakes and many geologic features that define the landscape of the Upper Midwest today, including eskers, kettles, and thick deposits of sand and gravel. The climate grew warmer and slightly drier, much like that we experience today.
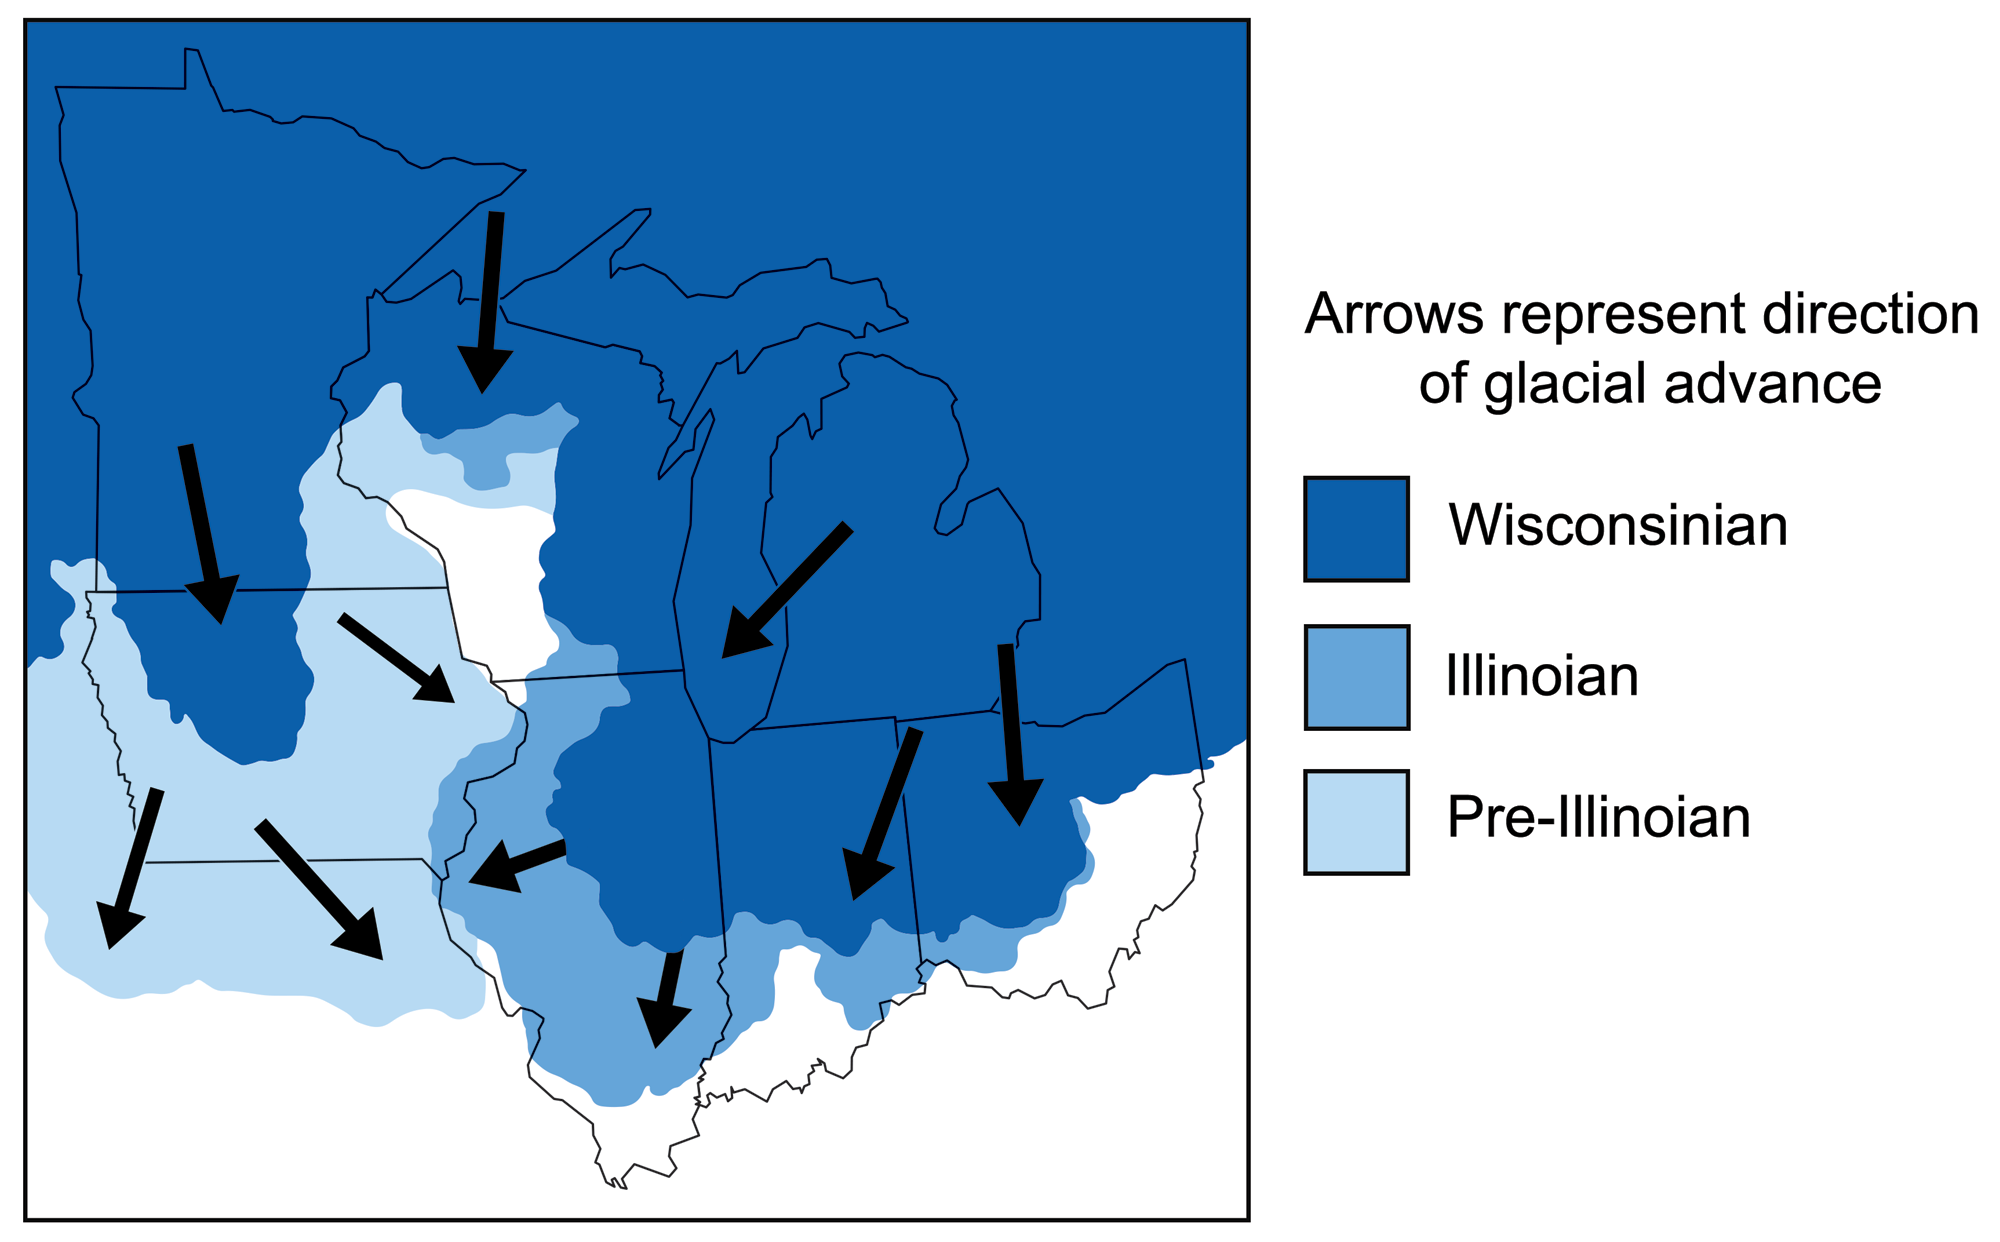
Map of the midwestern states showing Pleistocene glaciations. Each glacial advance differed slightly and left different sets of deposits. Adapted from figures by C.L. Matsch and USGS.
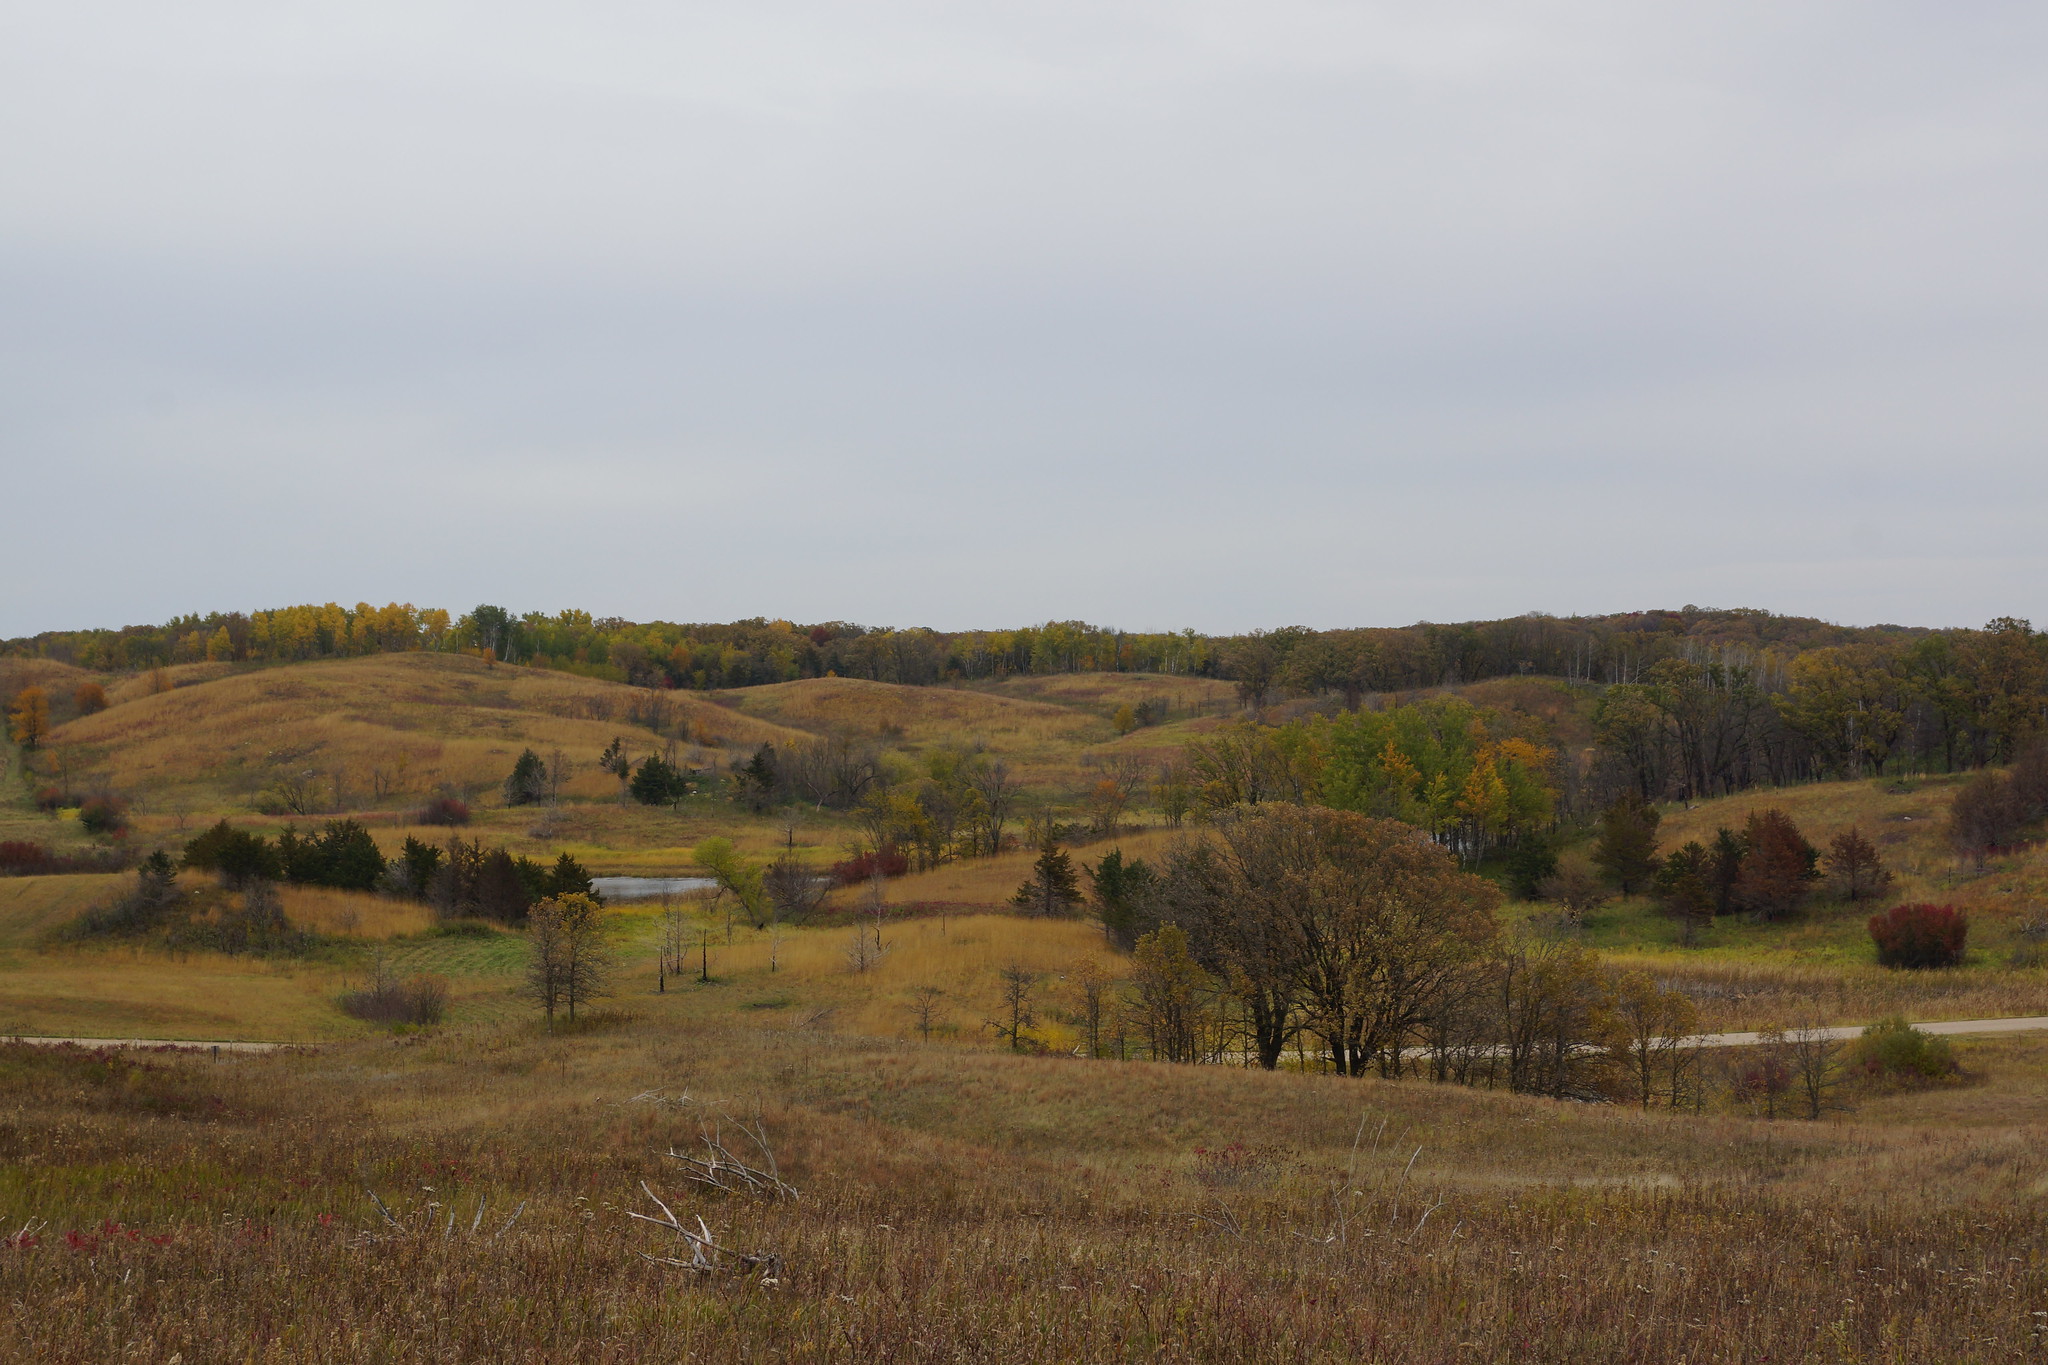
Landscape along the Glacial Ridge Trail, Minnesota, 2017. The landscape in this region is shaped by deposits of the Alexandria Glacial Moraine Complex, and includes eskers, kettles, and kames. Photo by Greg Gjerdingen (flickr, Creative Commons Attribution 2.0 Generic license).
Future climate of the midwestern U.S.
The Midwest contributes significantly to climate change. The population of any industrialized, and particularly wealthy, country produces pollution. The more than 50 million residents of the Midwest use electricity, transportation, and products that come from carbon-rich fossil fuels. The Midwest is also a major center for agriculture, manufacturing, and coal, gas, and biofuel production, each of which release greenhouse gases. A final major reason for fossil fuel consumption in the Midwest is to generate heat for buildings during the winter (in other words, burning fuels to run furnaces and boilers). Heating systems in the Midwest may use coal, natural gas, propane, heating oil, pellets, wood, or other fuels.
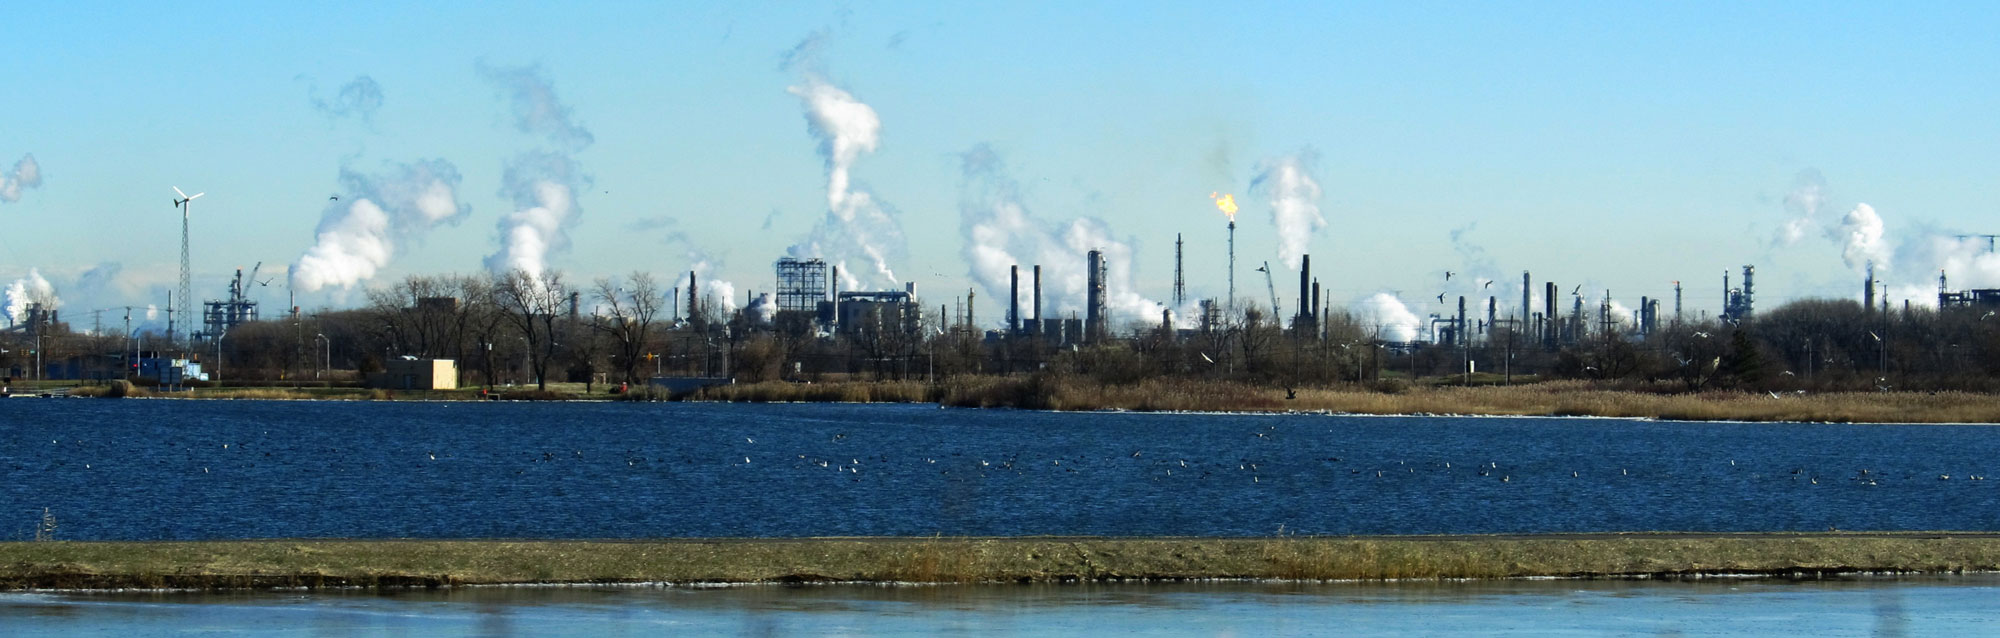
Industrial area in East Chicago, Indiana, 2013. Photo by Ken Lund (flickr, Creative Commons Attribution-ShareAlike 2.0 Generic license, image resized).

Long-exposure showing lights from nighttime traffic in Cleveland, Ohio, 2013. Photo by Erik Drost (flickr, Creative Commons Attribution-ShareAlike 2.0 Generic license, image resized).
Midwestern states are also working on ways to curb their effect on the climate. For example, in 2021 Iowa generated 58% of its electricity from wind, the highest proportion of wind power generation for any state. Illinois’s nuclear power generation was the largest of any state in 2021. In that same year, 29% of Minnesota’s electricity generation came from renewable sources, mostly (75%) from wind.
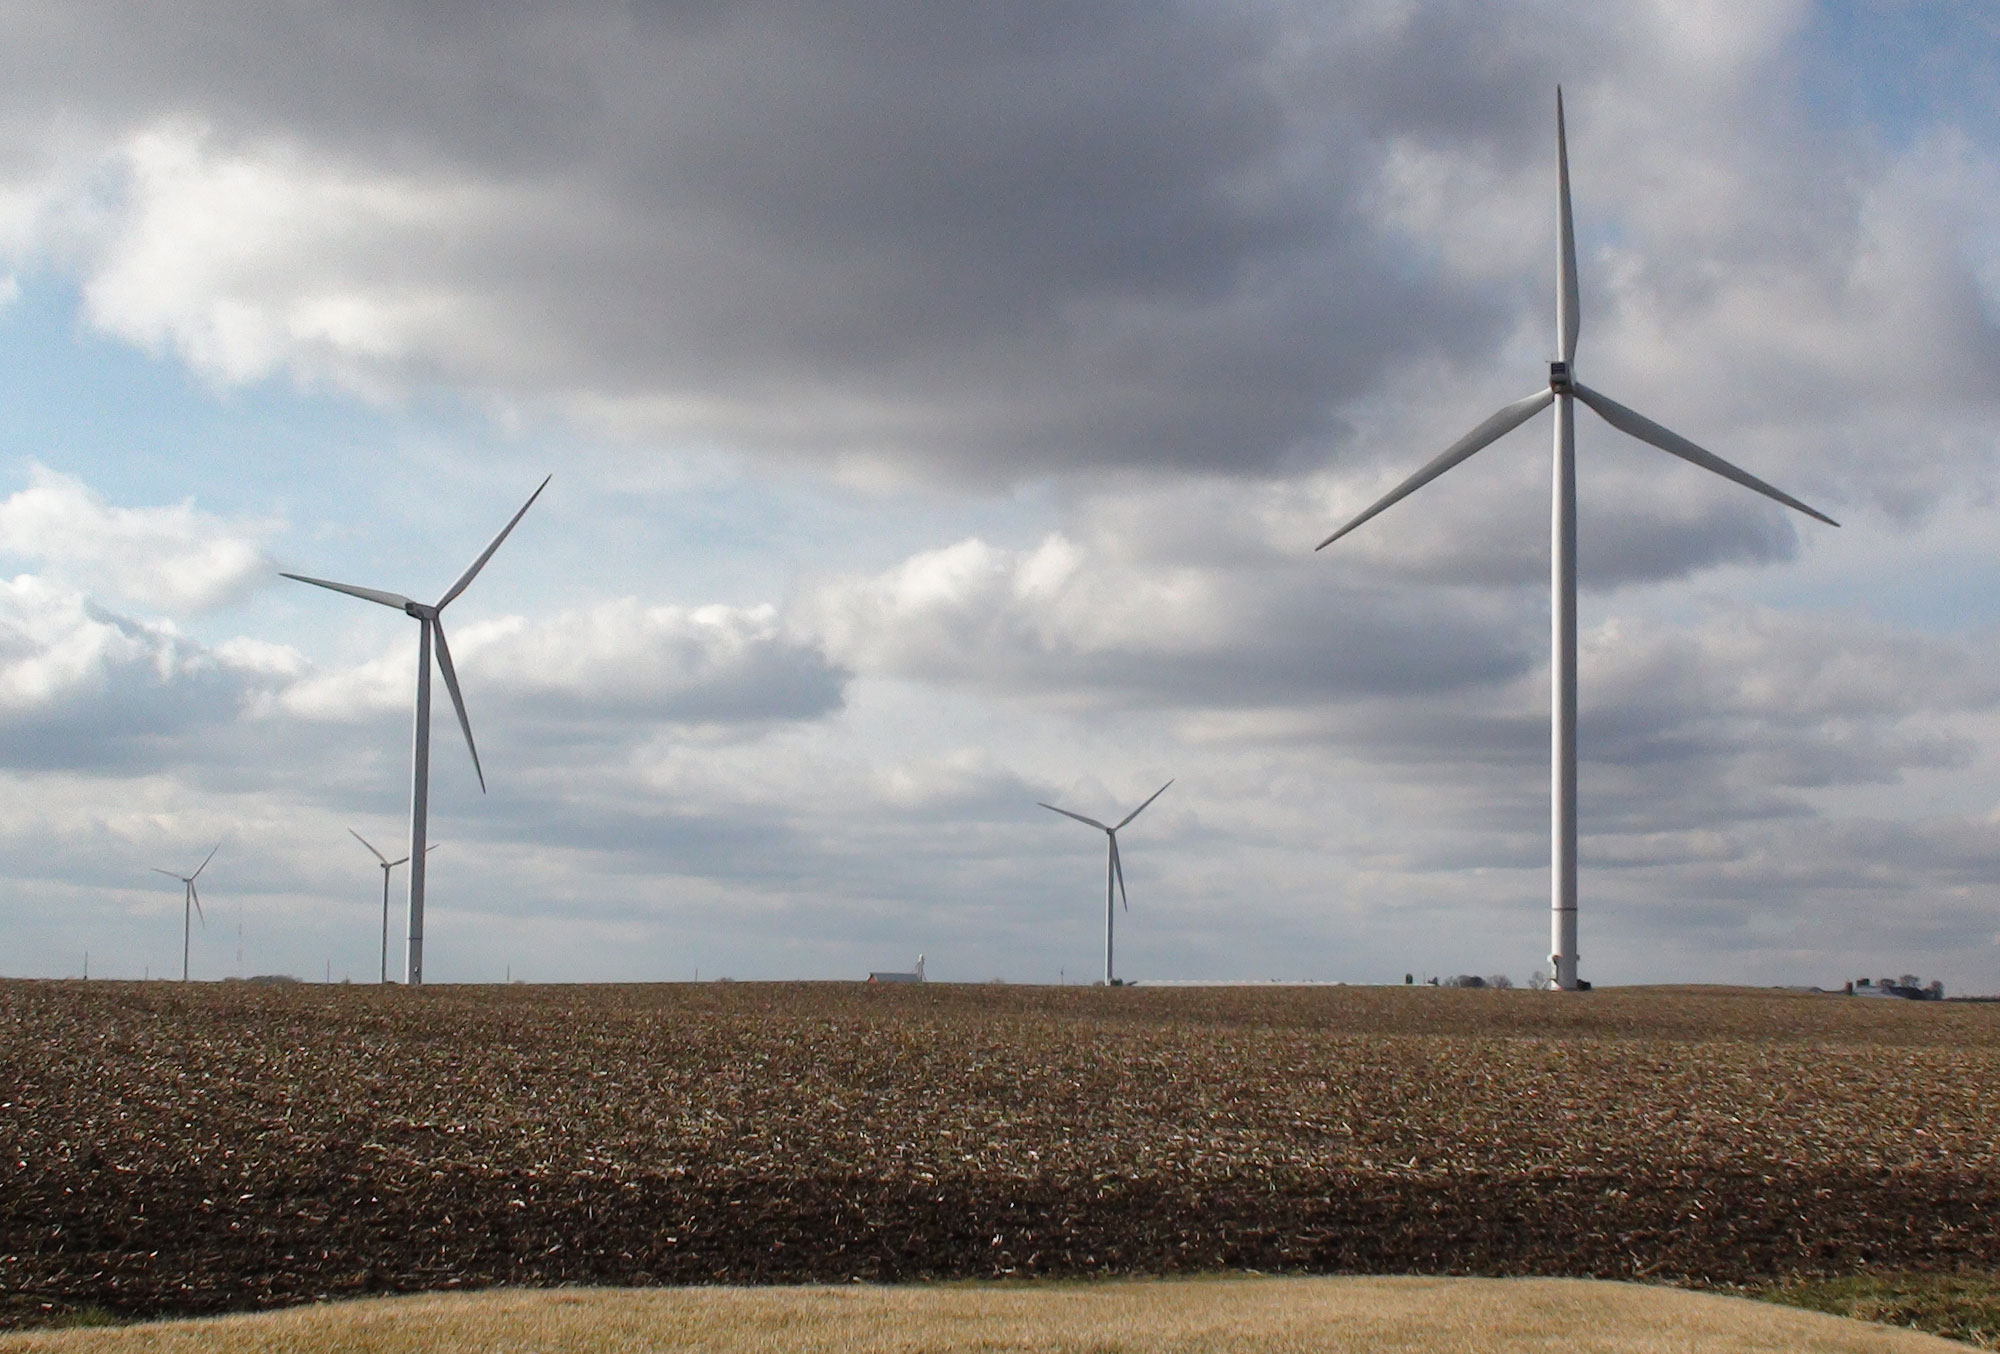
Wind turbines, Iowa. Photo by Voice of America (Wikimedia Commons, public domain).
Studies show that the Midwest’s climate is changing right now, and that change has accelerated in the latter part of the 20th century. These changes include the following:
- Average annual temperatures have risen in Midwestern states. Comparing the beginning of the 20th century to 2020, average annual temperatures have risen in Ohio more than 1.5 °F and in Minnesota more than 2.5°F.
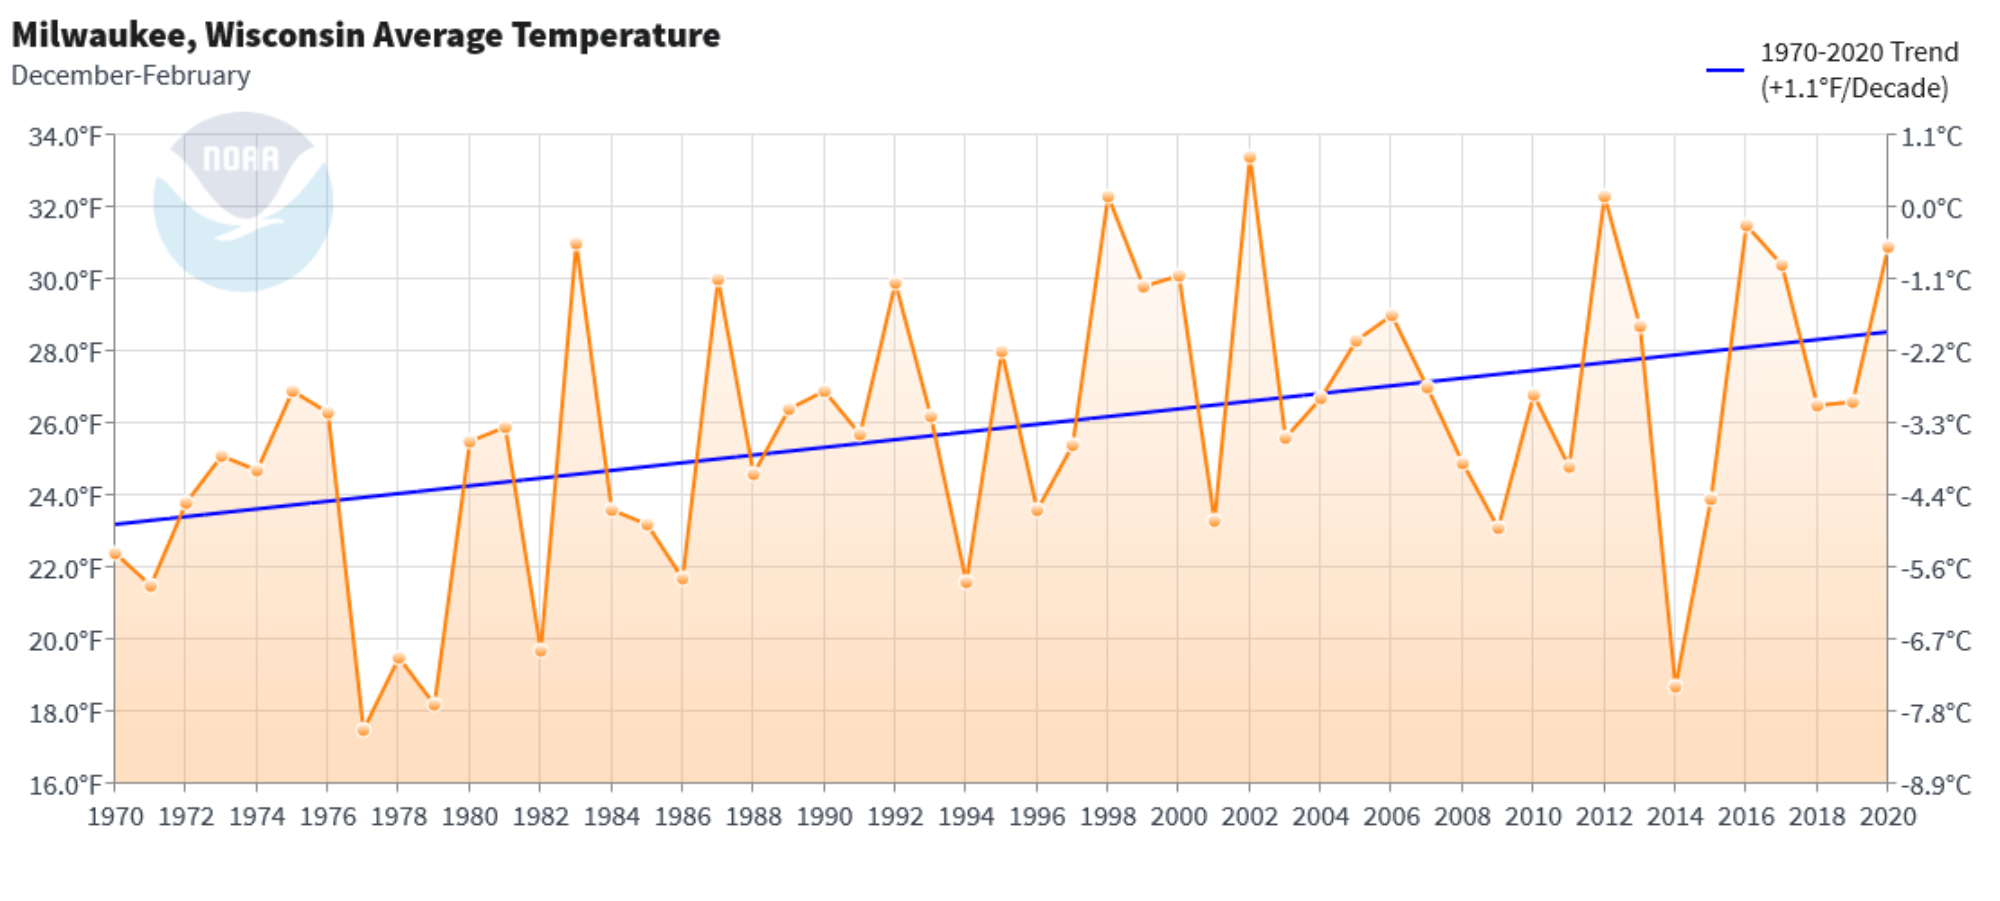
- Winters are warming faster than other seasons. Milwaukee, WI’s average winter temperature increased by 5.5°F from 1970 to 2020.
- Midwestern states are getting more precipitation than in the past. Total annual precipitation in Indiana increased at the rate of 5.3 inches per century from 1900 to 2020.
- Observations from Aldo Leopold’s farm in Wisconsin compared bird migrations and plant blooming from the period 1936-1947 and 1976-1998. These observations showed that many spring events in nature were shifting to earlier in the year by 2 to 3 weeks.
- The dates that lake ice first breaks up in the spring (“ice-out date”) has been shifting to earlier in the year for some Midwestern lakes.
Future temperature
The average temperature in the Midwest is predicted to continue to increase for the foreseeable future, though the magnitude of the increase will depend on the choices we make to reduce greenhouse gas emissions. The 4th National Climate Assessment's projections indicate an average temperature increase of a least about 4°F for the Midwest, relative to the period 1976-2005.
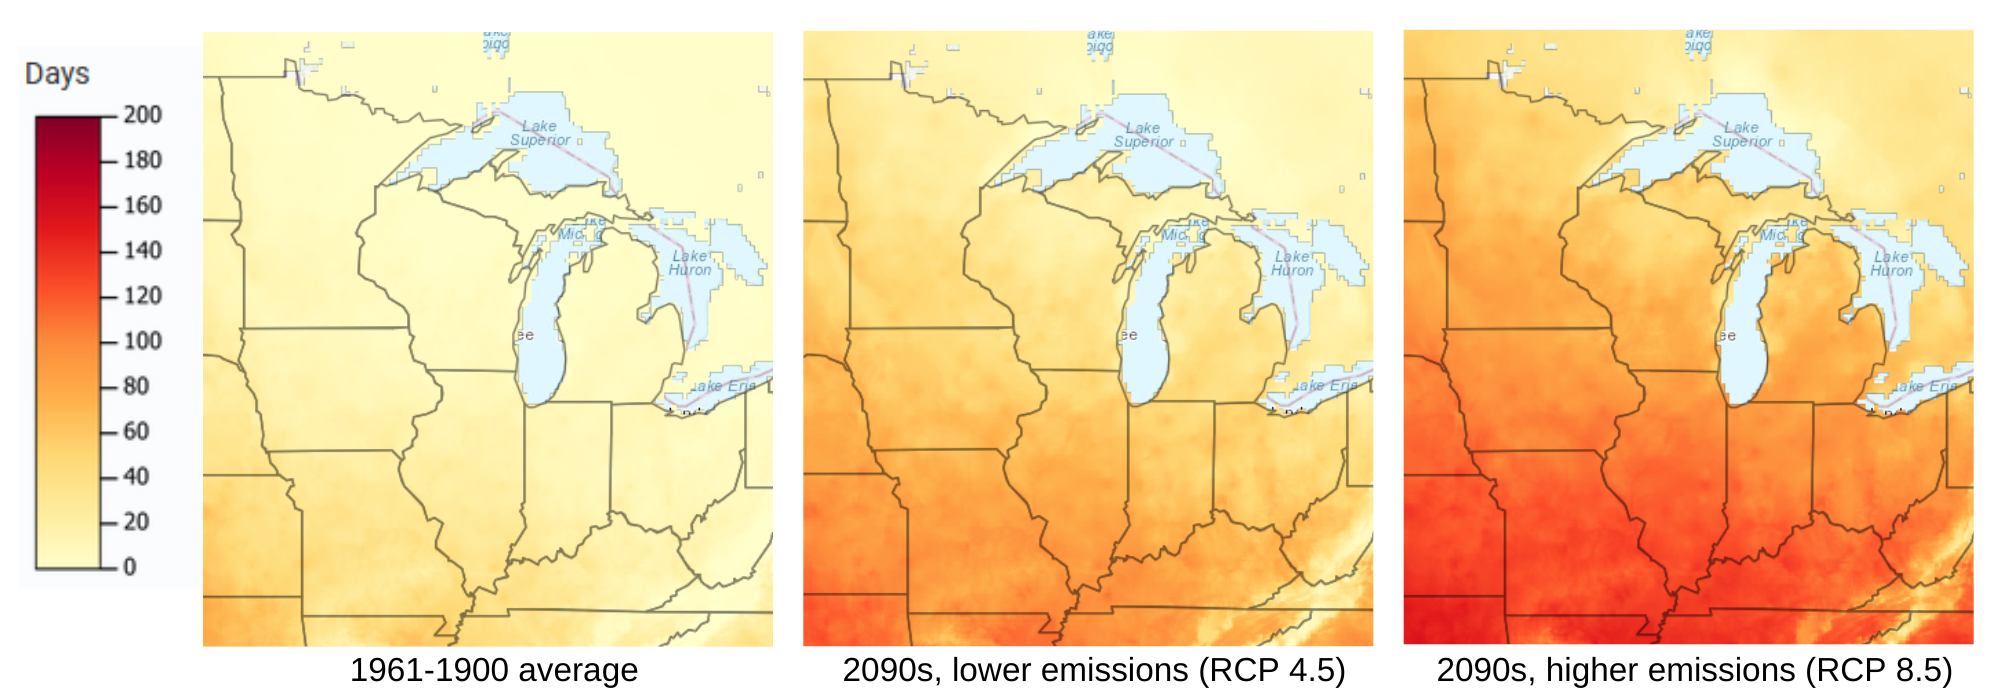
The number of days of extreme heat, defined as days when the maximum temperature is great than 90°F, is also projected to rise, bringing increased risk of heat illness and mortality and stress on ecosystems, agriculture, built infrastructure, and energy demand and production. Extremely hot days are especially hazardous for residents of large cities such as Detroit, Indianapolis, and Chicago, because heat is amplified by the urban heat island effect. Extreme heat is more dangerous for vulnerable populations, such as elderly people whose bodies cannot regulate temperature as effectively as they used to; people with low incomes who cannot afford air conditioning; and people whose first language is not English, who may not receive heat warnings and safety information in a language they can understand.
Future Precipitation
Precipitation is projected to increase in the Midwest, in the form of both total precipitation and extreme precipitation events where a large amount of rain falls in a short period of time. The figure below shows projections for changes in extreme precipitation, for two greenhouse gas emissions scenarios. Heavy rainfalls can lead to devastating flooding.
Even with increased precipitation, more frequent and extreme droughts are likely in the Midwest. This is because higher air temperatures lead to more evaporation of soil moisture, and hence drying out of the soil, and the effect of this increased evaporation is expected to outweigh the increase in rainfall.
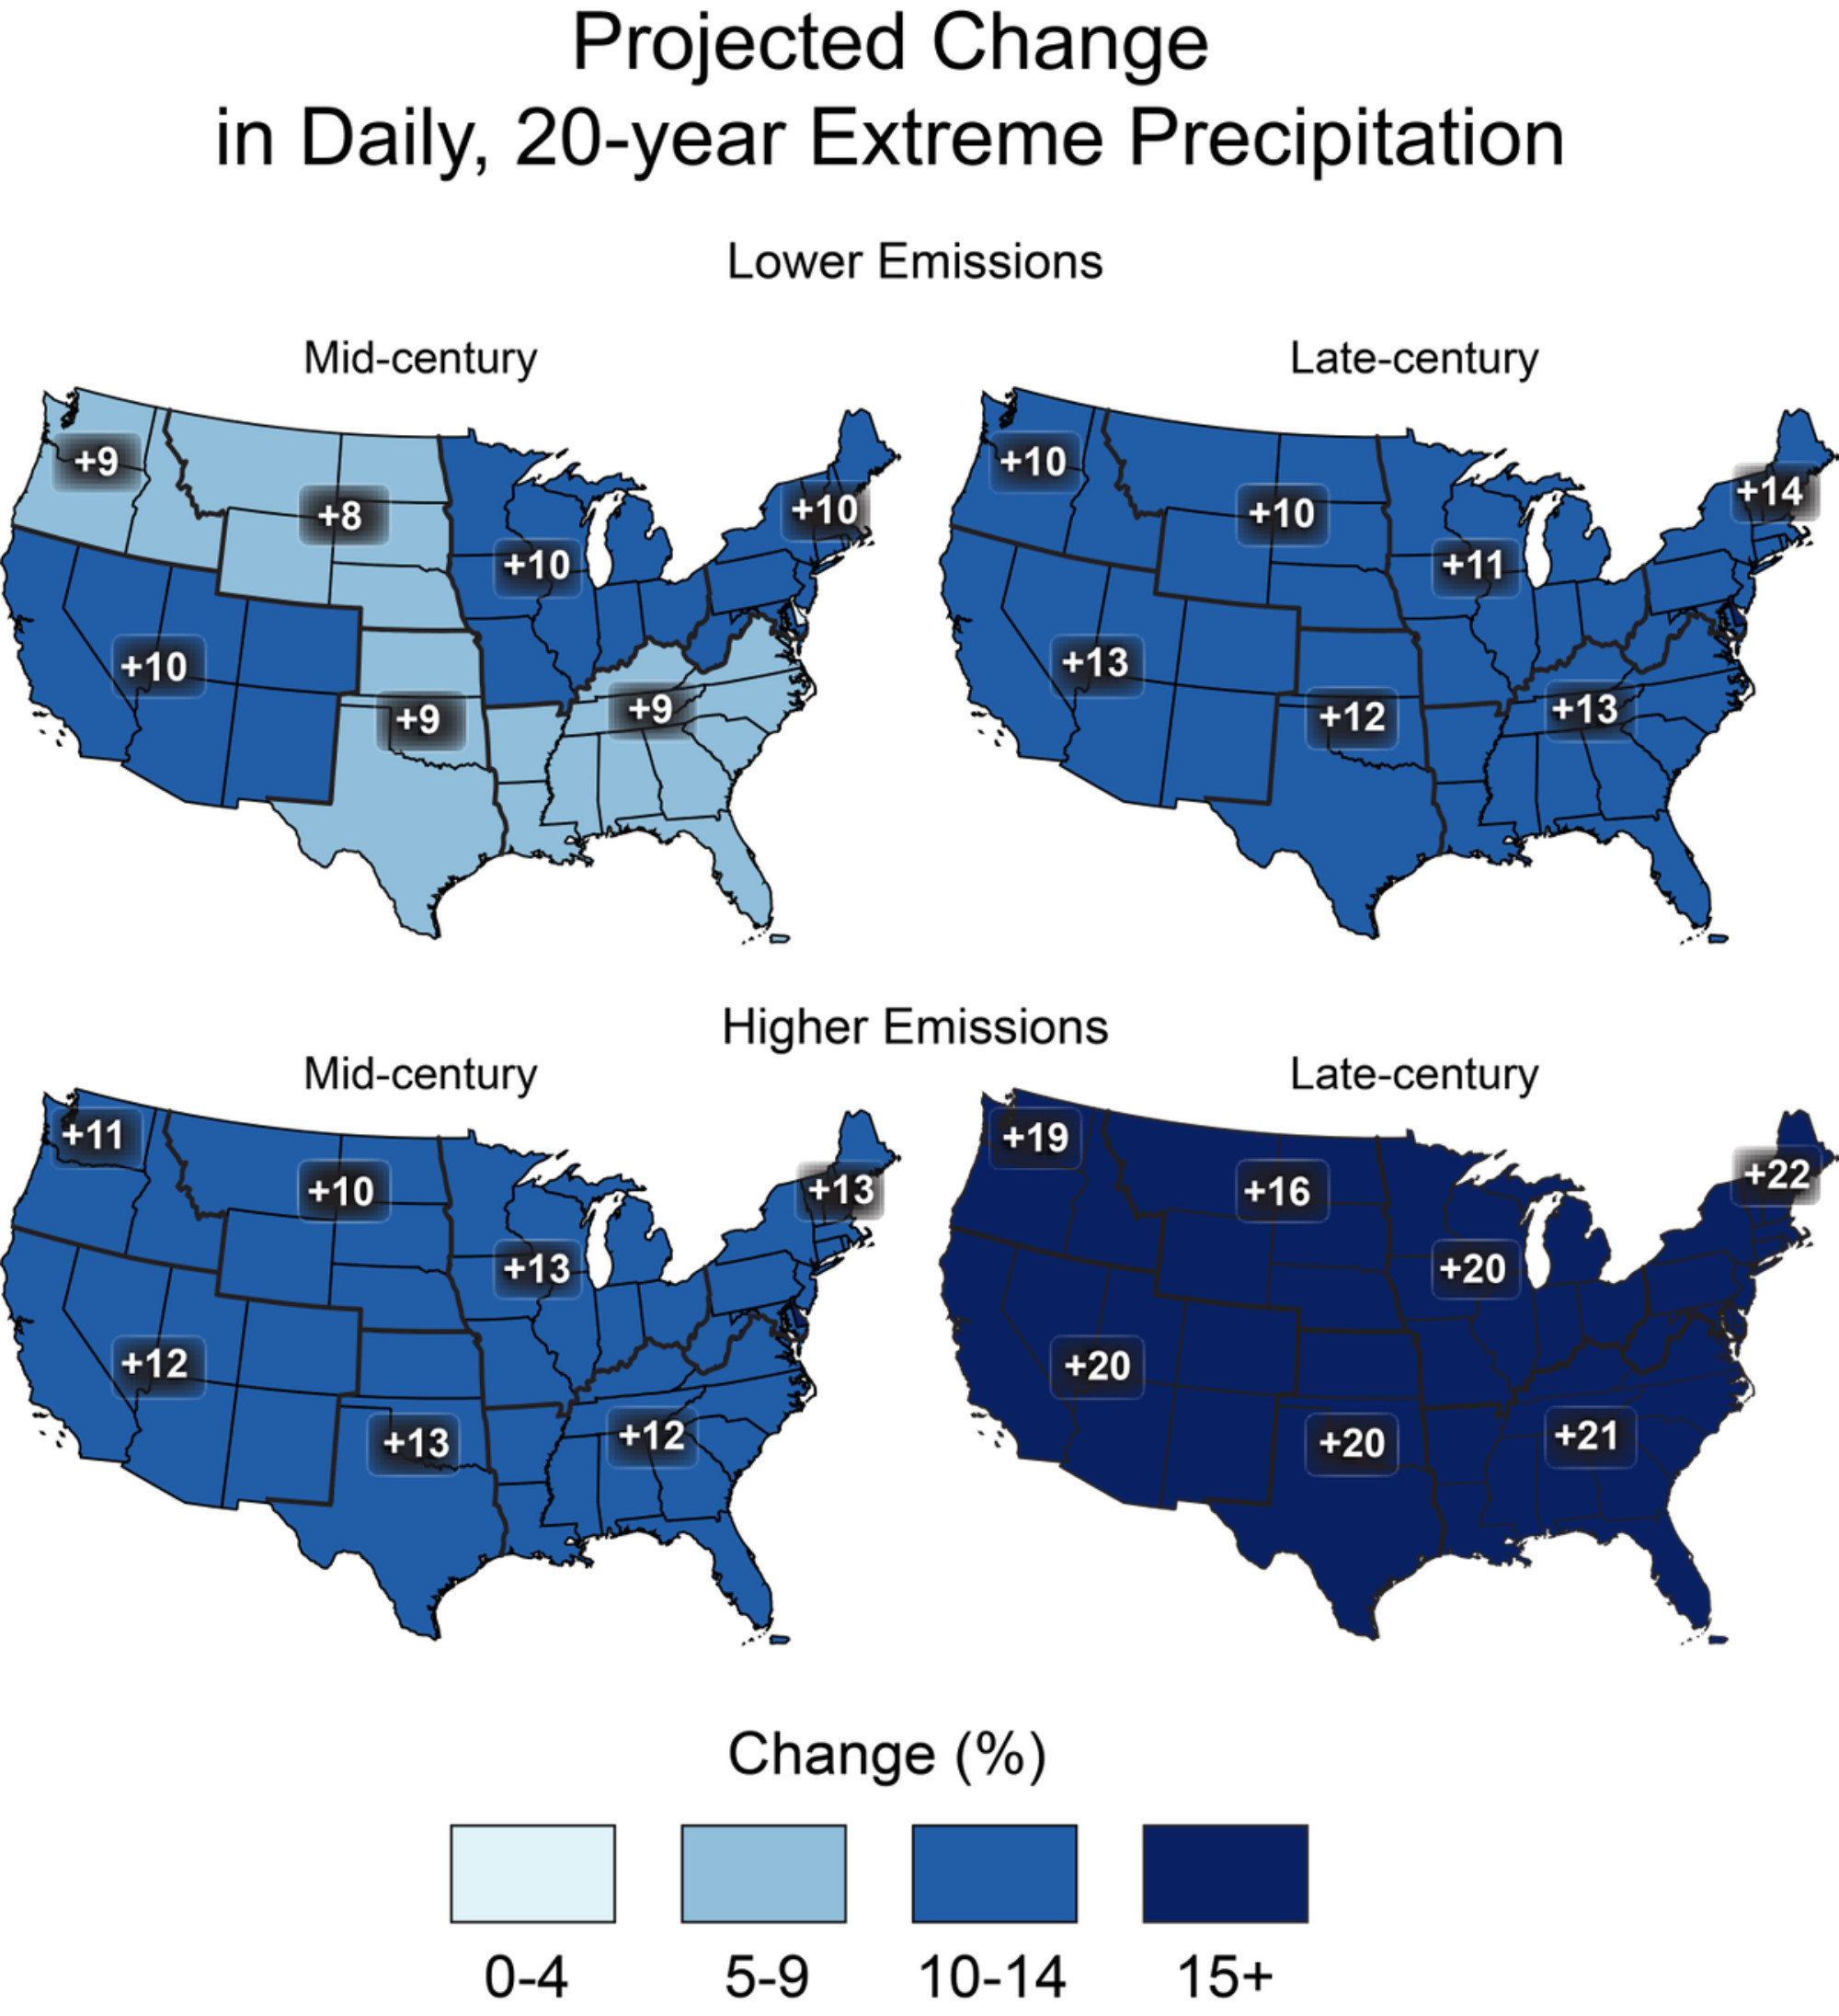
Maps of projected changes in heavy precipitation events, in this case for 20-year events (that is, storm rainfall amounts that have a 1-in-20 chance of happening in any given year.) The maps are shown for two different time periods, mid- and late-21st century. The top row of projections are for a lower greenhouse gas emissions scenario, and the bottom row are for a higher emissions scenario. Map source: 4th National Climate Assessment, Climate Science Special Report (2018), Chapter 7 - Precipitation Change in the United States. Original source: CICS-NC and NOAA NCEI.
Extreme Storms
Scientists have not reached robust conclusions about the impact of global climate change on the future frequency and intensity of tornadoes, hail storms, and thunderstorms. Evidence shows that the season in the U.S. with high tornado activity is beginning earlier in the year, but it is not clear if this pattern will continue. Evidence also points to an increase in the number of days per year with many tornadoes, and in volatility in the occurrence of tornadoes. But future projections of these trends are also not clear.
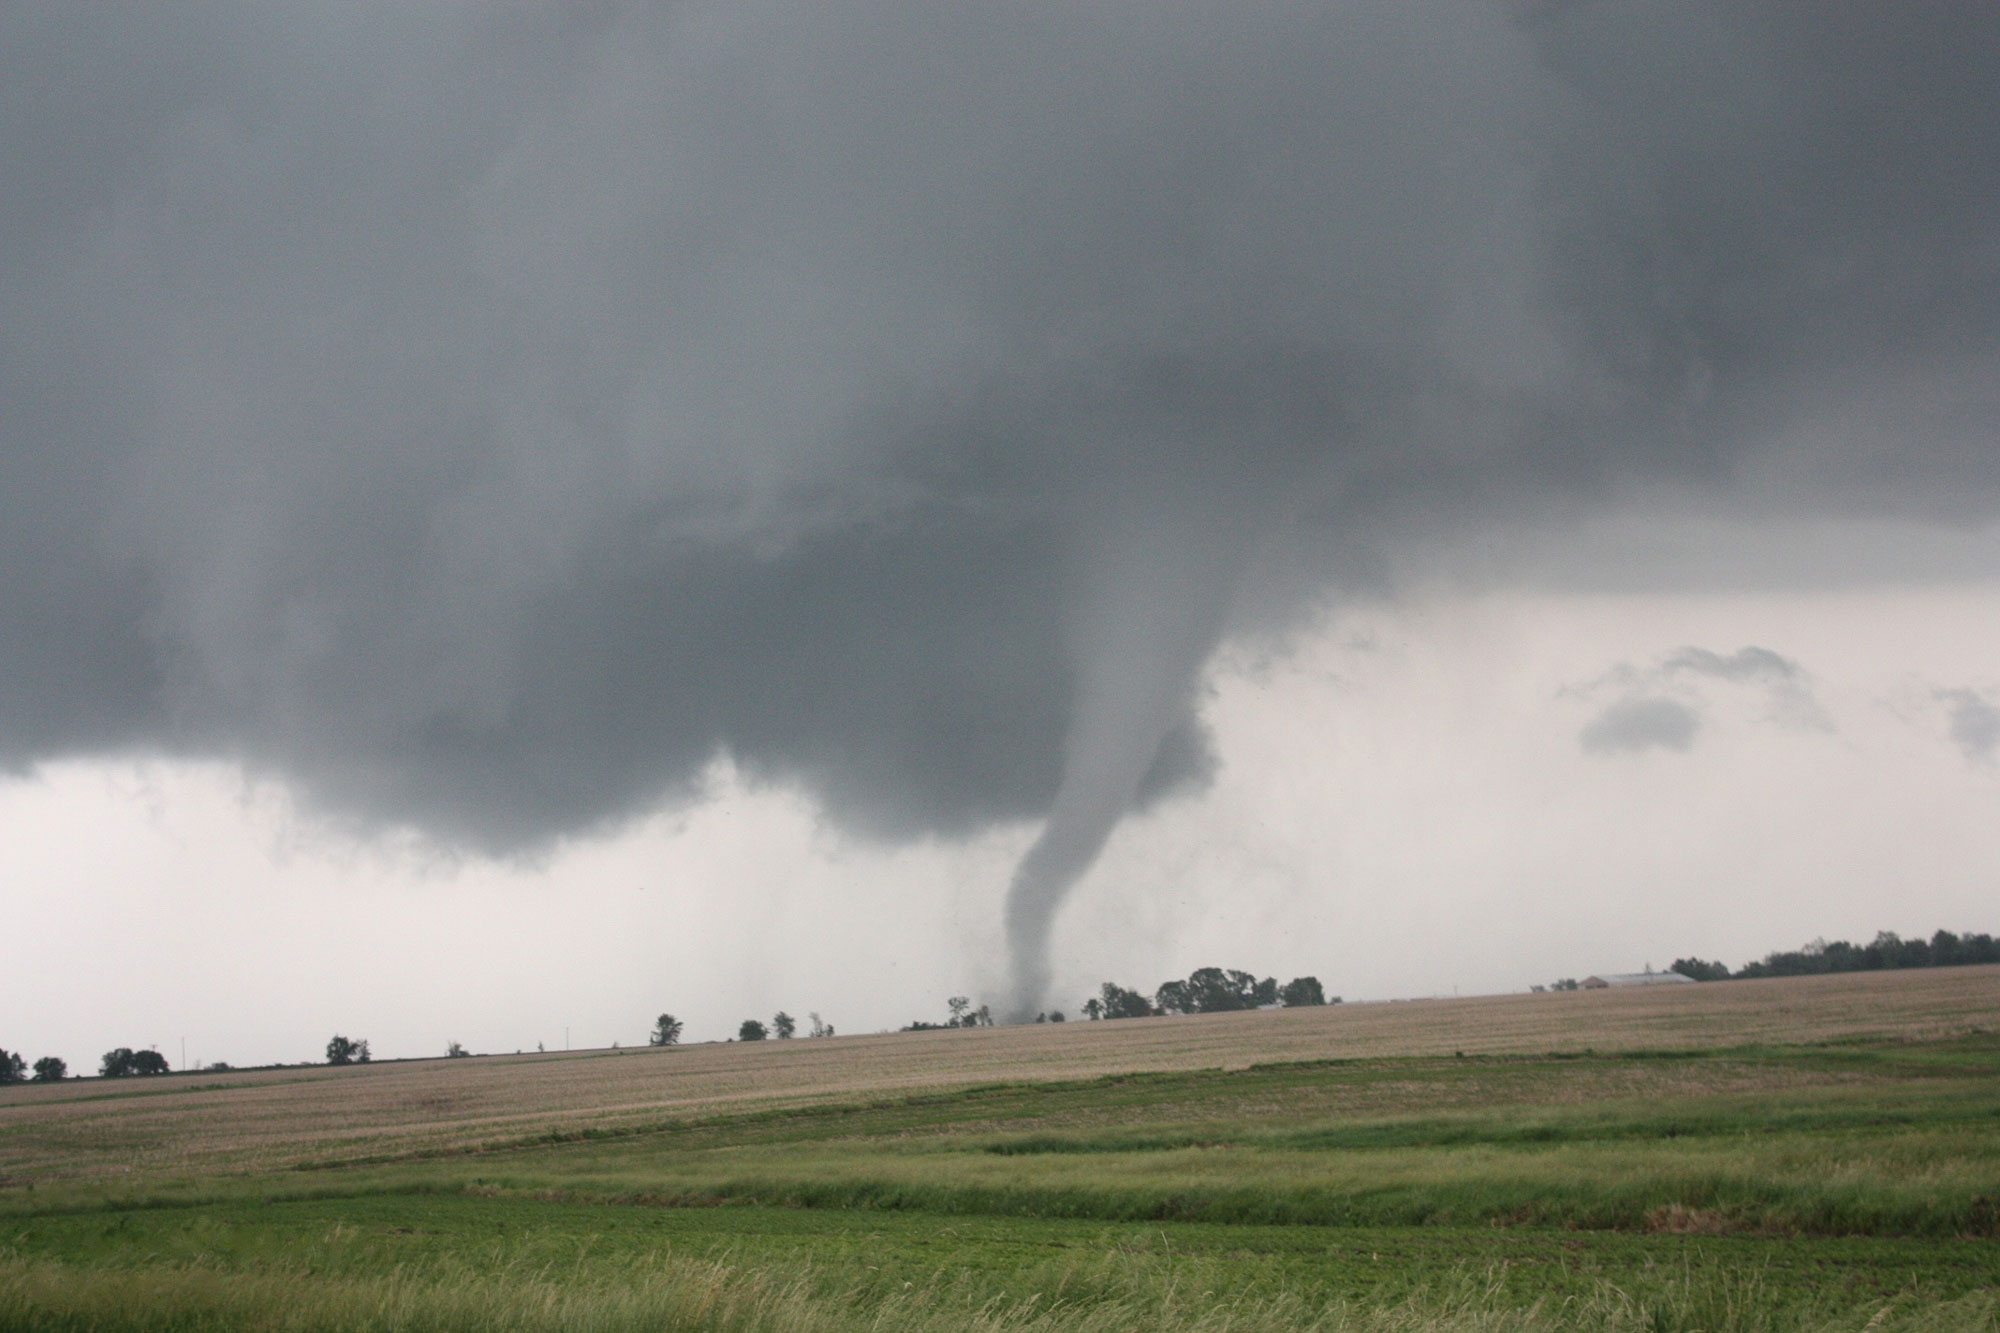
A tornado in Abingdon, Illinois, 2010. Photo by Jarrod Cook (Wikimedia Commons, public domain).
Resources
Resources from the Paleontological Research Institution
Books
Zabel, I.H.H., D. Haas, and R.M. Ross. 2017. The Teacher-Friendly Guide to Climate Change. Paleontological Research Institution Special Publication 53, Ithaca, NY, 294 pp. Find updated, digital versions of the chapters of this book on Earth@Home Climate.
Allmon, W. D., T. A. Smrecak, and R. M. Ross. 2010. Climate change—past, present & future: a very short guide. Paleontological Research Institution Special Publication 38, Ithaca, NY, 200 pp.
Websites
Earth@Home Climate: https://climate.earthathome.org/
Earth@Home: Quick guides & FAQ: Climate and Energy: https://earthathome.org/quick-faqs/#climate
Earth@Home: Here on Earth: Introduction to Climate: https://earthathome.org/hoe/climate/