

Page snapshot: Introduction to climate, including what climate is, past climate, present climate of the United States, and future climate.
Topics covered on this page: What is climate?; Factors that affect climate; Past climate; Hadean to Archean climate; Proterozoic climate; Phanerozoic climate; Paleozoic climate; Mesozoic climate; Cenozoic climate; Present climate of the US; Future climate; Resources.
Credits: Most of the text of this page is derived from "Climate of the Southeastern US" by Ingrid H.H. Zabel, Judith T. Parrish, and Don Haas, chapter 8 in The Teacher-Friendly Guide to the Earth Science of the Southeastern US, 2nd. ed., edited by Andrielle N. Swaby, Mark D. Lucas, and Robert M. Ross (published in 2016 by the Paleontological Research Institution; currently out of print), with some text coming from other volumes of the Teacher-Friendly Guide series. The book was adapted for the web by Elizabeth J. Hermsen and Jonathan R. Hendricks in 2021. Changes include formatting and revisions to the text and images. Credits for individual images are given in figure captions.
Updates: Page last updated March 10, 2025.
Image above: Roberts Lake, Wisconsin, in the summer. Photo by Jonathan R. Hendricks.
What is climate?
Climate is a description of the average temperature, range of temperatures, humidity, precipitation (rainfall and snowfall), and other atmospheric and hydrospheric conditions a region experiences over a period of many years. These factors interact with and are influenced by other parts of the Earth system, including geology, geography, insolation, currents, and living things.
Because it is founded on statistics, climate can be a difficult concept to grasp, yet concrete examples can be illuminating. Terms like "desert," "rain forest," and "tundra" describe climates, and we have gained a general understanding of their meaning. Climate can also encompass the cyclical variations a region experiences; a region with a small temperature variation between winter and summer—San Francisco, for example—has a different climate from one that has a large variation, such as Buffalo, New York. Scientists have settled on 30 years as the shortest amount of time over which climate can be defined, but it can of course also define time periods that are millions of years long.
You cannot go outside and observe climate. Weather, on the other hand, can be observed instantly. What is the temperature right now? Is it raining? Weather varies with the time of day, the season, multi-year cycles, etc., while climate encompasses those variations. Our choice of clothing in the morning is based on the weather, while the wardrobe in our closet is a reflection of climate. Due to its great variety of environments, from the boreal areas of Alaska to the subtropics of Hawai‘i and Florida, residents of the United States generally have a diverse wardrobe. The most variable climates are in the interior areas and mountains of the western contiguous U.S. These areas can vary from frigid in the winter to scorching in the summer. By contrast, coastal climates have more moderate seasonal variations.
Factors that affect climate
Greenhouse gases
Greenhouse gases include gases like water vapor, carbon dioxide (CO2), and methane (CH4). Much of the light from the sun passes unimpeded through the atmosphere and hits the Earth. Approximately 70% of that light is absorbed and retransmitted from the surface as heat. The transmitted heat, which has a longer wavelength than light, is trapped by greenhouse gases in the atmosphere. The similarity between this process and the process that warms a greenhouse gives "greenhouse gases" their name.
This animation describes the greenhouse effect. Animation by NASA-JPL/Caltech.
Plate tectonics
While the atmosphere was forming about 3.7 billion years ago, the surface of the Earth was cooling to form a solid crust of rock (although there are indications that this process may have started as early as 4.4 billion years ago). Regardless of precisely when this took place, it represented the beginning of tectonic processes that have continued ever since. Molten rock from the mantle constantly wells up from deep fissures and solidifies into relatively dense rock, while more buoyant rock floats higher on the magma and is pushed around on the slow conveyor belts of mantle-formed rock.
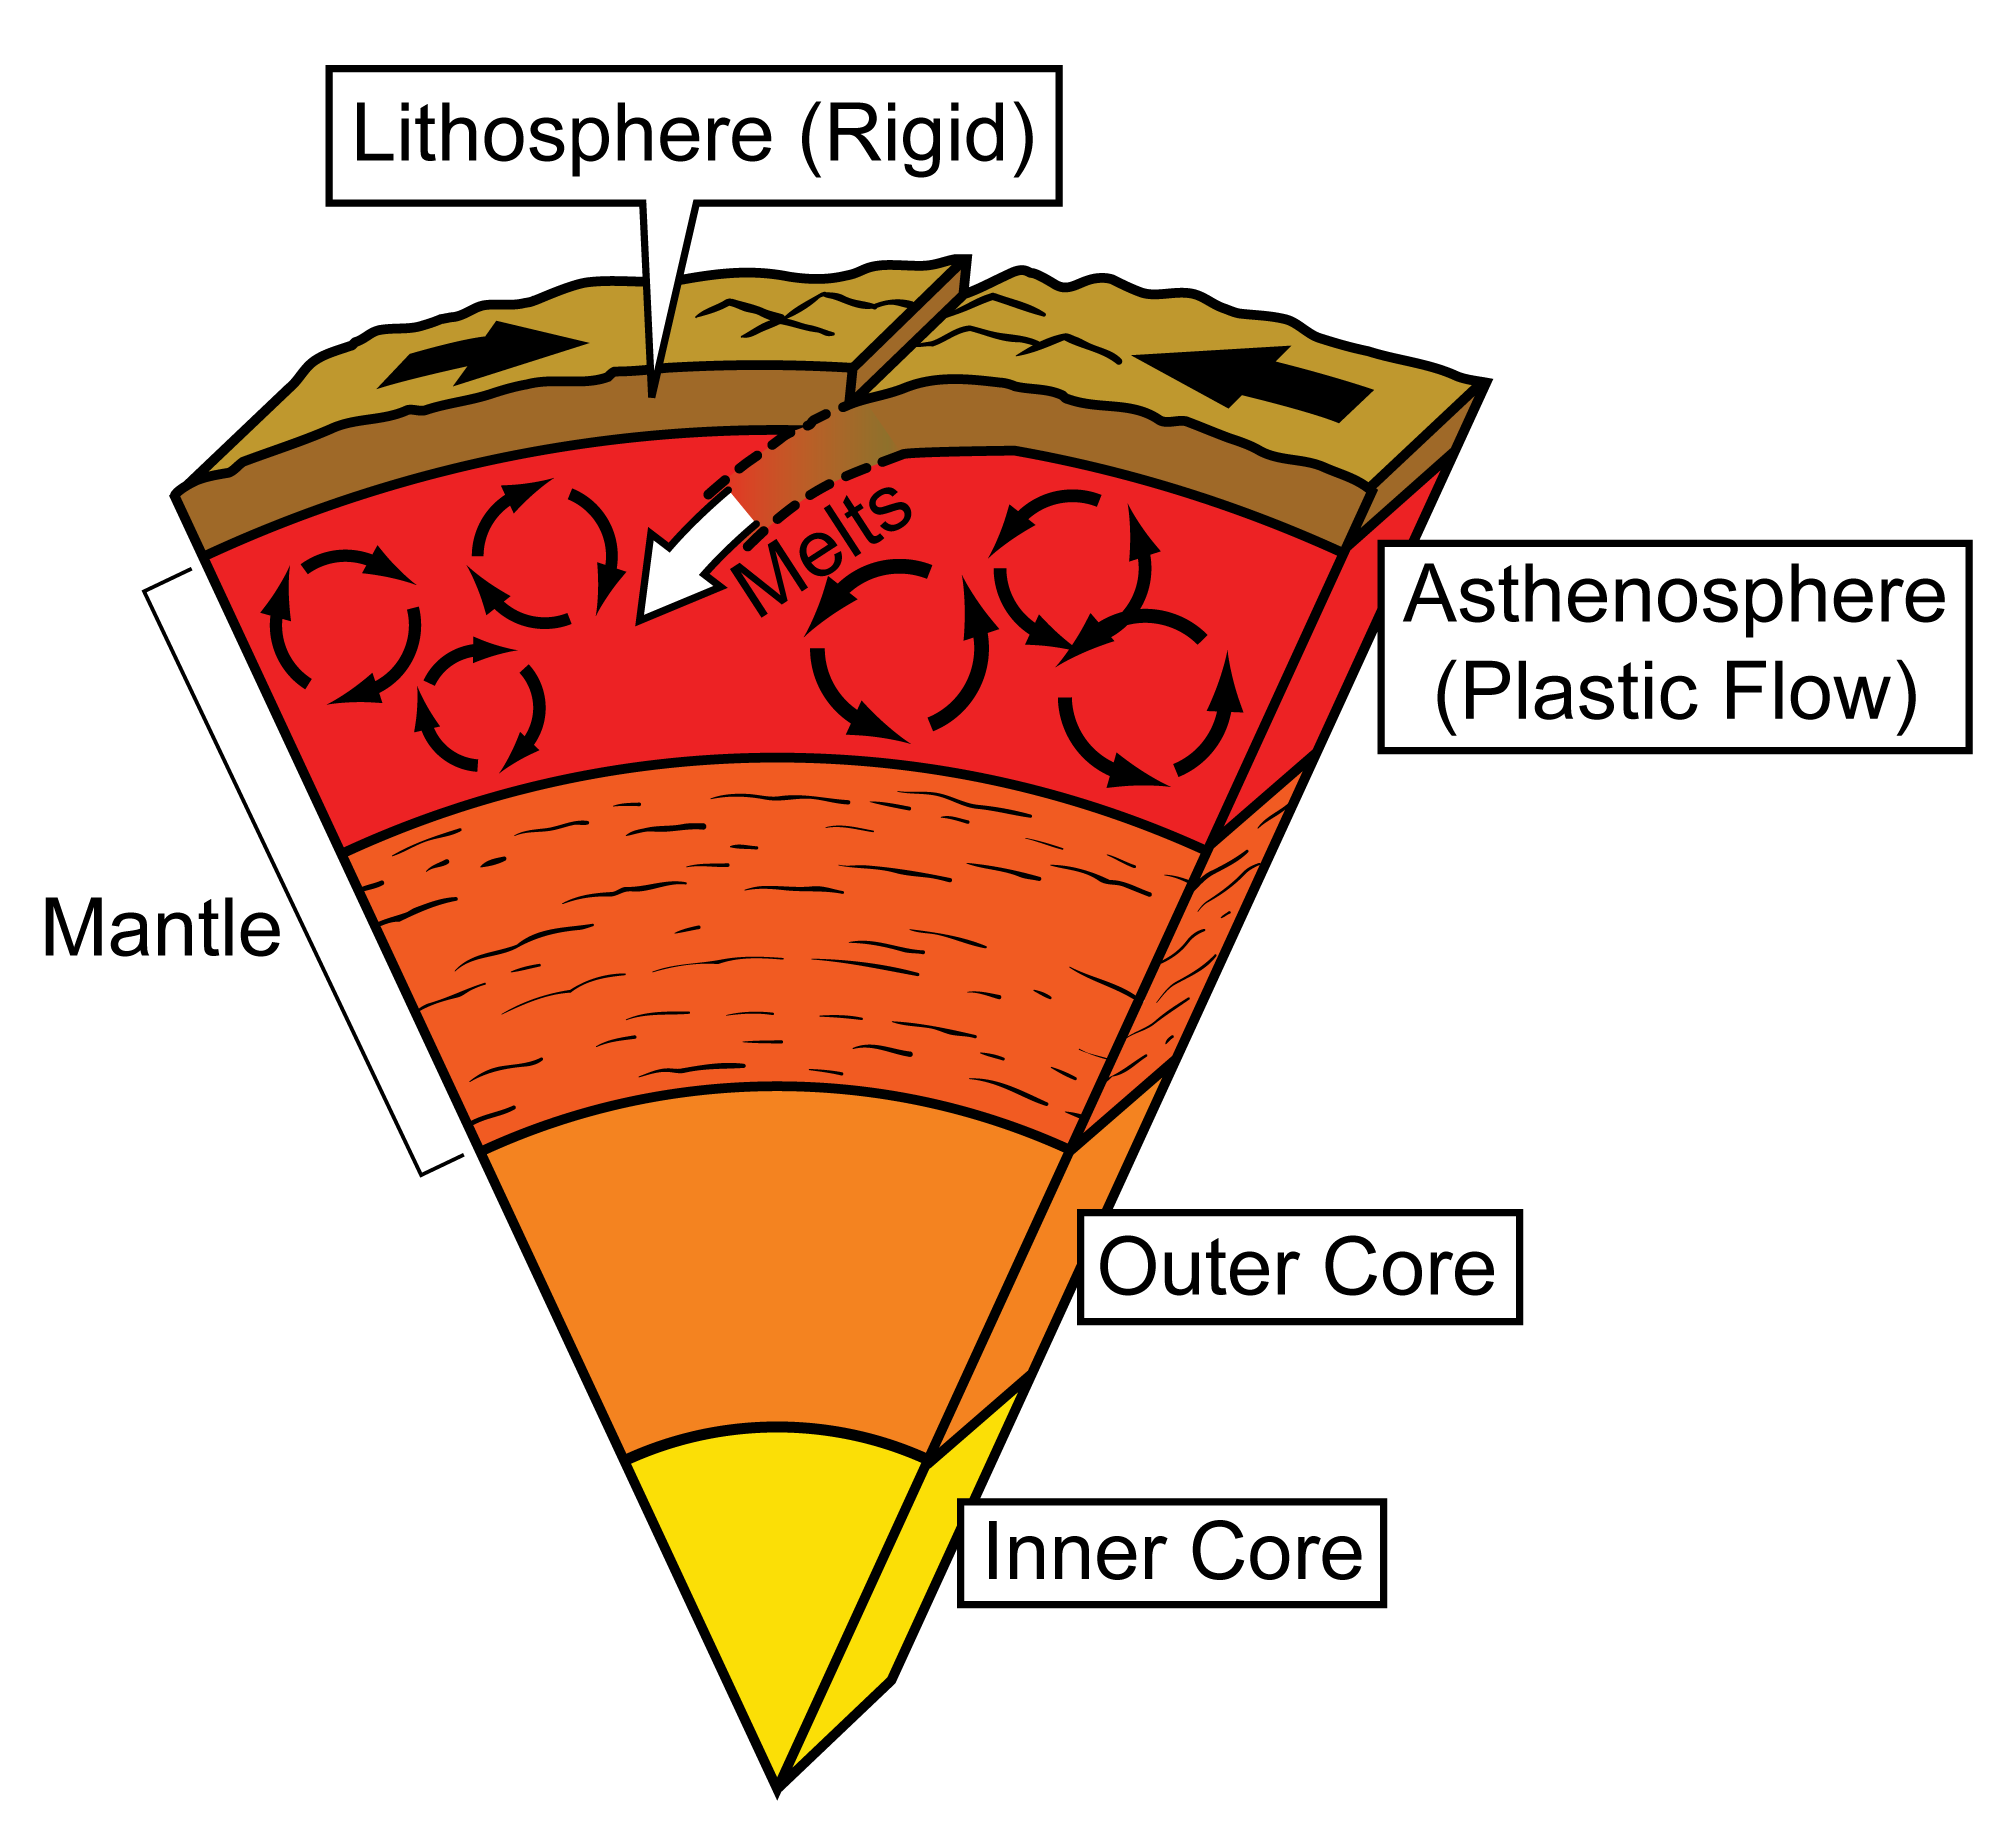
A cross-section of the Earth showing the layers from the center (inner core) to the surface (lithosphere). Note that the solid crust that makes up the lithosphere sits on the outer part of the mantle, which is called the asthenosphere. The asthenosphere exhibits plastic flow, like a very thick liquid. Over time, this allows the plates of the lithosphere to shift and move on the asthenosphere. Image modified from original by Jim Houghton, first published in The Teacher-Friendly Guide to the Earth Science of the Southeastern US, 2nd ed., edited by Andrielle N. Swaby, Mark D. Lucas, and Robert M. Ross (published by the Paleontological Research Institution) (CC BY-NC-SA 4.0 license).
The motion of these plates, the rearrangement of the continents, and the amount and types of minerals exposed to the atmosphere play a huge role in the climate. The continents and oceans span different climate zones, and the continents have moved over geologic time. The continents also affect climate based on their size, their positions relative to one another, and their topographic features. Specifically, the position of continents affects processes like ocean circulation, which helps to drive worldwide climate patterns. Features like mountain ranges and large lakes can also affect climate.
Weathering
The weathering of rock on the continents also plays a large role in the composition of the atmosphere. For example, rock that is enriched in organic matter will release abundant amounts of carbon dioxide as it weathers, which may contribute to warming.
Silicate and carbonate rocks both weather chemically in reactions that involve carbon dioxide (CO2) and water, typically creating clays, bicarbonate (HCO3), and calcium ions. The weathering of silica rocks like granite occurs relatively slowly and takes place over a long scale, for example the the length of time it takes to erode a mountain range. Weathering of silica rocks may have an impact on atmospheric carbon dioxide levels on time scales of tens or hundreds of millions of years. On the other hand, carbonate rocks like limestone (CaCO3) weather (in this case, dissolve) quickly relative to silicates.
In both cases, the products of weathering often end up in seawater, where they may be used in the calcium carbonate skeletons of marine organisms or may be taken up during photosynthesis. Skeletal material and organic matter often sink to the sea floor and become buried, effectively removing carbon from the global carbon cycle (and thereby the atmosphere) for many millions of years, which can contribute to cooling. Organisms with carbonate skeletons did not appear in great numbers until the Cambrian period, which began about 541 million years ago.
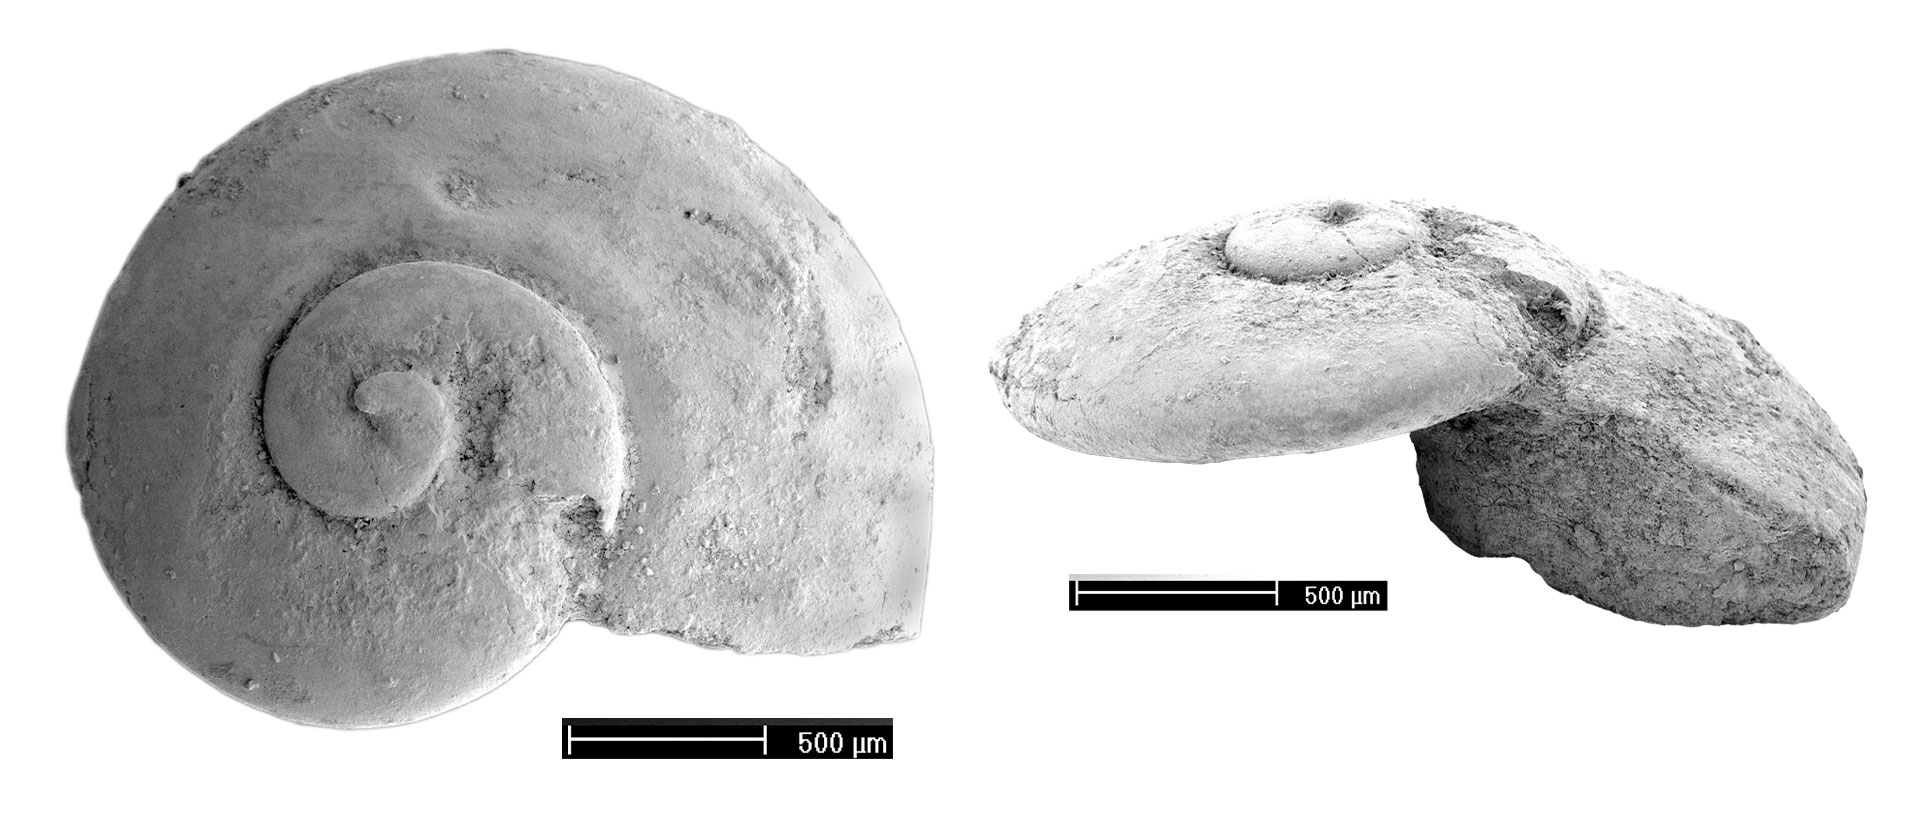
A fossil mollusk (Aldanella kunda) from the Cambrian. This species is a type of organism that is part of the Cambrian small shelly fauna, early organisms that made shells. Left: Apex. Right: Side view. Scale is 500 microns (0.5 mm). Photos are scanning electron microscope (SEM) images of Aldanella kunda (Öpik, 1926) - Museum of Geology, University of Tartu (Europeana, Creative Commons Attribution-NonCommercial 3.0 Unported license, image modified).
Past climate
Climate, like other parts of the Earth system, is not static but changes over time on both human and geologic time scales. Latitude, for example, has a very direct effect on climate, so as the continents shift over geologic time, the climates on them also shift. Furthermore, the conditions on Earth as a whole have varied through time, altering what kinds of climates are possible.
Ancient climates are reconstructed through many methods. Written records, tree rings, and glacial ice cores go back hundreds of thousands of years, whereas fossils and rocks that indicate different climates go back as far as hundreds of millions of years. These clues, coupled with modeling and a knowledge of physics and chemistry, help climatologists put together an increasingly detailed history of the Earth's climate. Unfortunately, we do not have as clear an understanding of climate for the earliest part of Earth history as we do for the later parts, because the oldest rocks are much more difficult to find. However, we can still say something about the climate of the ancient Earth, in large part due to our knowledge of atmospheric chemistry.
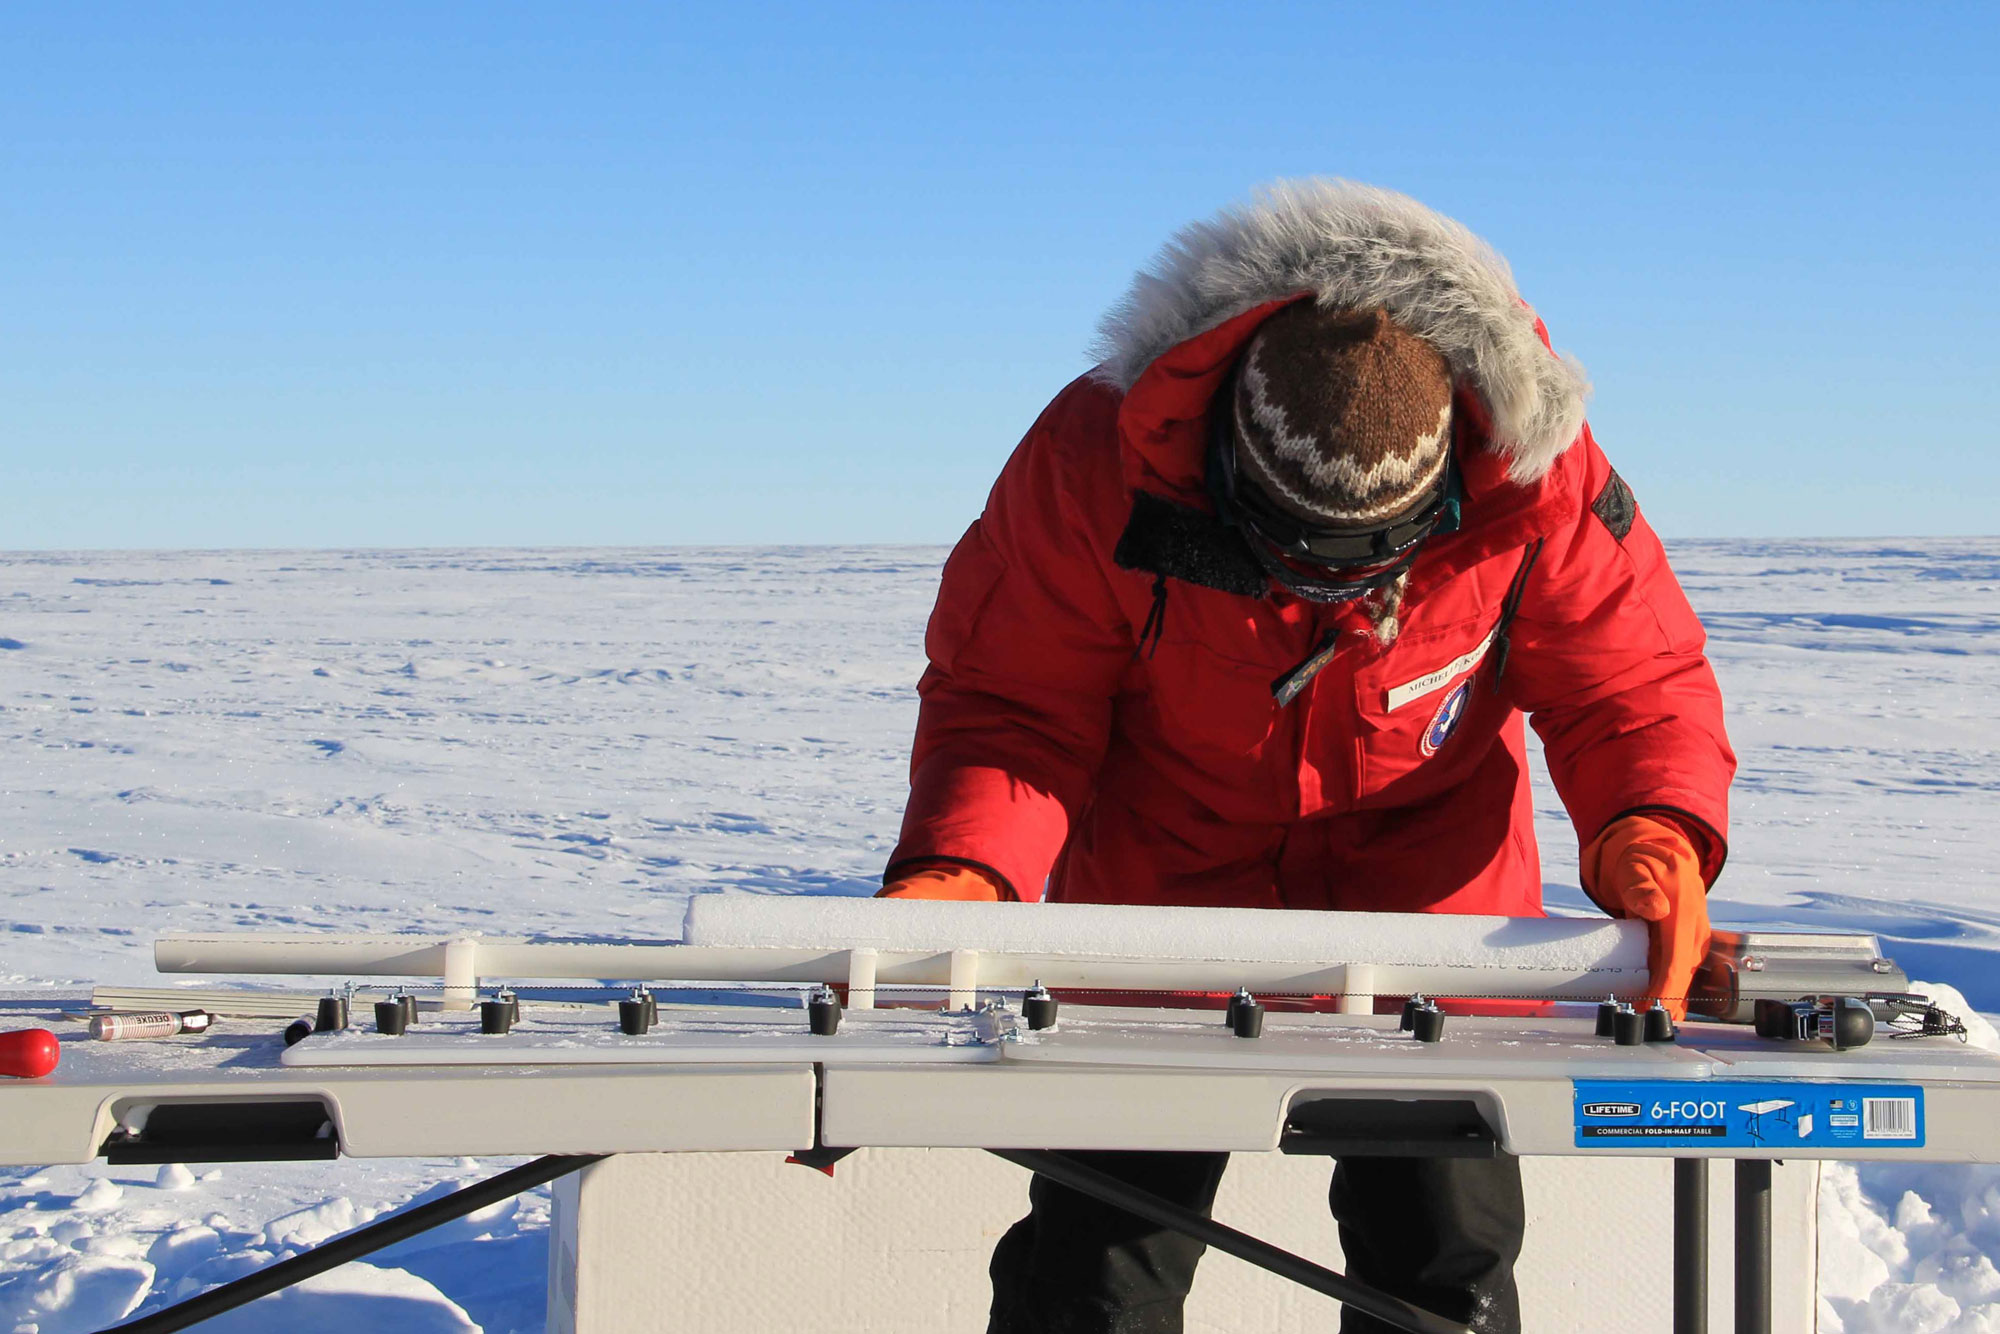
Scientist Michelle Koutnik (University of Copenhagen Center for Ice and Climate) measuring an ice core in Antarctica before it is packed for shipping. Photo by NASA/Lora Koenig (NASA Ice, flickr, Creative Commons Attribution 2.0 Generic license, image resized).
Hadean to Archean (4.6 to 2.5 billion years ago)
Not long after the Earth first formed more than 4.5 billion years ago, its atmosphere was composed mostly of hydrogen and helium. Volcanic activity and collisions with meteorites and comets added water vapor, carbon dioxide (CO2), and nitrogen (N2) to the atmosphere. As the Earth cooled enough for liquid water to form, water vapor formed clouds. Rain poured forth in volumes the planet will never experience again. These torrential rains were constant for millions of years. The rainwater absorbed salt and other minerals as it flowed to the lowest areas on the surface of the planet, forming Earth's oceans and seas.
During the early formation of the Earth and its atmosphere, the sun produced significantly less energy than it does today. Thus, one might expect that once the oceans formed, they would continue to cool and eventually freeze. Yet temperatures stabilized and remained high enough for liquid water to exist. Temperatures may have remained above freezing because there was a greater concentration of potent greenhouse gases in the atmosphere and less land surface to reflect light than there is today.
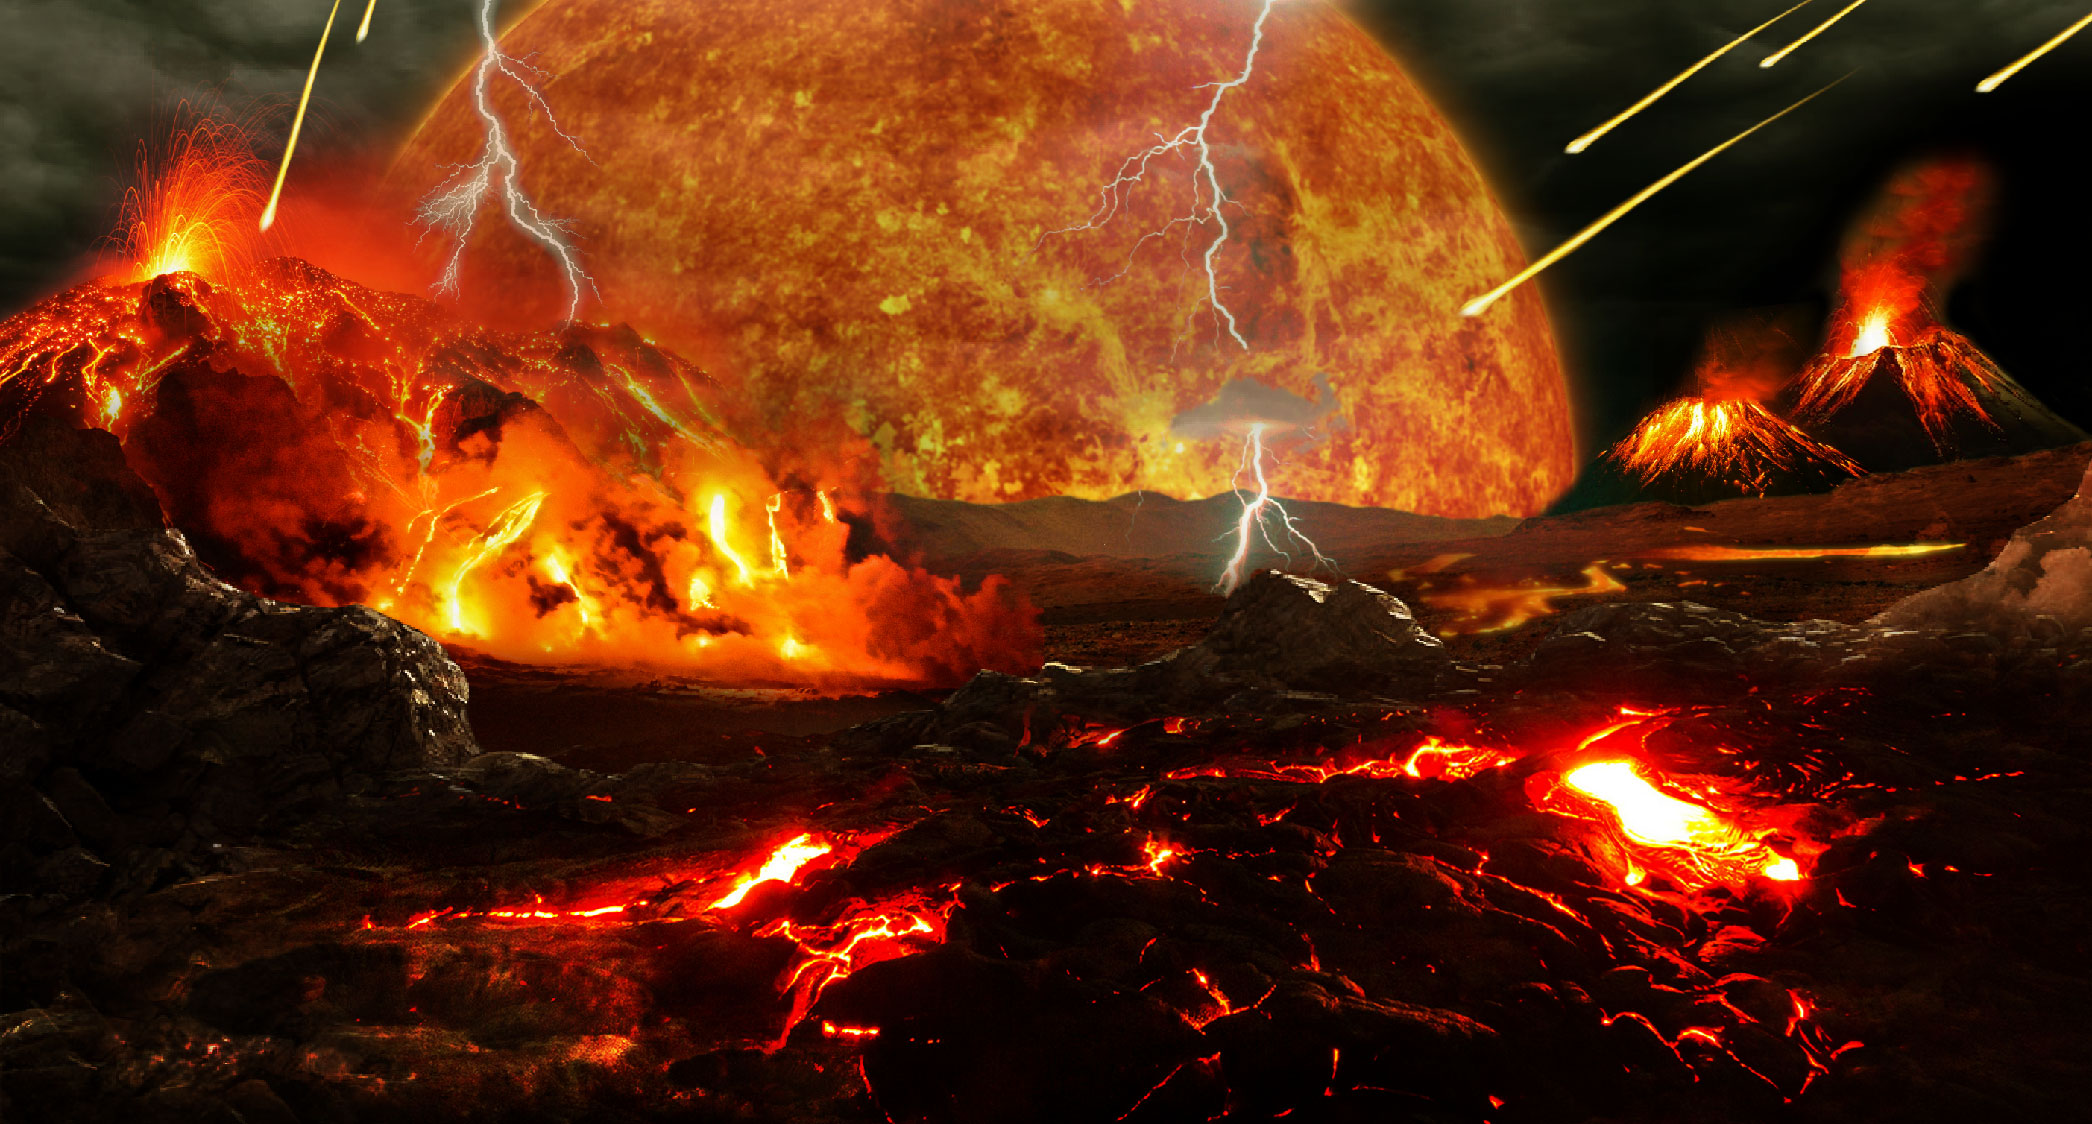
Artistic reconstruction of Earth during the Hadean. Image by Tim Bertelink (Wikimedia Commons, Creative Commons Attribution-ShareAlike 4.0 International license).
Oxygen
Earth's early atmosphere had little oxygen (O2). Cyanobacteria—a group of bacteria sometimes also "blue-green algae" for their unusual color—appeared perhaps as early as 3.5 billion years ago. These bacteria lived in the ocean and made their own food through photosynthesis. Photosynthesis is a process that coverts carbon dioxide and water to sugar and oxygen in the presence of sunlight. The sunlight serves as an energy source for the reaction. The sugar produced by photosynthesis is a food source, whereas the oxygen is released as a waste product.
Cyanobacteria sometimes produce layered structures called stromatolites that can be found in the fossil record. The oldest stromatolites are from Australia and are about 3.5 billion years old.
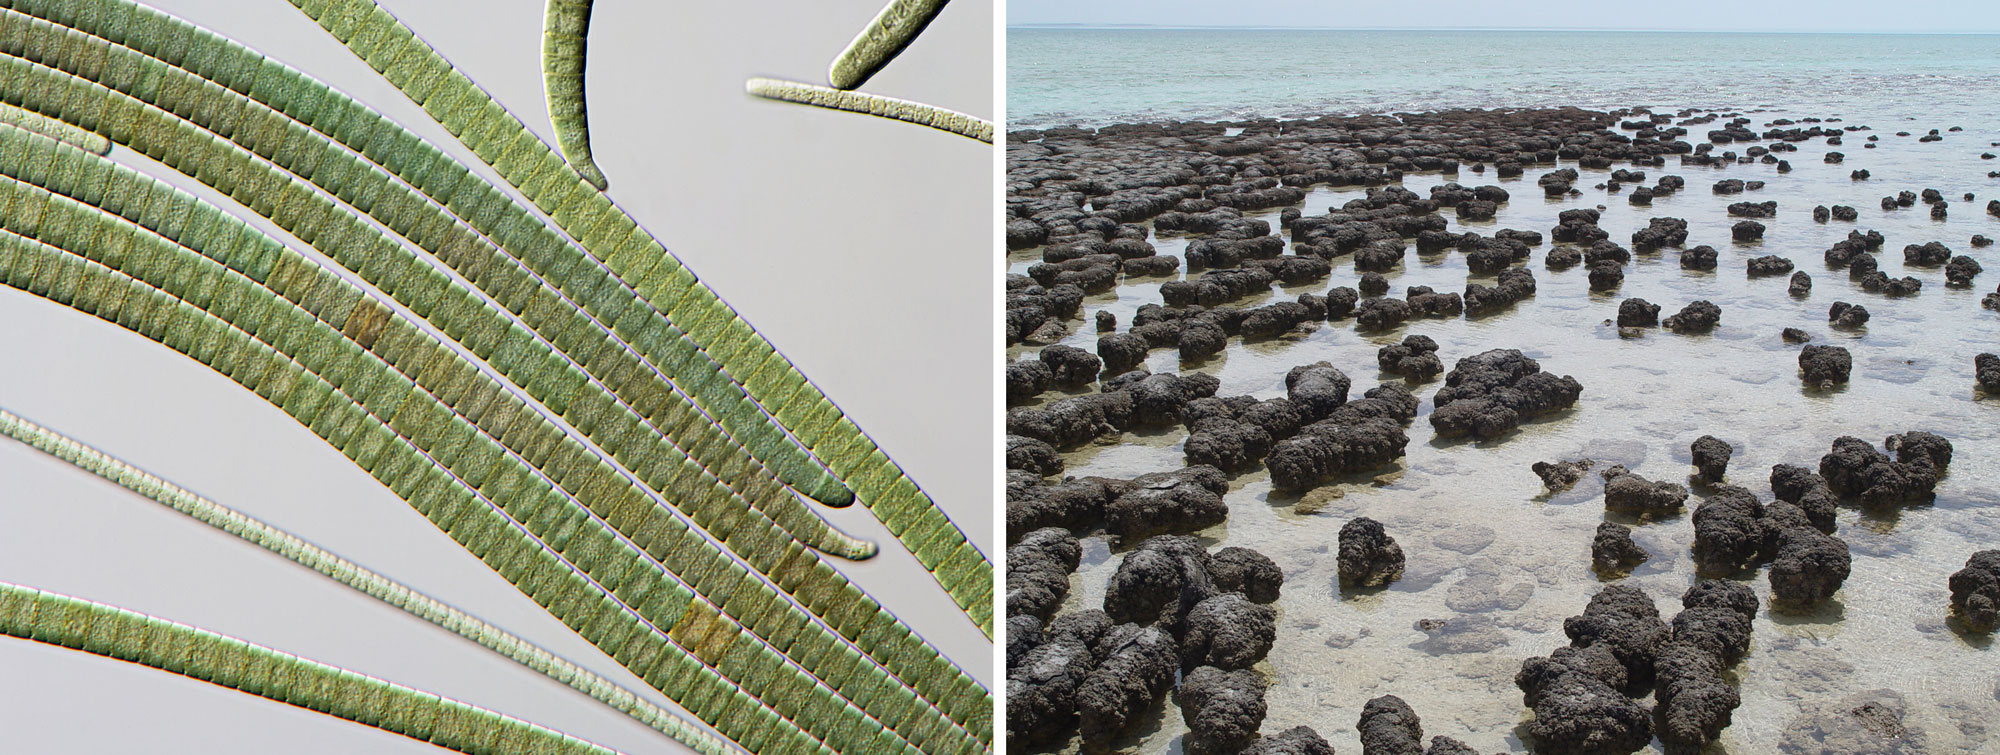
Modern cyanobacteria and stromatolites. Left: Modern filamentous cyanobacteria (Oscillatoria) made up of chains of cells, as seen under a microscope. Photo by Wiedehopf20 (Wikimedia Commons, Creative Commons Attribution-ShareAlike 4.0 International license, image cropped and resized). Right: Modern stromatolites, Shark Bay, Western Australia. Photo by Paul Harrison (Wikimedia Commons, Creative Commons Attribution-ShareAlike 3.0 Unported license, image cropped).
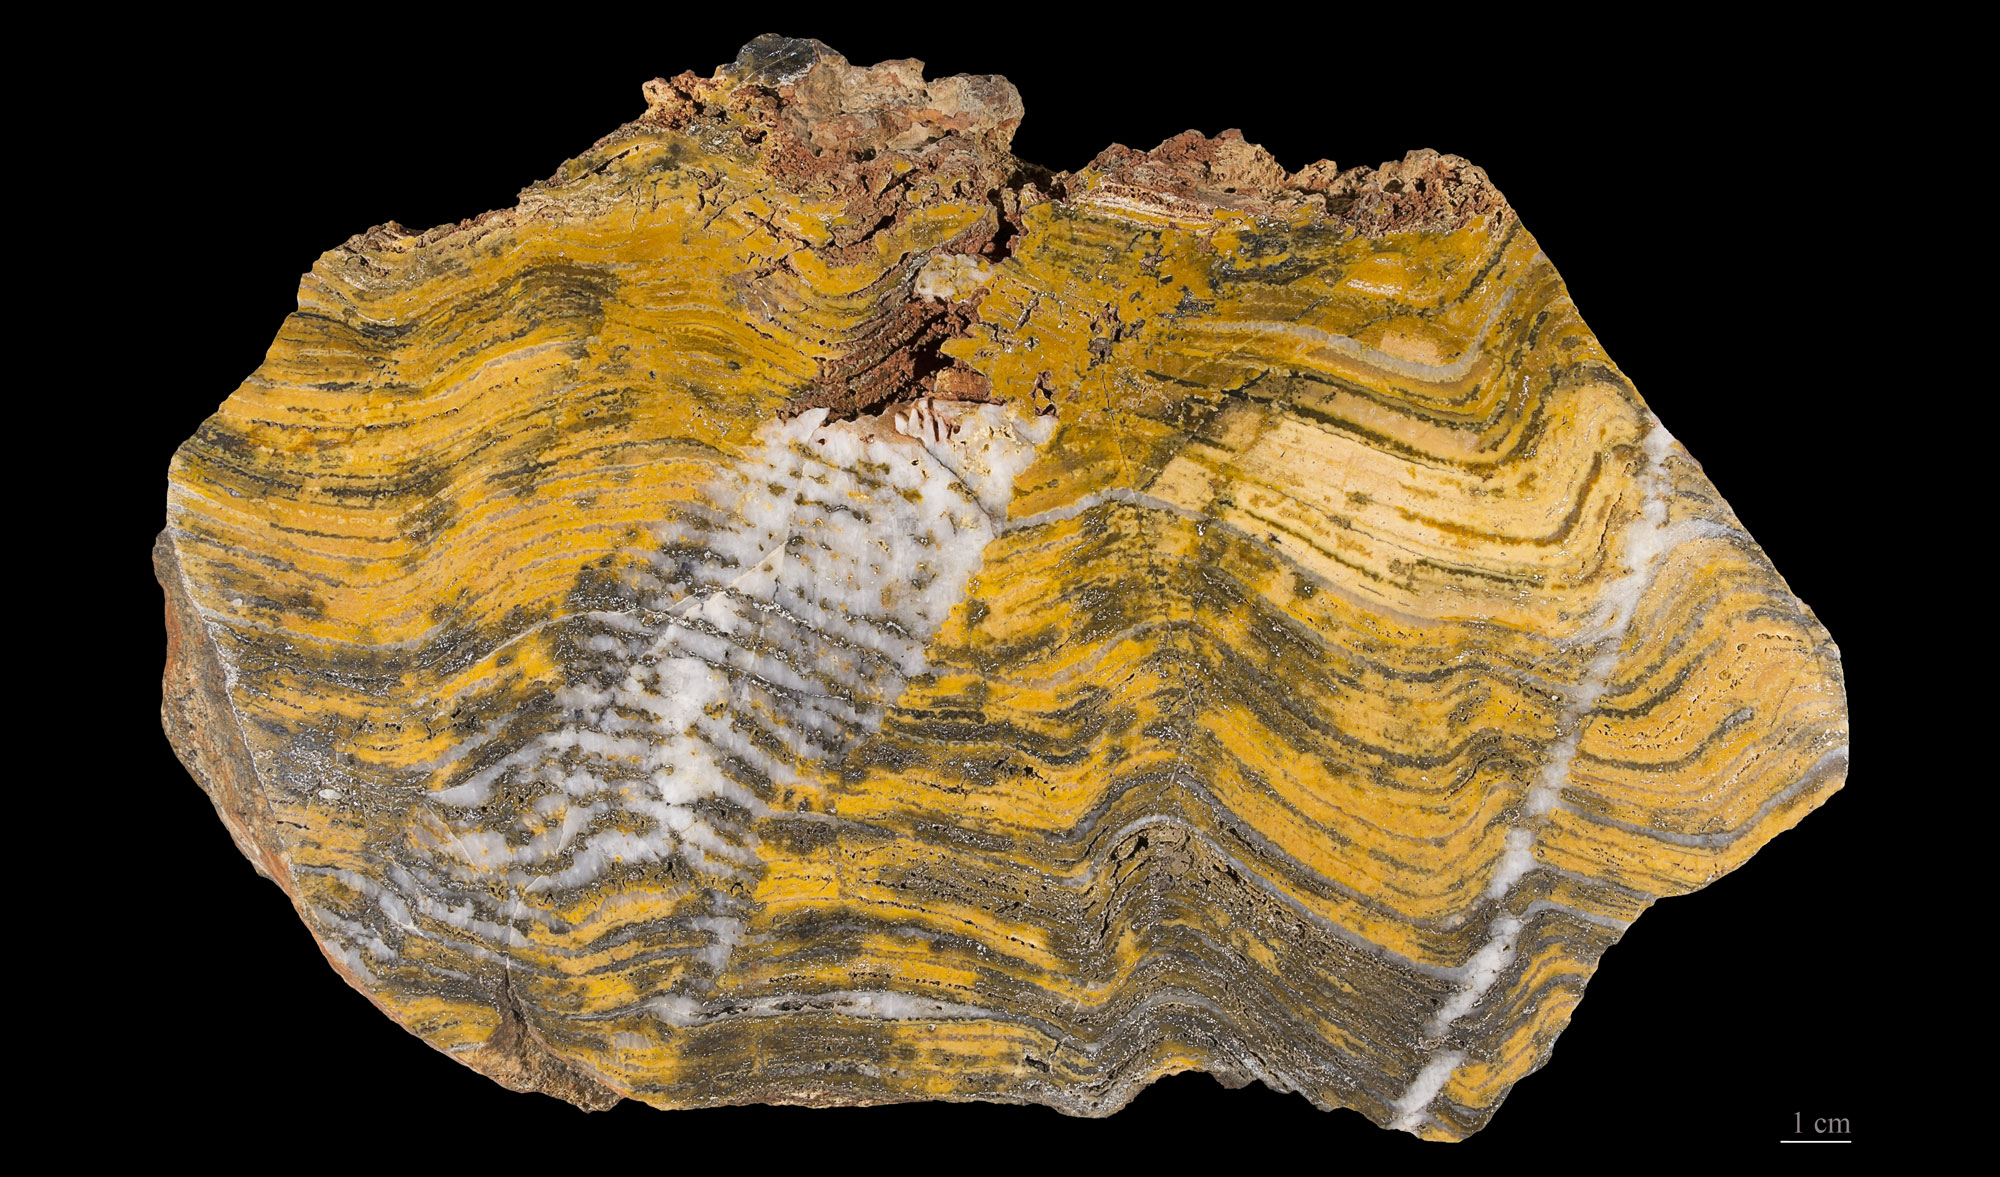
Archean stromatolite (3.6 to 3.2 billion years old) from Pilbara Craton, Western Australia. This rock has been cut to show the layering of the stomatolite. Photo by Didier Descouens (Wikimedia Commons, Creative Commons Attribution 4.0 Internations license, image cropped and resized).
The cyanobacteria released oxygen into the early oceans. The oxygen did not immediately start to build up in the atmosphere, however, because it was quickly absorbed by reactions with the abundant iron and organic matter present on Earth. Evidence for the absorption of oxygen on the early Earth occurs in some geological deposits like banded iron formations. These ancient rocks have iron-rich layers that formed when dissolved iron particles reacted with oxygen in the ocean to form iron-oxide minerals like hematite (Fe2O3) and magnetite (Fe3O4).
After hundreds of millions of years, much of the iron and organic matter had combined with oxygen, so much less oxygen could be absorbed by these sinks. Thus, free oxygen could finally build up in the atmosphere. With this addition, the modern atmosphere was complete, although the relative amounts of the gases composing it would, and still continue to, shift.
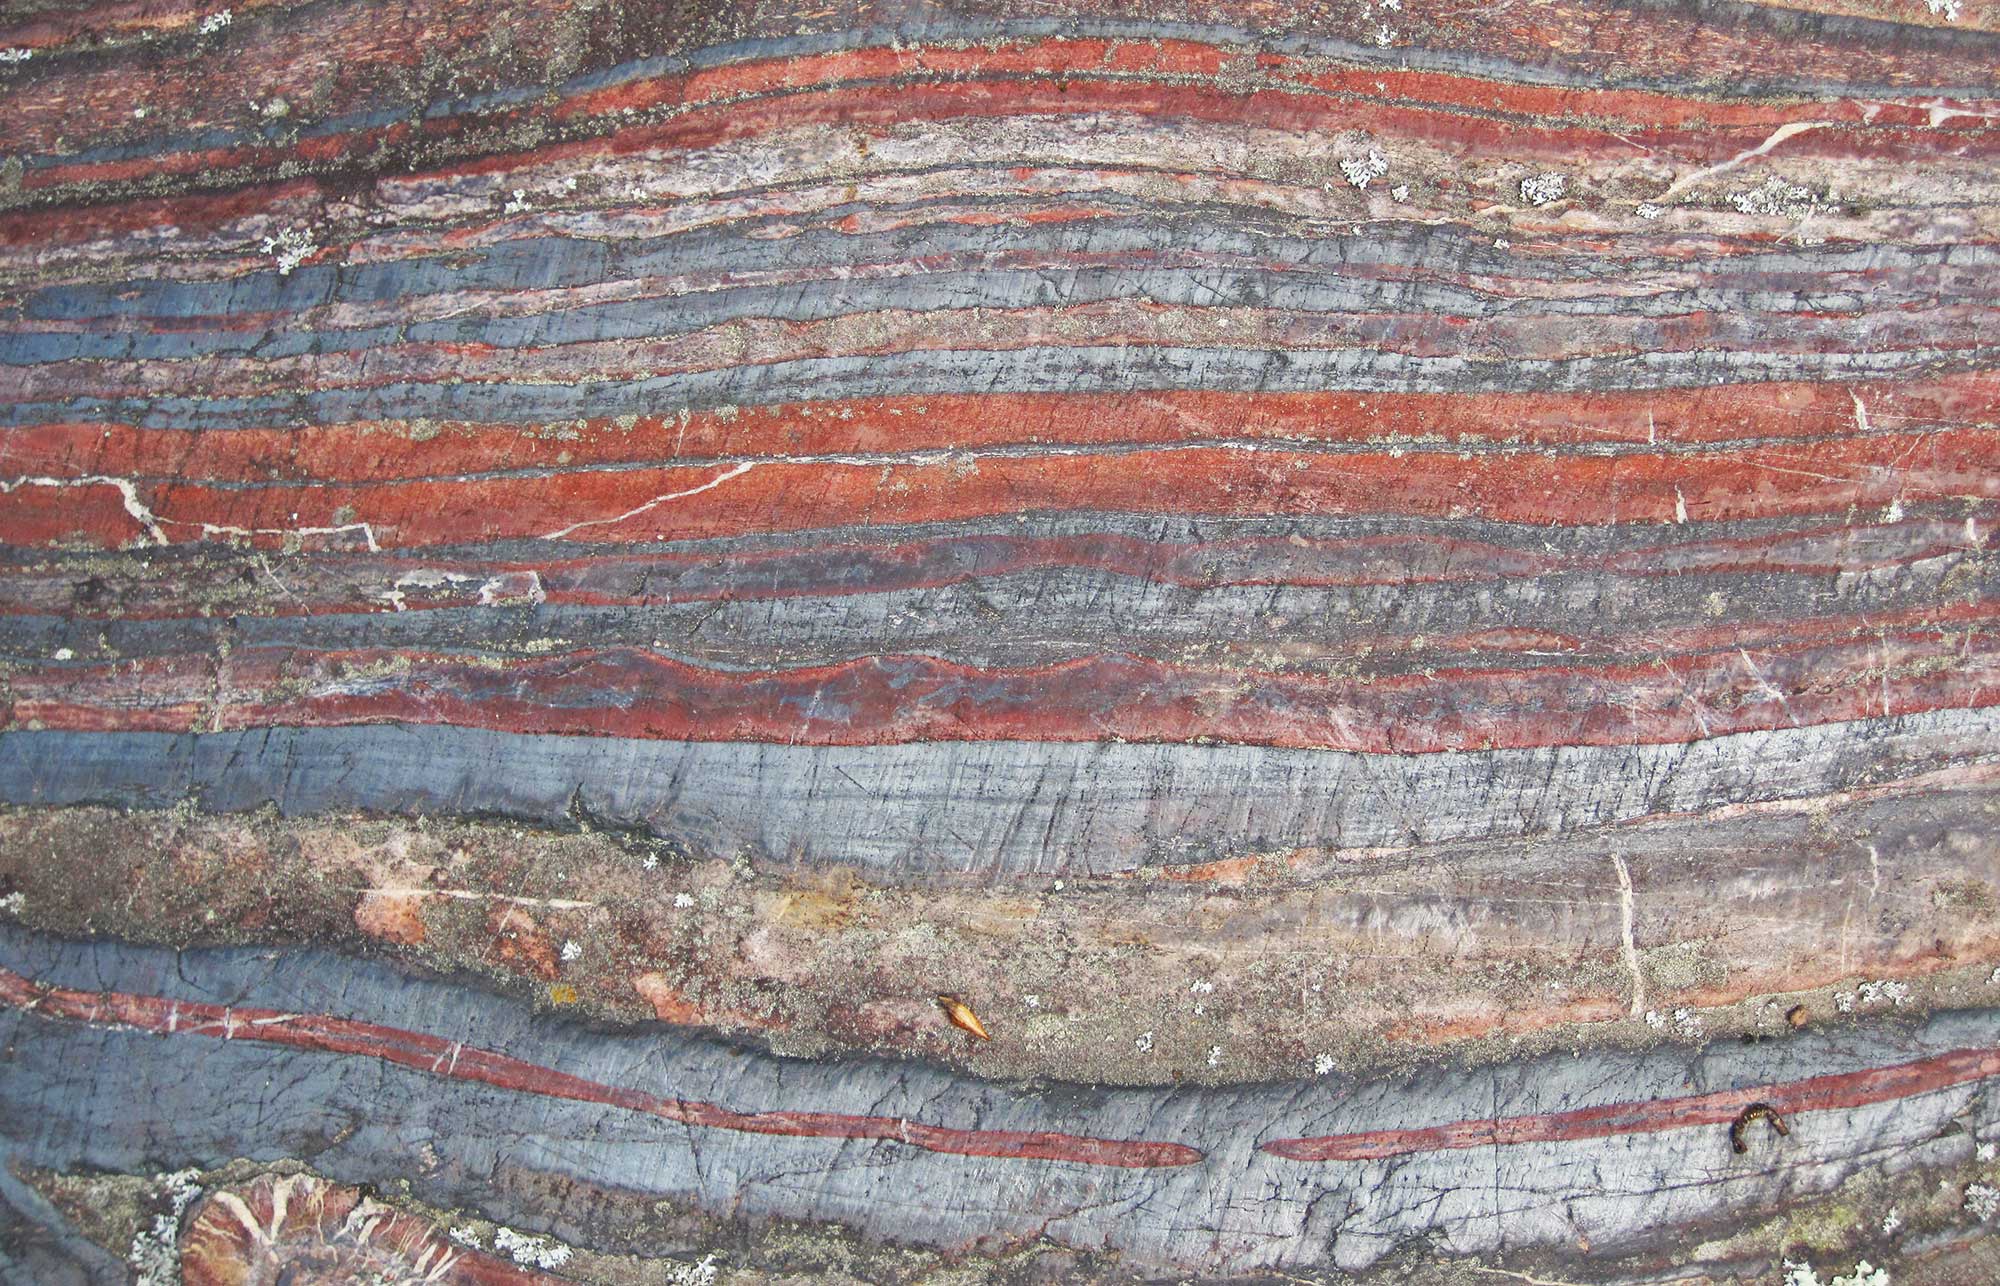
Banded iron formation (jaspilite) from the Soudan Iron-Formation, Minnesota, about 2.722 billion years old. Excerpt from original caption: "The light-colored layers are chert (= microcrystalline to cryptocrystalline quartzose sedimentary rock), the red layers are 'jasper' (= hematite-rich chert), and the silvery-gray layers are magnetite-chert." Information from and photo by James St. John (flickr, Creative Commons Attribution 2.0 Generic license, image cropped and resized).
Proterozoic climate (2.5 billion to 541 million years ago)
Paleoproterozoic to Mesoproterozoic climate (2.5 to 1 billion years ago)
There is evidence suggesting that the entire surface of the planet has been covered in ice several times, a hypothesis called Snowball Earth. Glacial deposits discovered near Lake Huron and elsewhere show that starting about 2.4 billion years ago the entire surface of the Earth may have been covered in ice for as long as 300 million years. In North America, this event is known as the Huronian glaciation. At that time the continental plates covered less than half as much of the Earth's surface as they do today and were unified as the continent Arctica.
It is possible that oxygen produced by microorganisms during this time reacted with methane in the atmosphere. Methane is a potent greenhouse gas. If its concentration in the atmosphere was lowered, it may have tipped the Earth toward a series of cooling feedbacks that caused ice to spread from pole to pole.
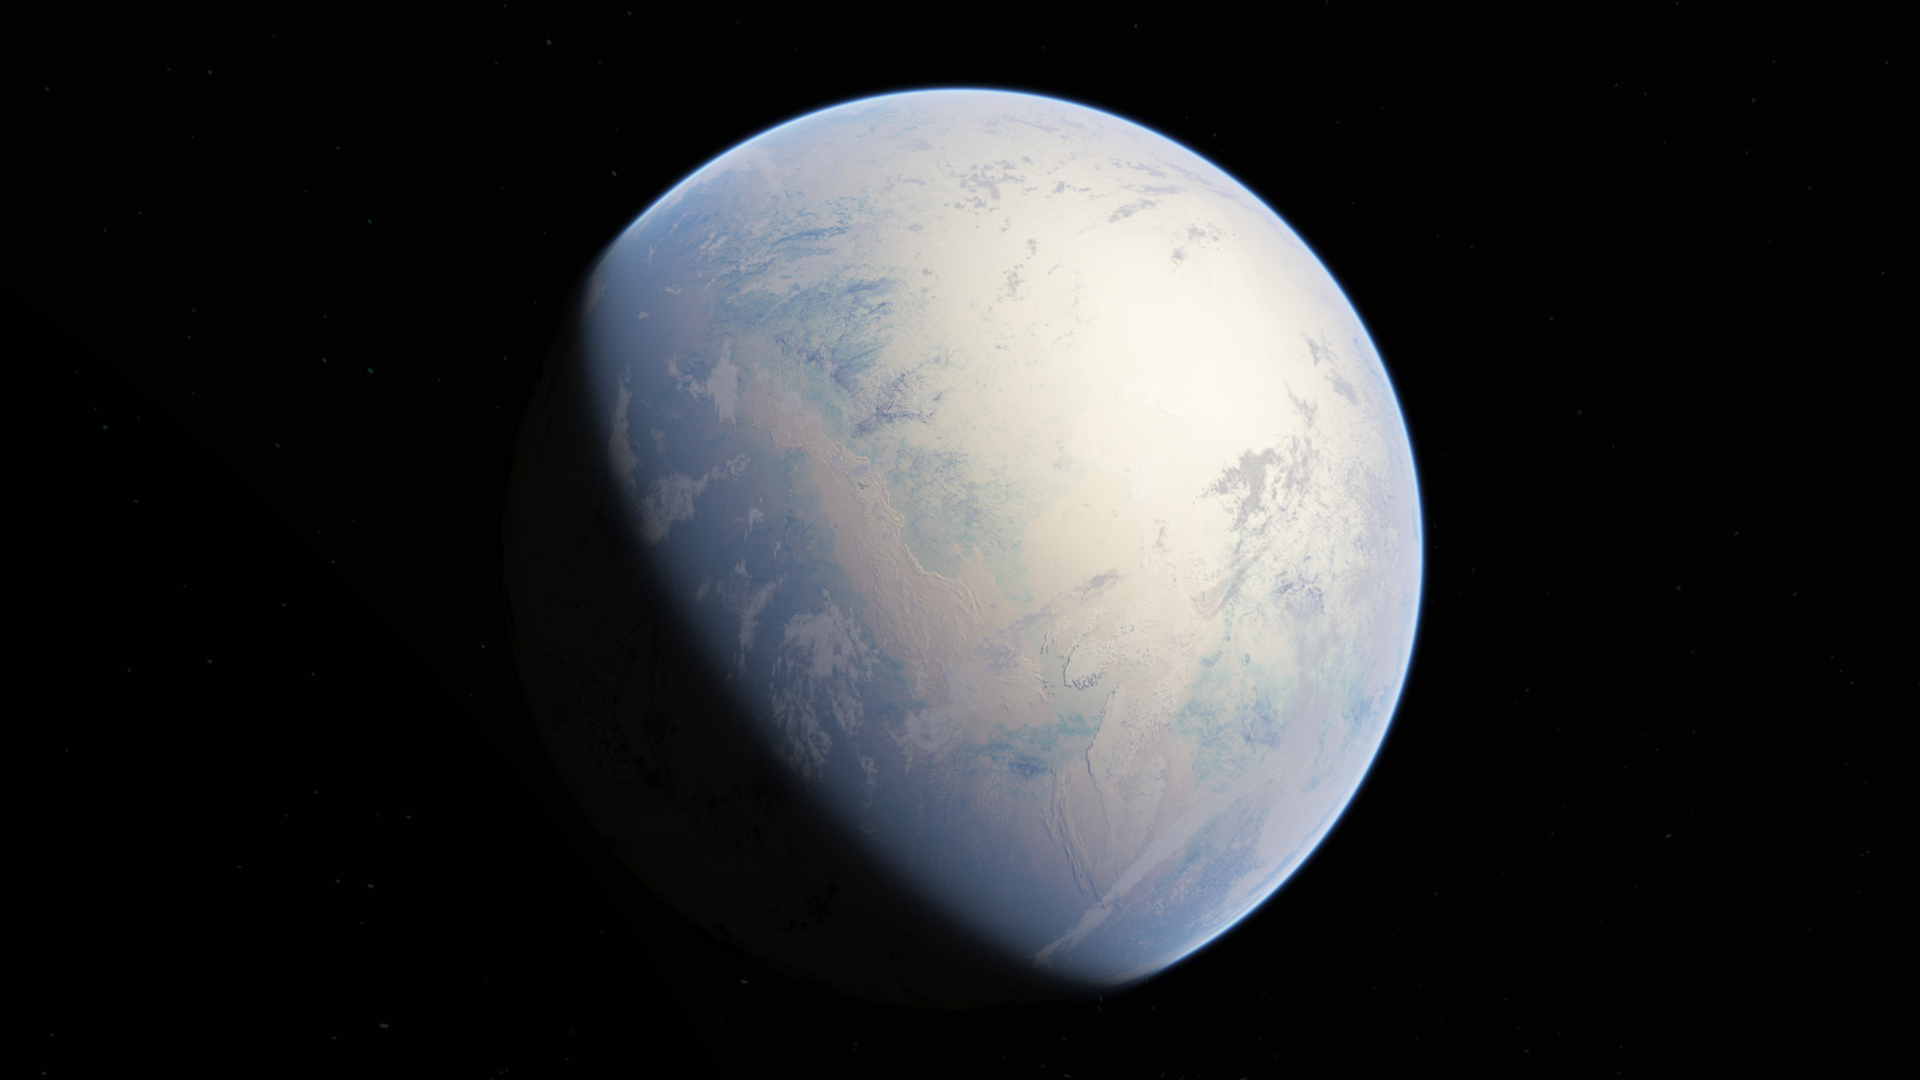
An artistic reconstruction of Earth during the Huronian Glaciation. Image by Oleg Kuznetsov (Wikimedia Commons, Creative Commons Attribution-ShareAlike 4.0 International license).
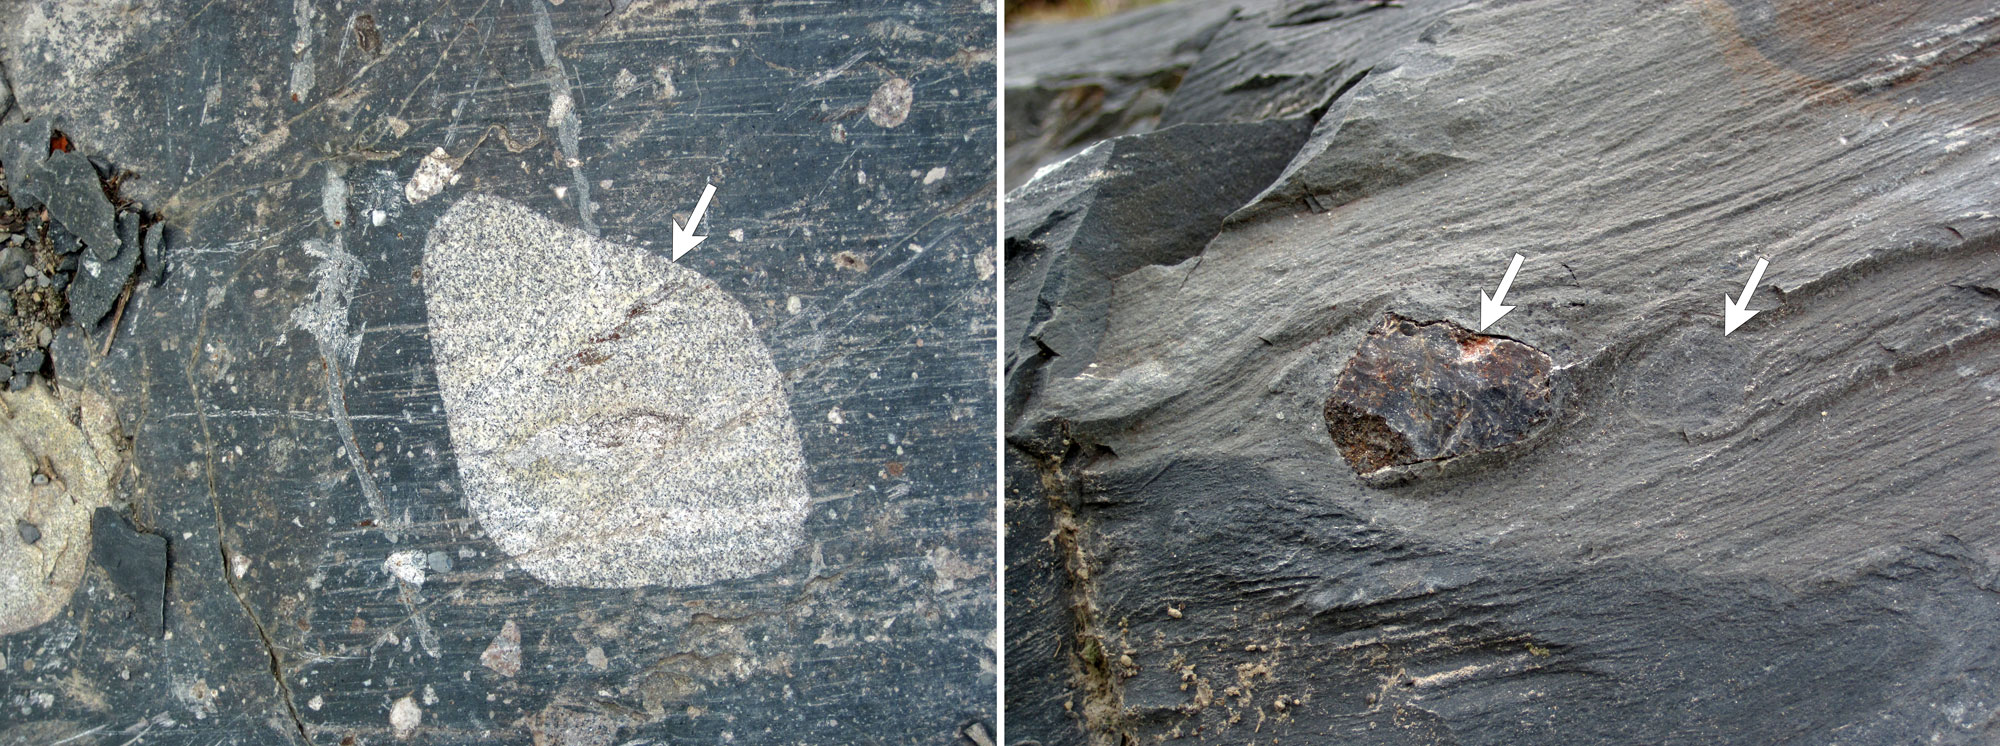
Glacial deposits of the ca. 2.3 billion-year-old Gowganda Formation, Huronian Supergroup, Ontario, Canada. Left: Tillite, a rock formed from glacially deposited till. In this rock, larger cobbles can be seen embedded in a finer-grained matrix (the arrow indicates a large cobble). The striations on the rock were caused by much younger Pleistocene glaciers. Information from and photo by James St. John (flickr, Creative Commons Attribution 2.0 Generic license, image cropped and resized). Right: Argillite, a hard rock formed from mudstone, containing glacial dropstones (indicated by the arrows). The dropstones are stones that were deposited when they melted out of glacial ice. Information from and photo by James St. John (flickr, Creative Commons Attribution 2.0 Generic license, image cropped and resized).
An ice-covered planet might remain that way because the ice will reflect almost all of the sun's energy back into space, preventing warming. (In other words, little of the sun's heat would be absorbed by the Earth.) The Earth did not remain cold because of plate tectonics. Volcanoes continued to erupt, dumping carbon dioxide (CO2) and methane into the atmosphere. Although these greenhouse gases are usually removed from the atmosphere by organisms (for example, during photosynthesis) and the weathering of rocks, the widespread ice impeded these processes.
After millions of years, the concentrations of methane and CO2 increased to the point that greenhouse warming began to melt the ice sheets. Once the melting started, more of the sun's energy was absorbed by the Earth's surface, and warming feedbacks began. Because the oceans had been covered with ice, nutrients from volcanic gases and chemical changes in submerged rocks had accumulated in ocean waters. Once the oceans were again exposed to light, the light and accumulated nutrients drove an explosion in the population of cyanobacteria. The cyanobacteria produced more and more oxygen through photosynthesis. This oxygen combined with carbon from freshly thawed sources, making carbon dioxide, which further enhanced warming.
For the next 1.5 billion years, the continental crust that was to become North America drifted around the surface of the Earth. A new supercontinent called Rodinia formed about 1.1 billion years ago.
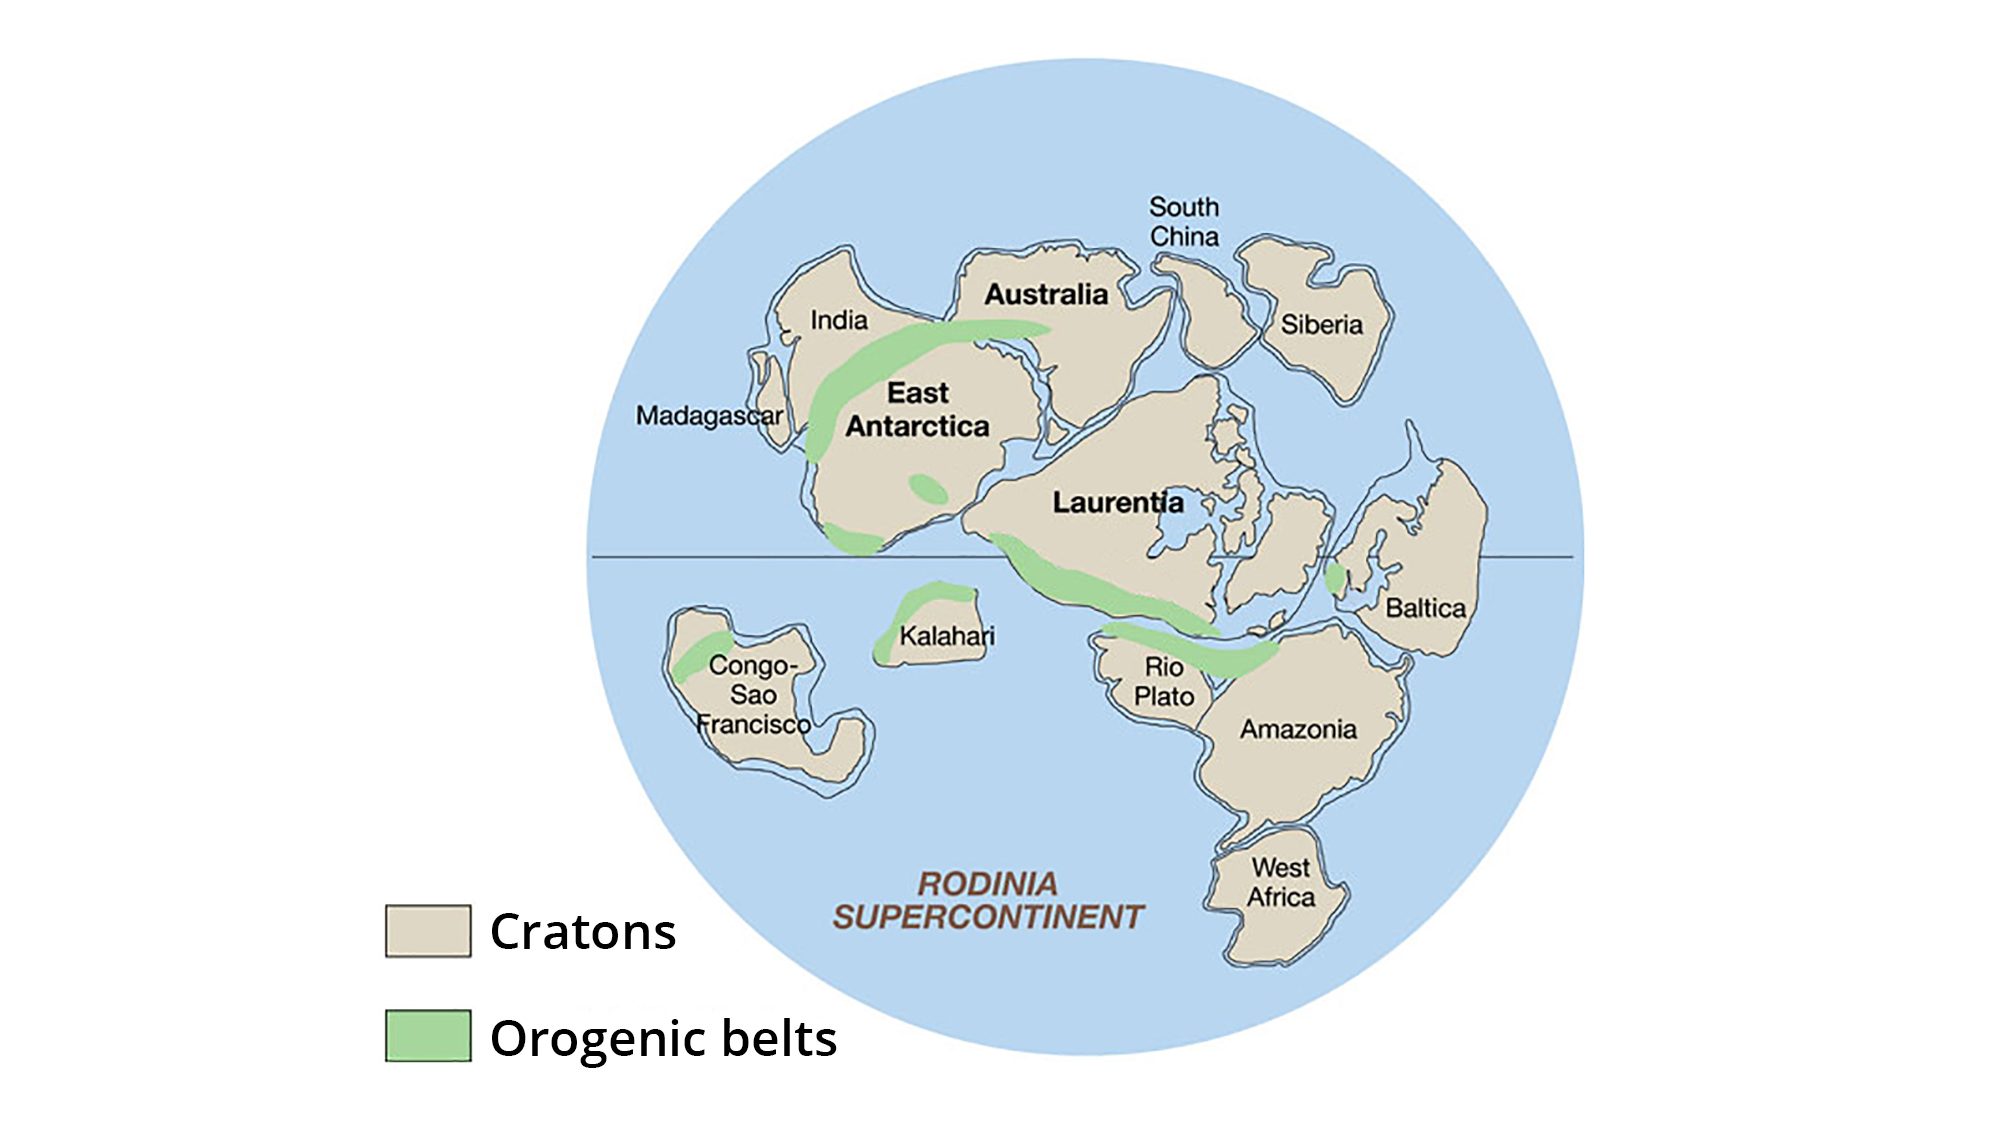
The supercontinent Rodinia, around 1.1 billion years ago. Laurentia represents proto-North America. Note that what is eastern North America today is on the southern margin of Laurentia, and that today's eastern North America is near the equator. Orogenic belts are regions where mountain-building is occurring, whereas cratons are stable, tectonically quiet regions. Image adapted from original created by John Goodge for the United States Geological Survey (public domain).
Neoproterozoic climate (1 billion to 541 million years ago)
Perhaps beginning late in the Tonian Period (about 1 billion to about 720 million years ago) and continuing throughout the Cryogenian period (about 720 to 635 million years ago), the Earth entered a 200-million-year ice age during which there were several intervals of glaciation. Two extensive periods of glaciation occurred during this time, called the Sturtian glaciation (717 to 660 million years ago) and the Marinoan glaciation (640 to 635 million years ago). Although the part of Rodinia that would eventually become North America was located near the equator, it was glaciated. The fact that North America was at such a low latitude yet had glaciers is strong evidence that the Earth really did freeze over completely.
At the end of the Cryogenian, about 635 million years ago, the prolonged ice age came to an end, and the following Ediacaran period saw the flourishing of complex multicellular life forms.
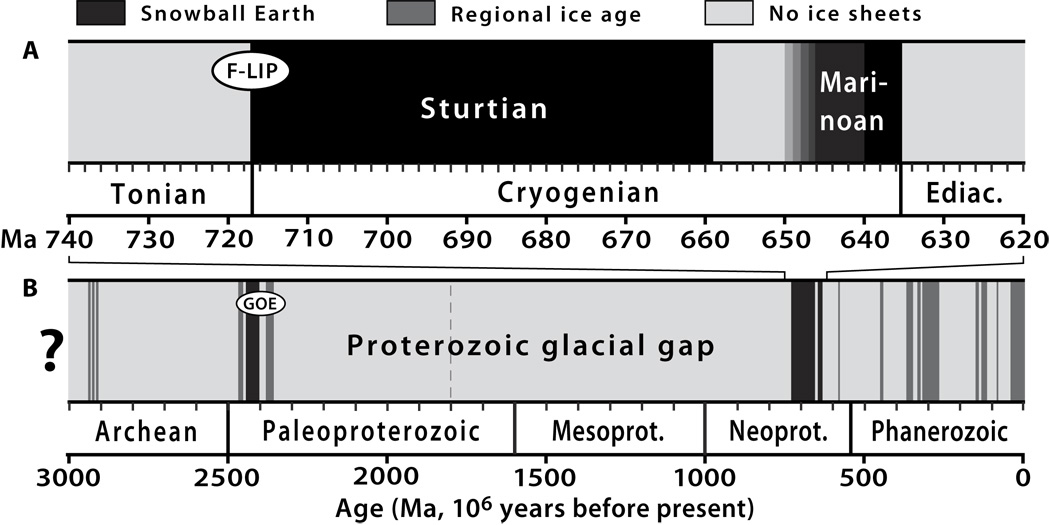
A. Duration of the Sturtian and Marinoan glaciations in the Cryogenian. The time scale stars at 740 million years ago and goes to about 620 million years ago. B. Geologic time scale from 3 billion years ago to the recent showing glacial intervals. Black lines indicate Snowball Earth events, dark gray lines indicate regional glaciations, and light gray intervals are intervals with no significant glaciation. F-LIP marks the Frankline large igneous province event, GEO marks the Great Oxidation Event, an event during which oxygen levels in the atmosphere rose. Figure 2 from Hoffman et al. (2017) Science 3: e1600983 (Creative Commons Attribution-NonCommercial 4.0 International license).
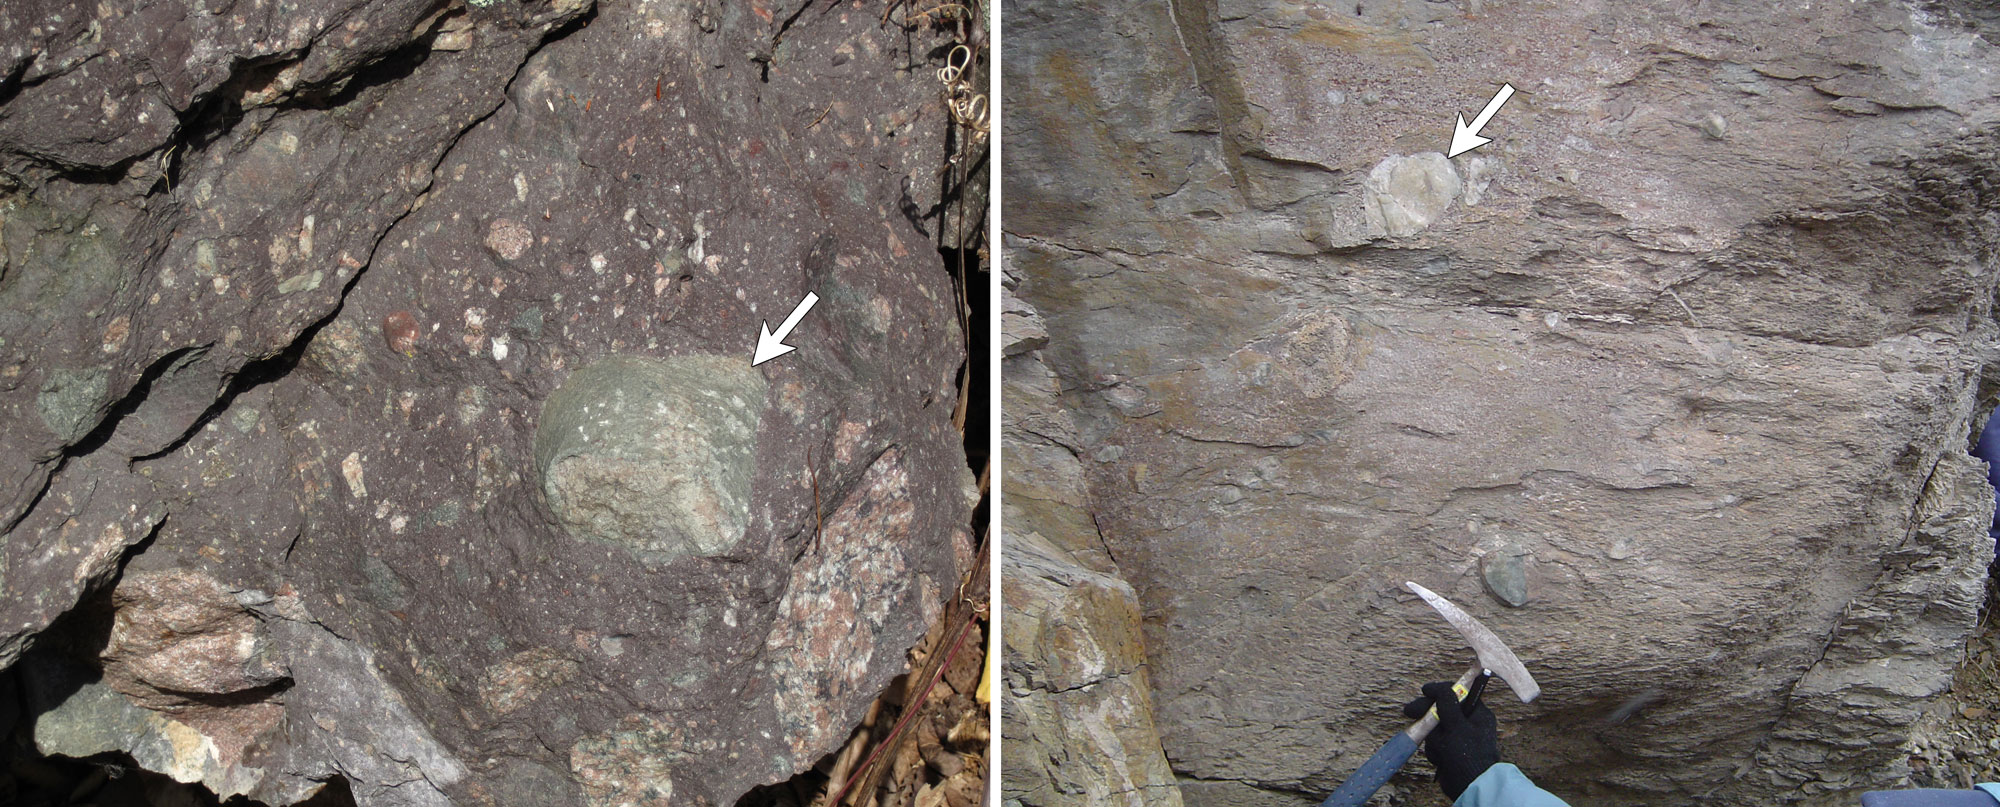
Diamictites associated with the Sturtian glaciation, Tonian to Cryogenian Period. The deposition of the sediments that make up these rocks is thought to have been associated with glacial activity. The arrows indicate large clasts (cobbles) that are preserved in the rock. Left: Konnarock Formation, about 750 million years ago, Virginia. Information from and photo by James St. John (flickr, Creative Commons Attribution 2.0 Generic license, image cropped and resized). Right: Pocatello Formation, Idaho. Photo by Qfl247 (Wikimedia Commons, Creative Commons Attribution-ShareAlike 3.0 Unported license, image cropped).
The Phanerozoic: Ancient Life and Climate
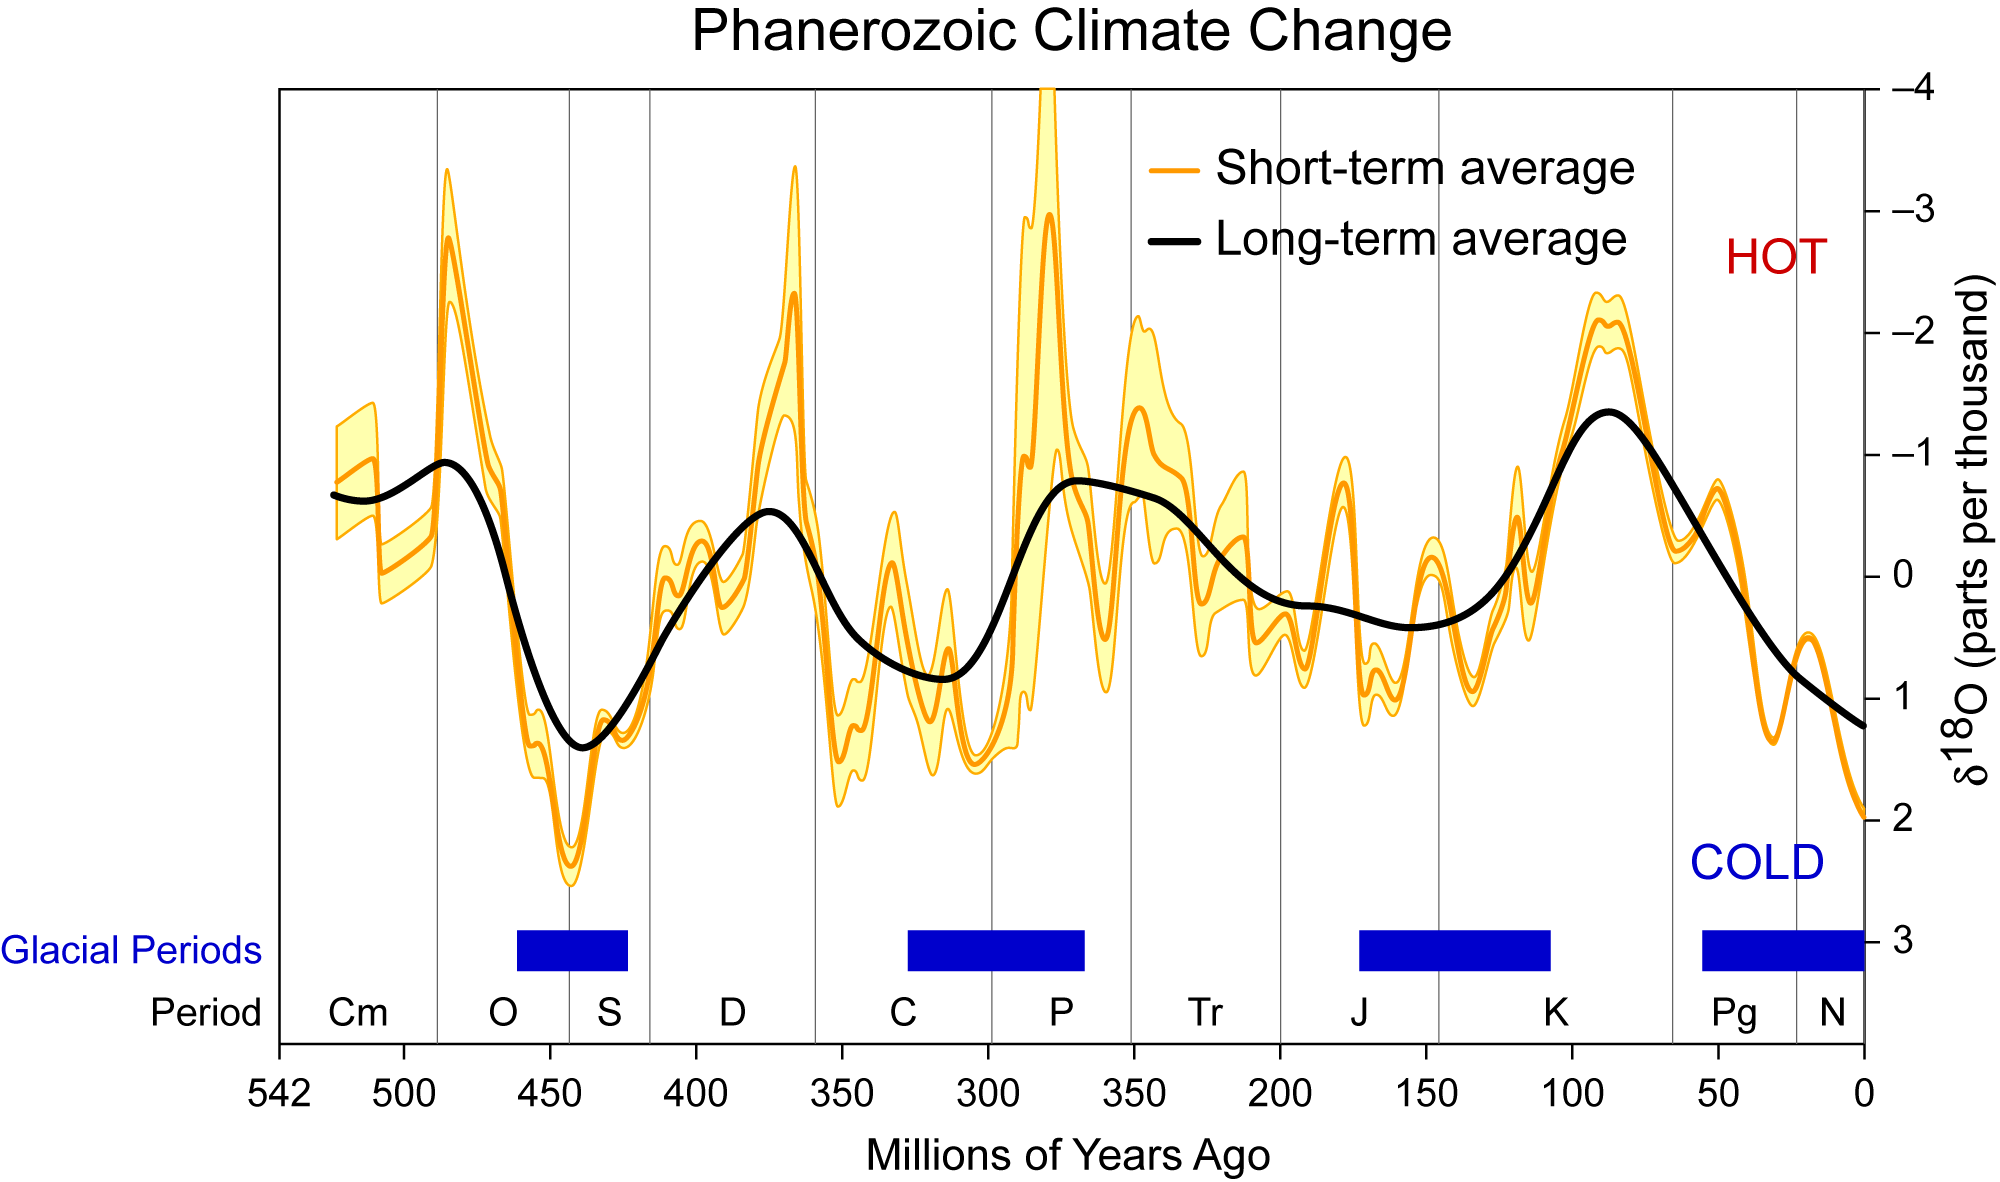
Changing global climate throughout the last 542 million years. These data were compiled using the ratios of stable isotopes found in ice cores and the carbonate skeletons of fossil organisms. Period: Cm = Cambrian, O = Ordovician, S = Siluria, D = Devonian, C = Carboniferous, P = Permian, Tr = Triassic, J = Jurassic, K = Cretaceous, Pg = Paleogene, N = Neogene. Diagram by Zieben007 (Wikimedia Commons, Creative Commons Attribution-ShareAlike 4.0 International license, image resized).
Paleozoic climate (541 million years ago to 252 million years ago)
Cambrian to Ordovician (541 to 444 million years ago)
With the start of the Paleozoic era, climates across the world were warm, and North America (at this time called Laurentia) was located in the low, warmer latitudes of the Southern Hemisphere. As the Cambrian progressed, Laurentia moved northward. Cambrian fossils of archaeocyathids, trilobites, brachiopods, and mollusks reveal that most of the continent was probably covered by warm, shallow seas that persisted into the Ordovician.
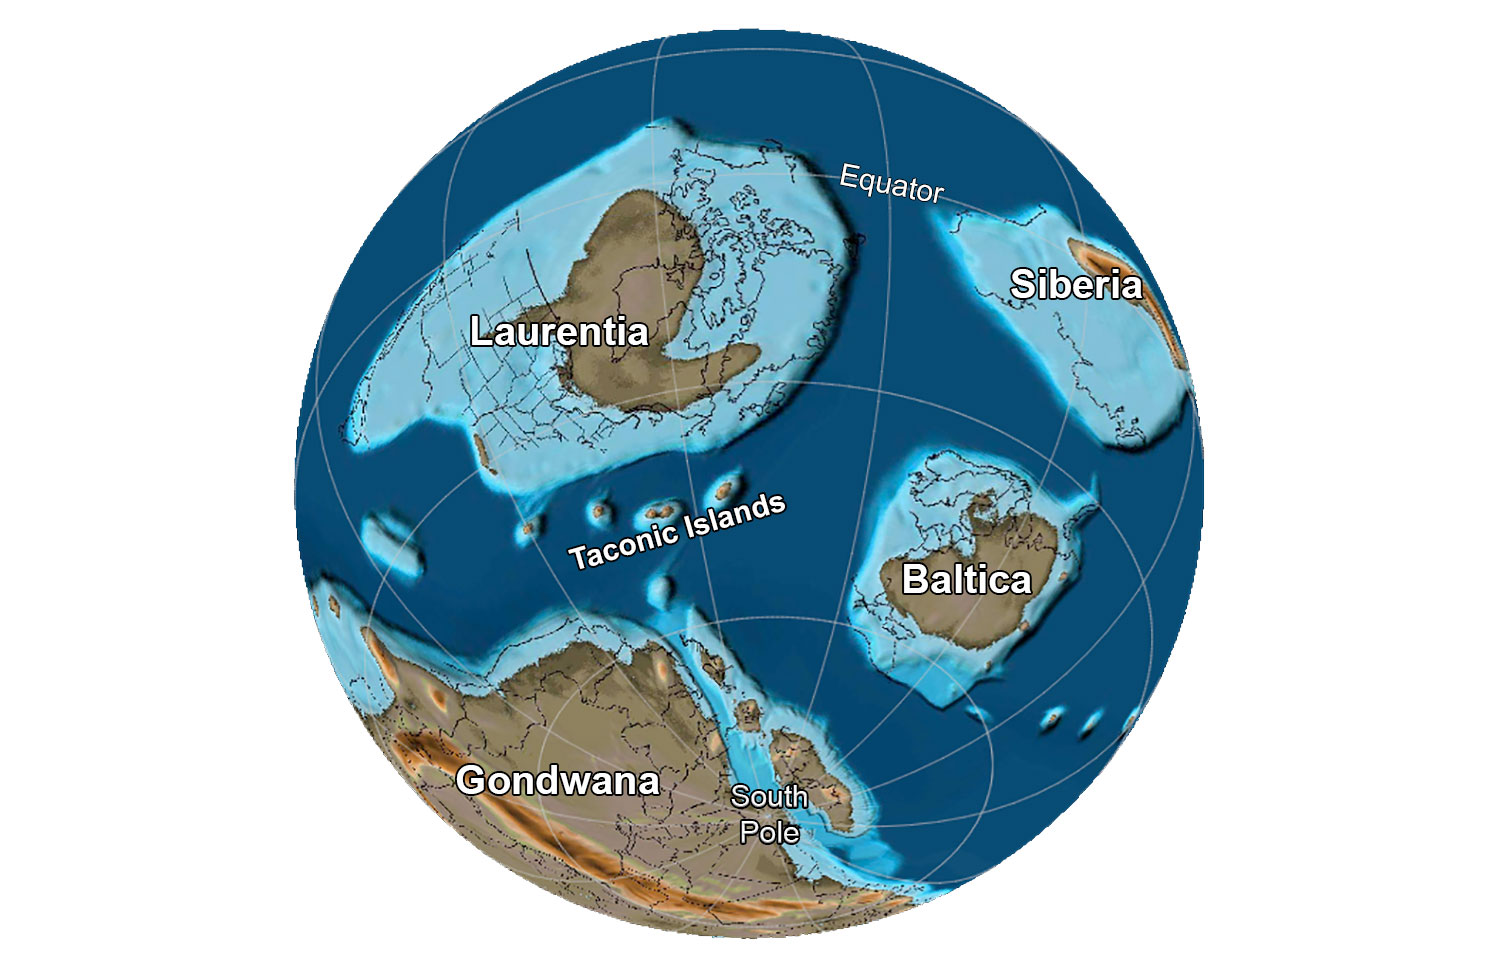
The globe about 485 million years ago, near the Cambrian-Ordovician boundary. Reconstruction created using basemap from the PALEOMAP PaleoAtlas for GPlates and the PaleoData Plotter Program, PALEOMAP Project by C. R. Scotese (2016); map annotations by Jonathan R. Hendricks for PRI's Earth@Home project (CC BY-NC-SA 4.0 license).
In the late Ordovician (about 460 to 430 million years ago), the Earth fell into another brief but intense ice age. Glaciers covered most Gondwana (the continent made up of present-day South America, Antarctica, Africa, Australia, and India), which was located over the South Pole. This led to global cooling. Although sea level dropped during this event, North America's climate relatively warm because the continent was near the equator.
Silurian to Permian (444 to 252 million years ago)
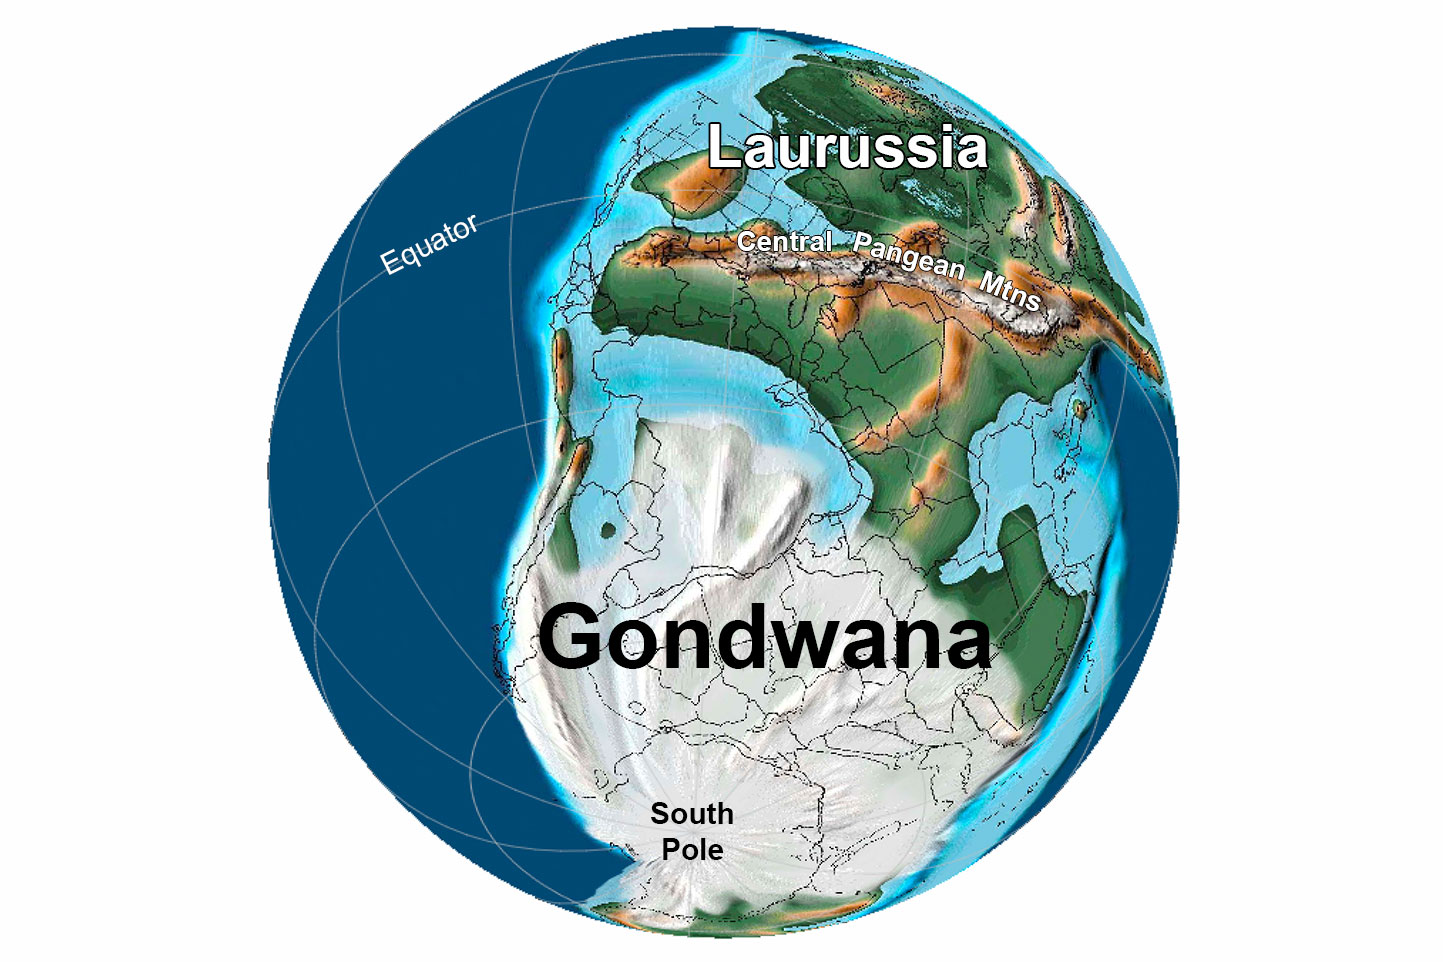
From 430 to 300 million years ago (from the mid-Silurian to nearly the end of the Carboniferous), ancient North America moved north across the equator, and the cycle of warming and cooling was repeated yet again. Glaciation in the Southern Hemisphere occurred during the late Devonian, when the supercontinent Gondwana was located over the South Pole.
During the Devonian, shallow seas were especially productive. In fact, plankton productivity became so high that it depleted all the oxygen from the seafloor and sediments. The lack of oxygen allowed organic matter to accumulate instead of decay, leading to the deposition of black, carbon-rich shale. Although all geologic periods have experience such deposits, some Devonian-age marine rocks that are currently especially important sources for natural gas and petroleum.
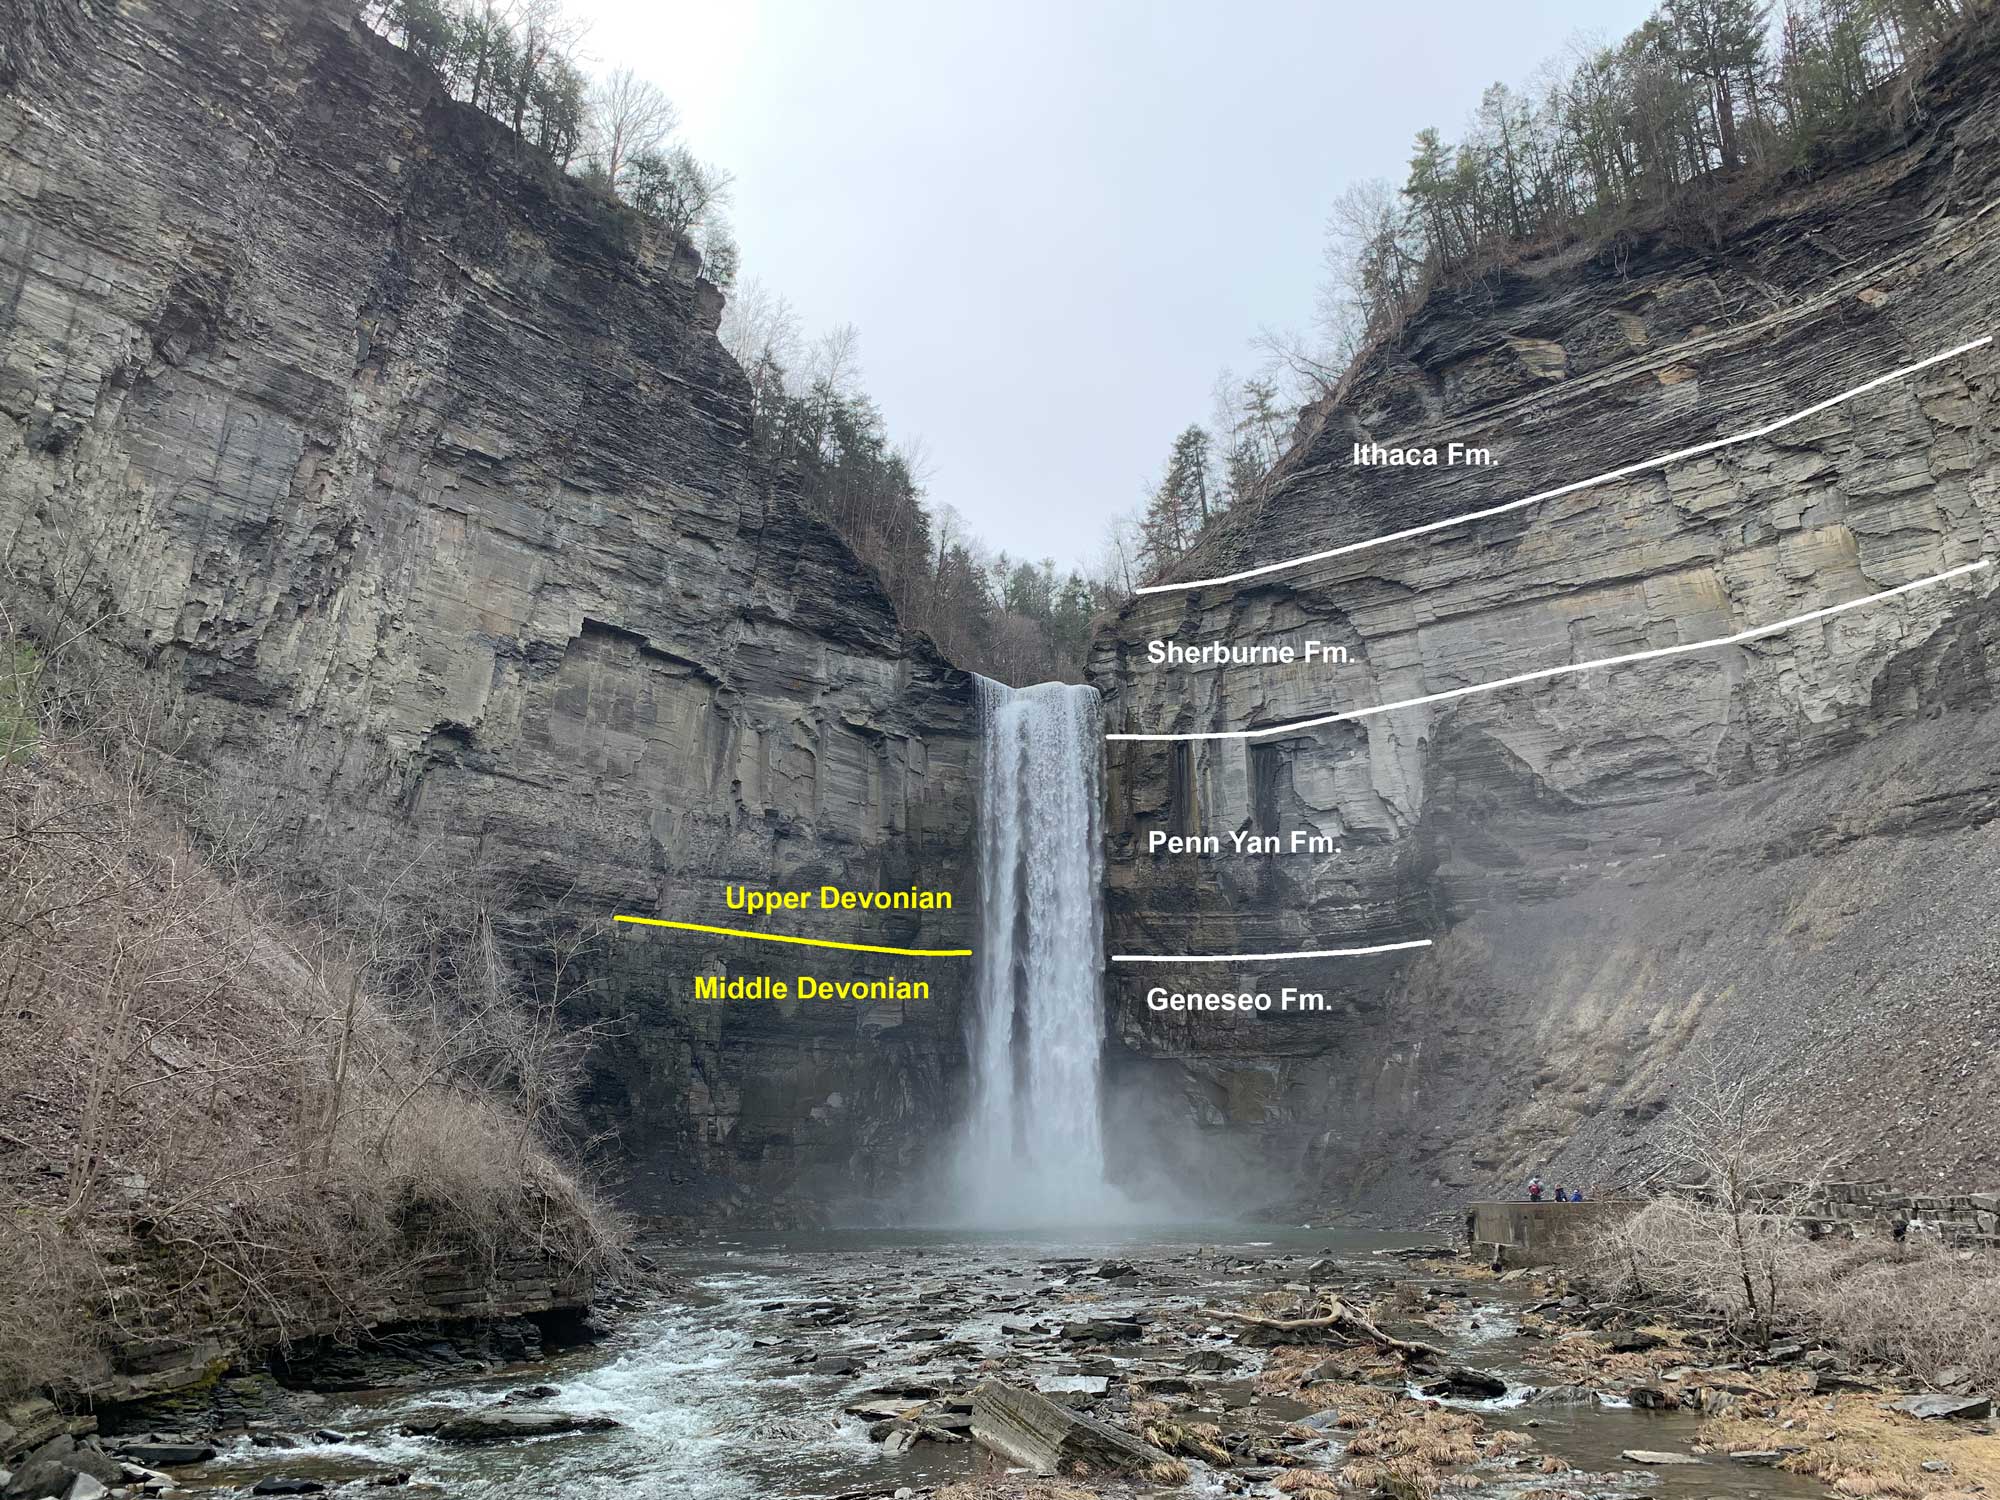
Taughannock Falls in New York, showing thick Devonian shale deposits with formations labeled. Taughannock Falls in about 65.5 m (215 feet) high. Photo and labels by Jonathan R. Hendricks.
In the late Devonian and early Carboniferous (Mississippian), complex terrestrial ecosystems developed, including the world's earliest forests. Plants took in carbon dioxide during photosynthesis to fuel their growth, and they used this carbon to build tissues. As the plants died, thick, organic peat deposits accumulated that locked away carbon; over time, these peats became that coal deposits.
As plants lowered the amount of carbon dioxide in the atmosphere, their growth contributed to global cooling. By the early Carboniferous (Mississippi), ice capped the South Pole and began to expand northward. Although the Earth's temperature fell during this time and glaciers growing in the southern hemisphere caused sea levels to drop, North America still remained relatively warm because of its low-latitude position.
By the late Carboniferous (Pennsylvanian), North America—which was part of the continent of Laurussia—had collided with Gondwana. This collision was part of the formation of Pangaea, a supercontinent made up of nearly all the landmass on Earth. Global temperatures again declined, an glaciation continued near the South Pole. In unglaciated regions, extensive coal swamps grew. This ice age lasted well into the Permian, ending about 260 million years ago. The end of the Permian was a time of dry, warming conditions and lower sea levels.
Earth 300 million years ago, during the end of the Carboniferous Period (Pennsylvanian). Pangaea was completed when North America finally collided with Gondwana. Reconstruction created using basemap from the PALEOMAP PaleoAtlas for GPlates and the PaleoData Plotter Program, PALEOMAP Project by C. R. Scotese (2016); map annotations by Jonathan R. Hendricks & Elizabeth J. Hermsen for PRI's Earth@Home project (CC BY-NC-SA 4.0 license).
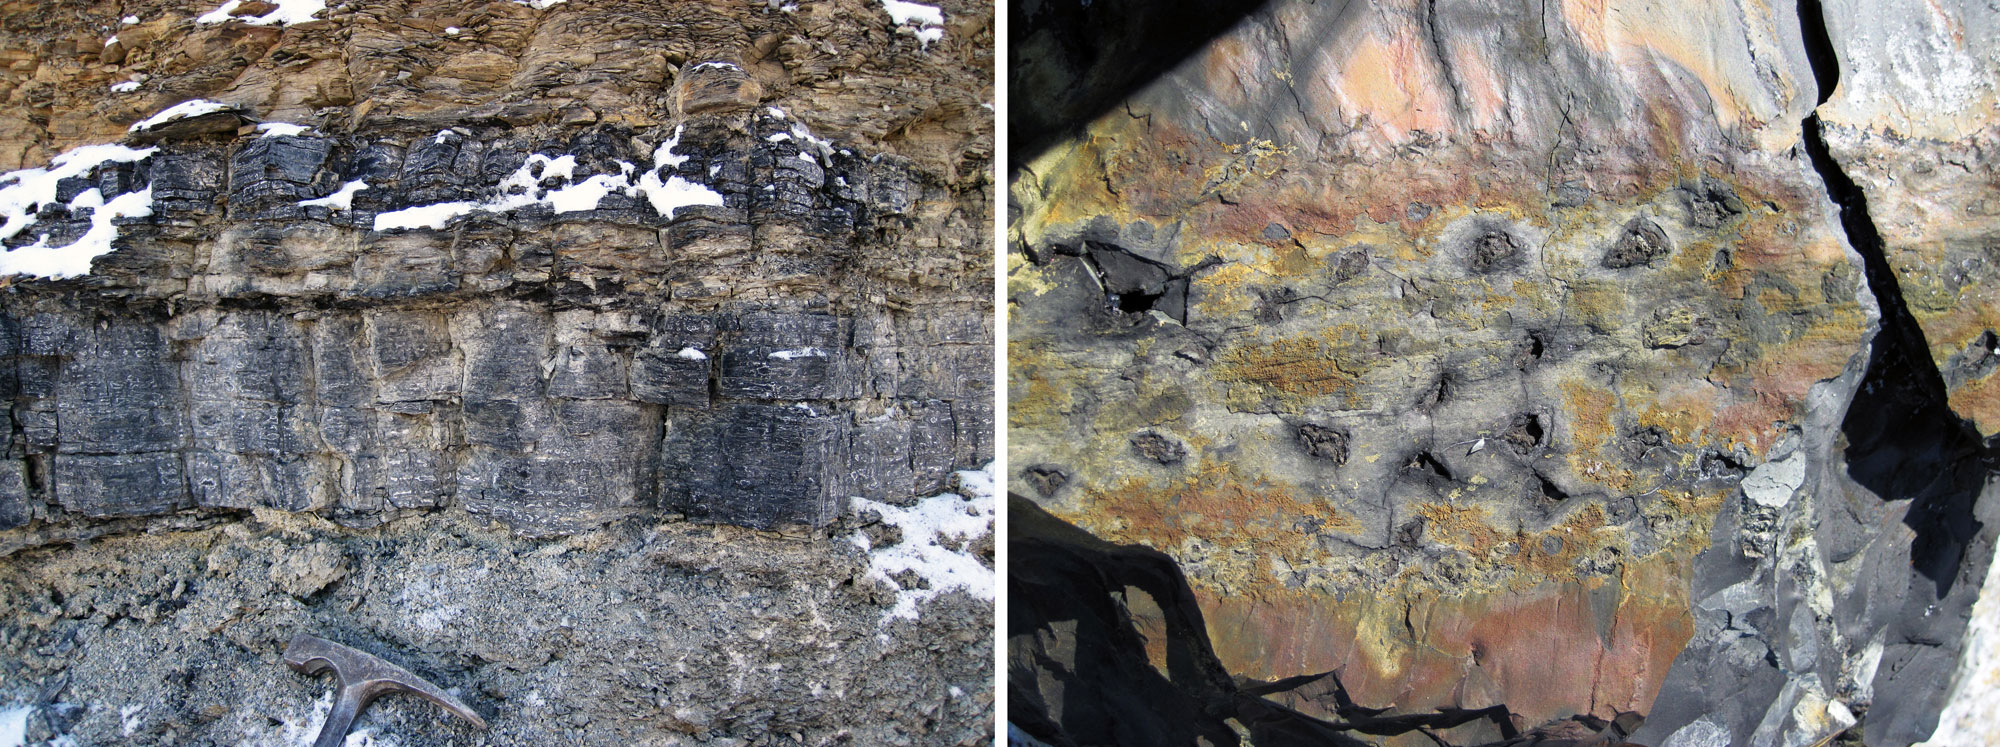
Bituminous coal deposits, middle Pennsylvanian Pikeville Formation, Breathitt County, Kentucky. Left: Thick coal layers. Information from and photo by James St. John (flickr, Creative Commons Attribution 2.0 Generic license, image cropped and resized). Right: Remains of Stigmaria, an organ that anchored Pennsylvanian-aged trees related to modern clubmosses. The pits in the coal are the sites of rootlets that were attached to a larger, branching rootlike structure known as a rhizomorph. Photo by James St. John (flickr, Creative Commons Attribution 2.0 Generic license, image cropped and resized).
Mesozoic climate (252 to 66 million years ago)
Triassic to Jurassic (252 to 145 million years ago)
As the Triassic period began, North America was still part of Pangaea, and was shifting northwards. The Earth remained warm and ice-free at the poles through much of the Mesozoic era, although global temperatures began to dip again slightly around 150 million years ago. After reaching its greatest size during the Triassic period, Pangaea began to rift apart, and the climate gradually shifted, becoming wetter and warmer.
Cretaceous (145 to 66 million years ago)
The Earth warmed near the beginning of the Cretaceous, and sea level rose. Throughout the Cretaceous, sea level was as much as 100 meters (330 feet) higher than it is today. High sea levels were caused by the displacement of water due to continental rifting and rapid sea-floor spreading. Shallow seaways spread over many of the continents. By the start of the Late Cretaceous, North America was divided in two by an inland sea known as the Western Interior Seaway. Global temperatures during the Cretaceous were very warm, as much as 10°C (18°F) above present. There was likely little or no glacial ice anywhere on Earth. Temperatures were highest in lower latitudes.
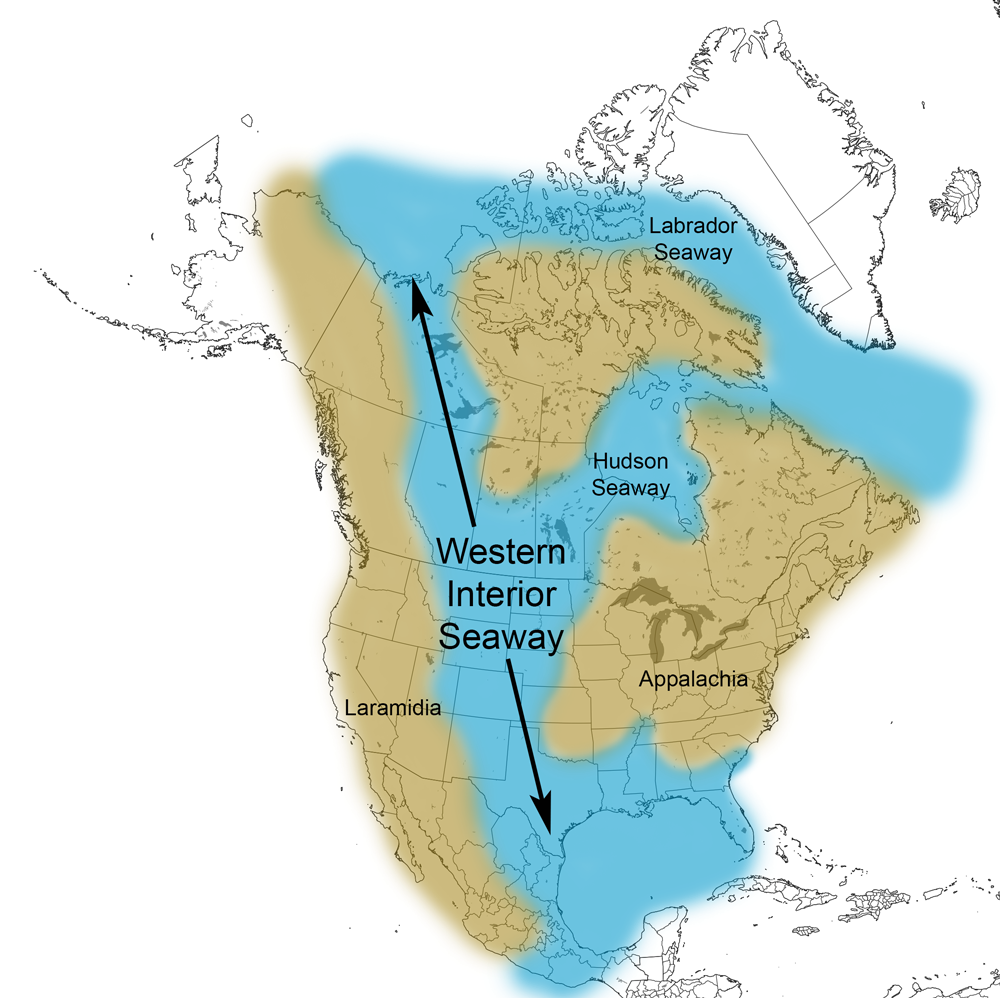
Extent of the Western Interior Seaway during the Cretaceous Period. Image from Cretaceous Atlas of Ancient Life: Western Interior Seaway (Creative Commons Attribution-NonCommercial-ShareAlike 4.0 International license).
At the very end of the Cretaceous, the Gulf Coast of the United States experienced an enormous disruption when an asteroid or comet collided with Earth in what is now the northern Yucatán Peninsula in Mexico. The impact vaporized both water and rock, blocking out sunlight for weeks to years, which led to a collapse of photosynthesis and food webs on land and in the oceans. After this event, the climate may have cooled briefly, but it soon rebounded to a warmer state.
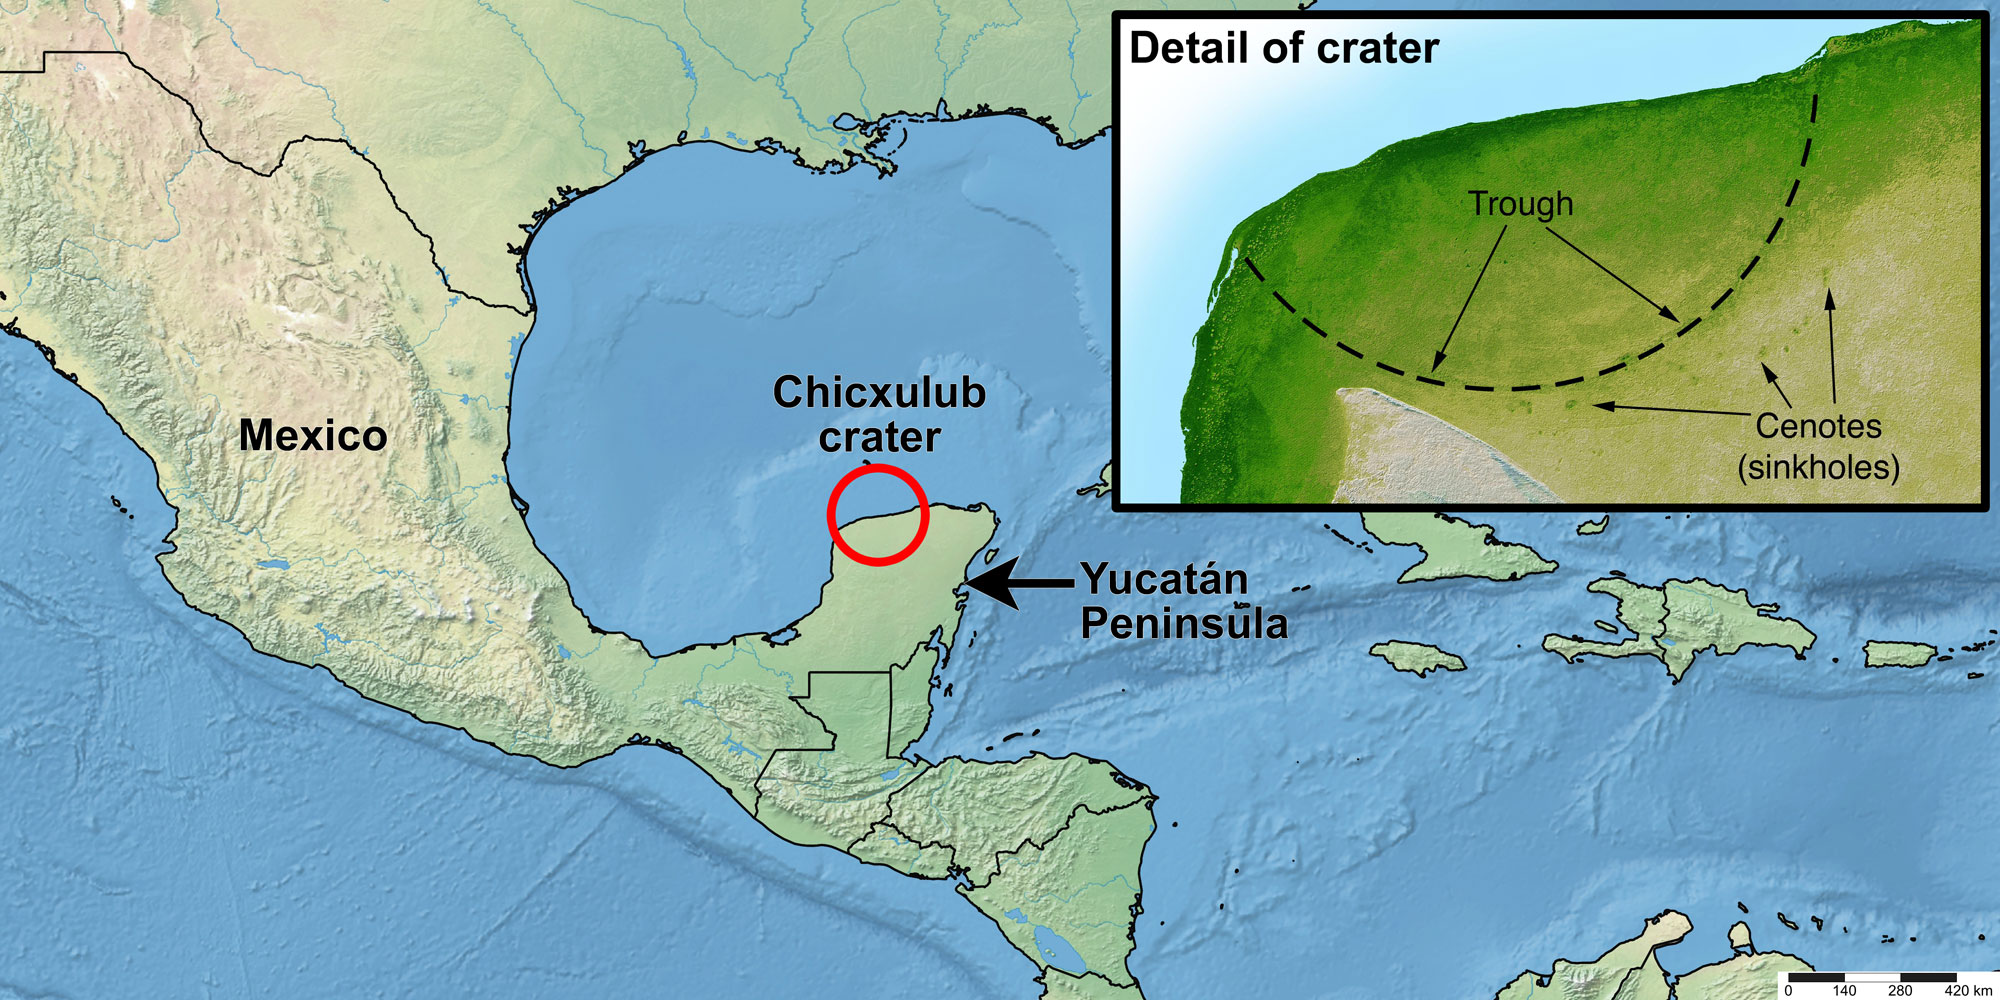
Map of the modern Yucatán Peninsula region showing the location of the Chicxulub impact crater. The inset image is a shaded relief image that shows the edge of the crater on the Yucatán Peninsula with sinkholes in the rock surrounding it. Map made by Elizabeth J. Hermsen using Simplemappr and modified in Photoshop. Inset image from the NASA Jet Propulsion Laboratory (PIA03397).
Cenozoic climate (66 million years ago to present)
Paleogene (66 to 23 million years ago)
As the Cenozoic era began, global temperatures remained high, and rose even further into the early Eocene. At the boundary between the Paleocene and Eocene epochs (around 56 million years ago), temperatures spiked upward in what geologists call the Paleocene-Eocene Thermal Maximum (PETM). During this event, which lasted perhaps only around 10,000 years, the atmosphere and ocean warmed by as much as 8°C (14°F) in as little as 4000 years. Deep oceans became acidic, with low levels of dissolved oxygen. The causes of the PETM remain unclear, but may have involved the sudden release of methane from sediments on the seafloor. The resulting greenhouse effect persisted for 100,000 years.
In the late Eocene, the Earth began cooling, and global temperatures fell sharply at the boundary between the Eocene and Oligocene epochs around 35 million years ago. Global cooling was caused in part by the separation of the southern tip of South America from the Antarctic Peninsula. This allowed for the formation of the Antarctic Circumpolar Current, which insulated Antarctica from warm ocean water coming from lower latitudes and led to the formation of the continent's glaciers.
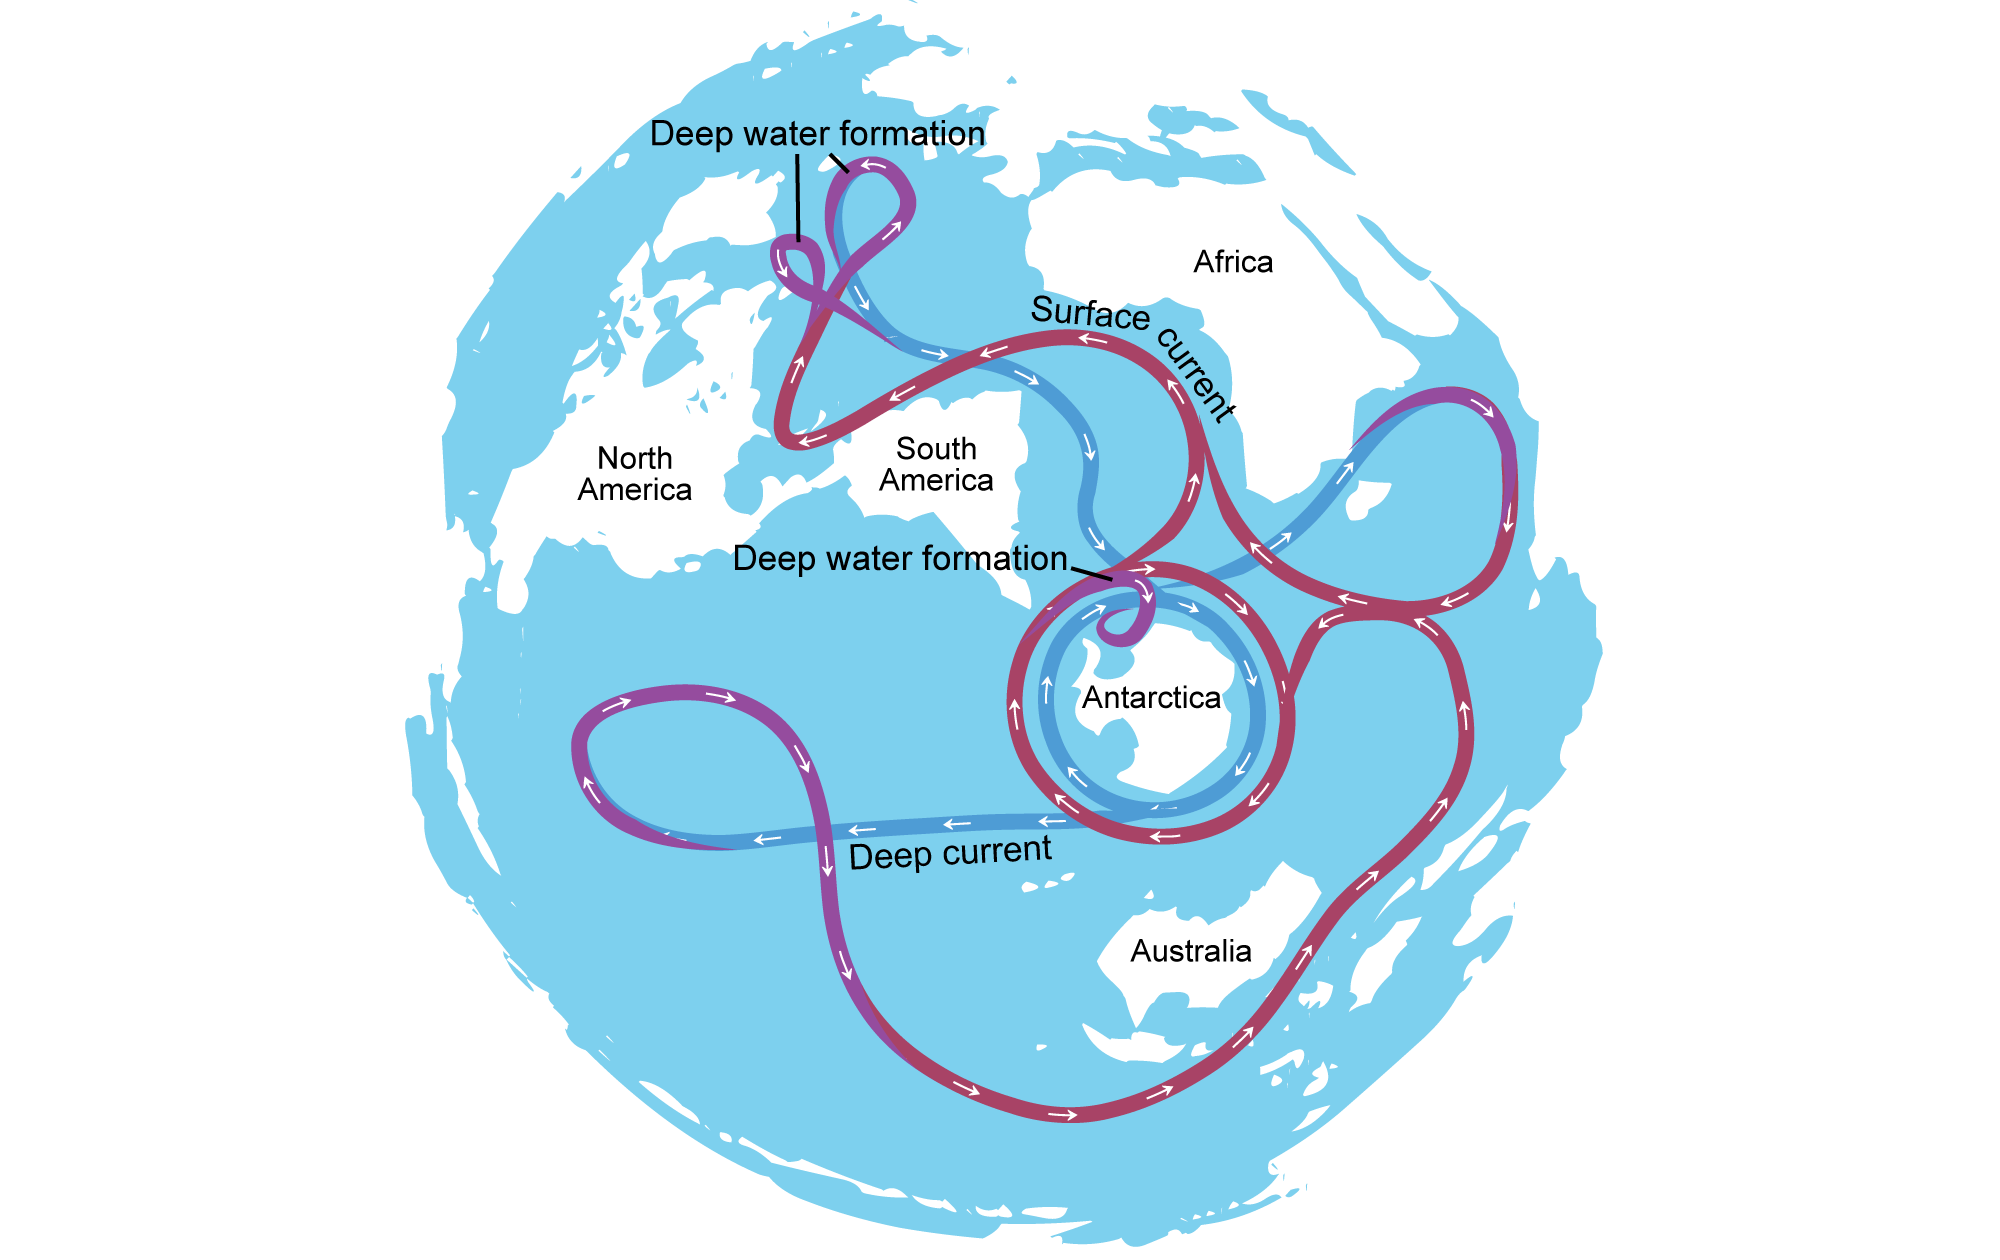
Illustration showing the circulation of water around the world's oceans today. The Antarctic Circumpolar Current is the current that encircles Antarctica. Modified from a diagram by Avsa (Wikimedia Commons, Creative Commons Attribution-ShareAlike 3.0 Unported license, image labels modified and image resized).
Neogene (23 to 2.6 million years ago)
Climates warmed slightly during the Miocene, reaching a small peak at the mid-Miocene Climatic Optimum. Afterwards, global temperatures began falling. Global cooling was possibly driven by the continuing collision of the India subcontinent with Asia, which was forming the Himalayas. The rise of the Himalayas had a significant impact on global climate, as newly exposed rock reacted with atmospheric CO2 during the process of weathering, removing the greenhouse gas from the atmosphere. With less carbon dioxide in the atmosphere, temperatures cooled worldwide. This cooling has continued more-or-less to the present day.
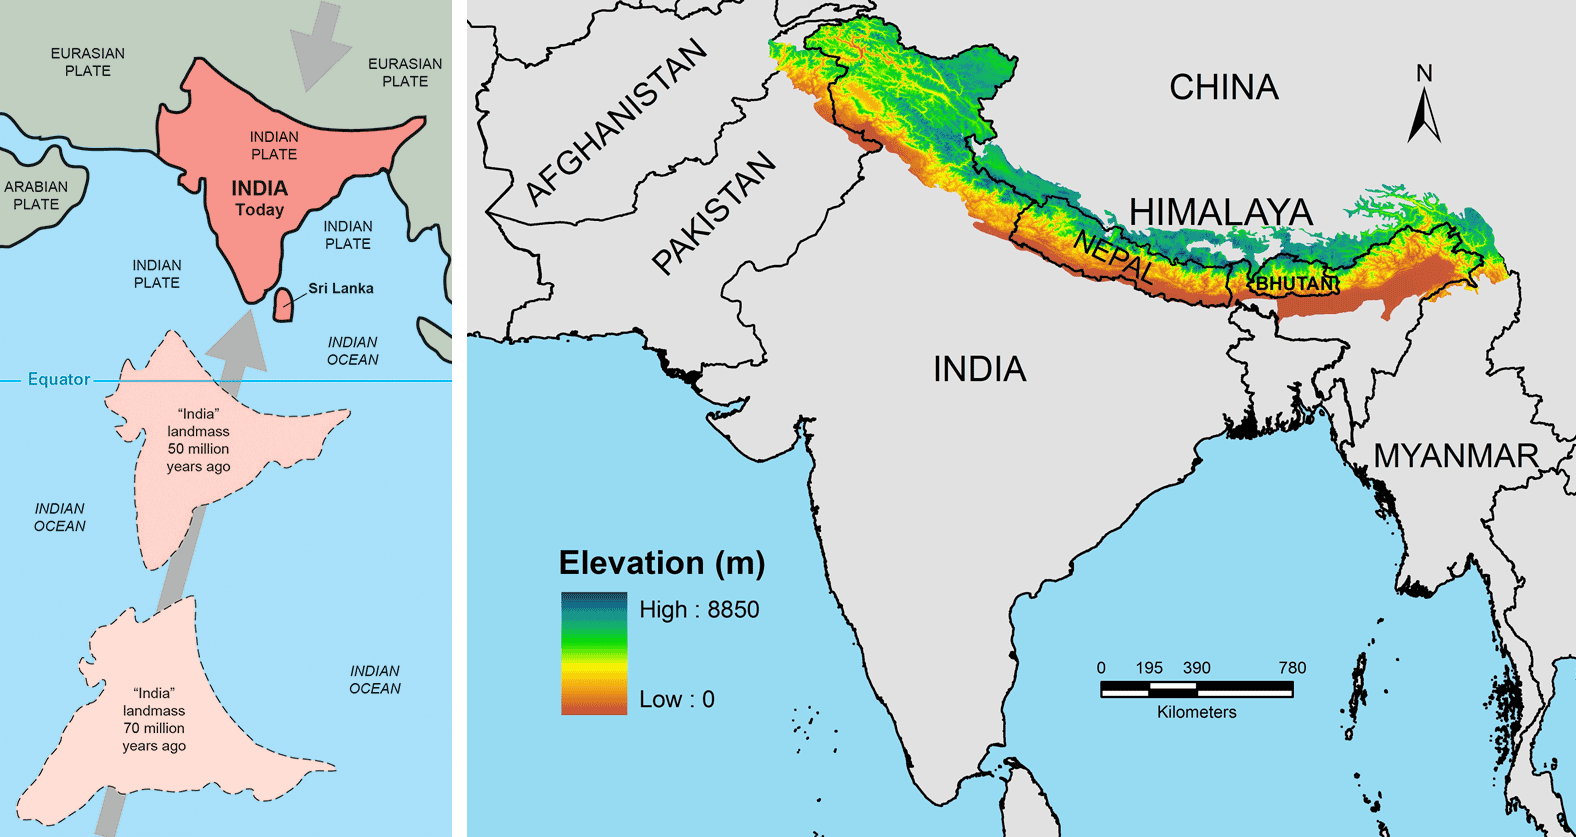
Left: The changing positions of the Indian subcontinent in the Late Cretaceous (70 million years ago), the Paleogene (50 million years ago) and today. Illustration from Kious and Tilling (1996) This Dynamic Earth: the Story of Plate Tectonics (USGS). Right: Map of the modern Himalayan Mountains in Asia. These mountains formed when the Indian subcontinent collided with Asia. Figure 1 from Manish and Pandit (2018) PeerJ 6:e5919 (Creative Commons Attribution 4.0 International license, image resized).
Around 3.5 million years ago, glacial ice began to form over the Arctic Ocean and on the northern parts of North America and Eurasia. A major factor contributing to the formation of glaciers in the northern hemisphere was a geological change that occurred in Central America. The Isthmus of Panama, formed by undersea volcanoes, rose out of the ocean.
The new, dry-land isthmus blocked the warm ocean currents that had been flowing east-to-west from the Atlantic to the Pacific for more than 100 million years. The currents where diverted into the Gulf of Mexico and, ultimately, into the western Atlantic Gulf Stream. As a result, the strengthened Gulf Stream carried more warm, moist air with into the northern Atlantic, which caused increased snowfall at high latitudes, which further accelerated cooling. These changes in ocean circulation also affected nutrient supplies in the coastal ocean throughout the Caribbean and Gulf of Mexico, which may have caused an increase in the extinction of marine animals during the late Pliocene.
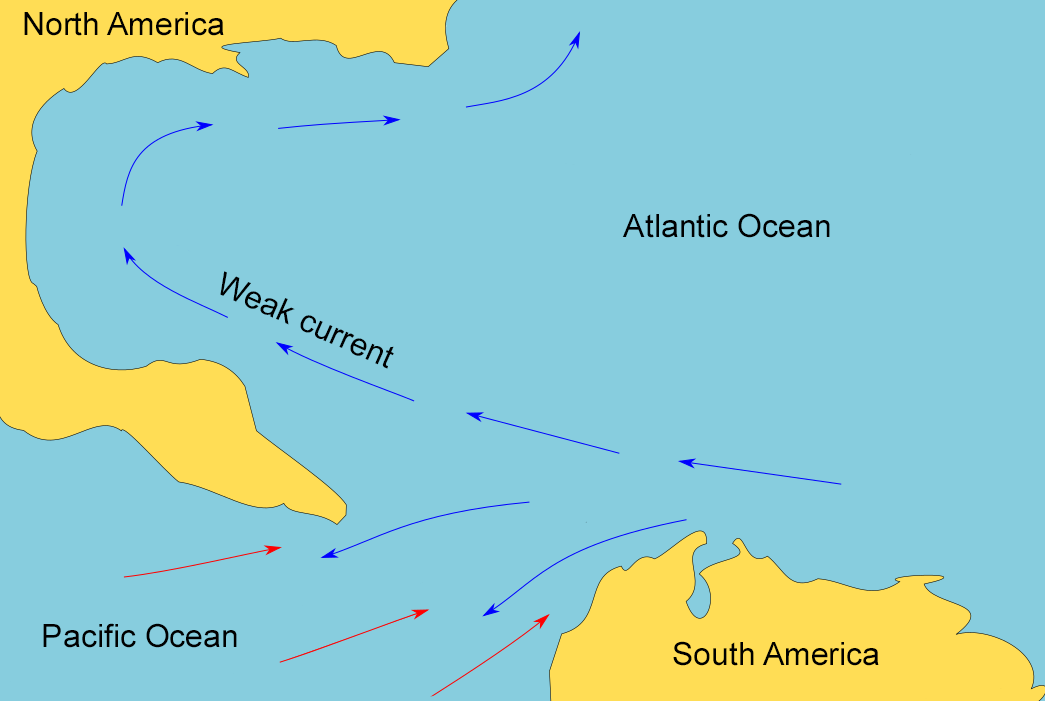
Map of the Gulf of Mexico region before the closure of the Isthmus of Panama. Before the Isthmus closed, the Atlantic and Pacific oceans were connected. Map modified from a map by Chiche Ojeda (Wikimedia Commons, Creative Commons Attribution-ShareAlike 4.0 International license, image cropped and modified).
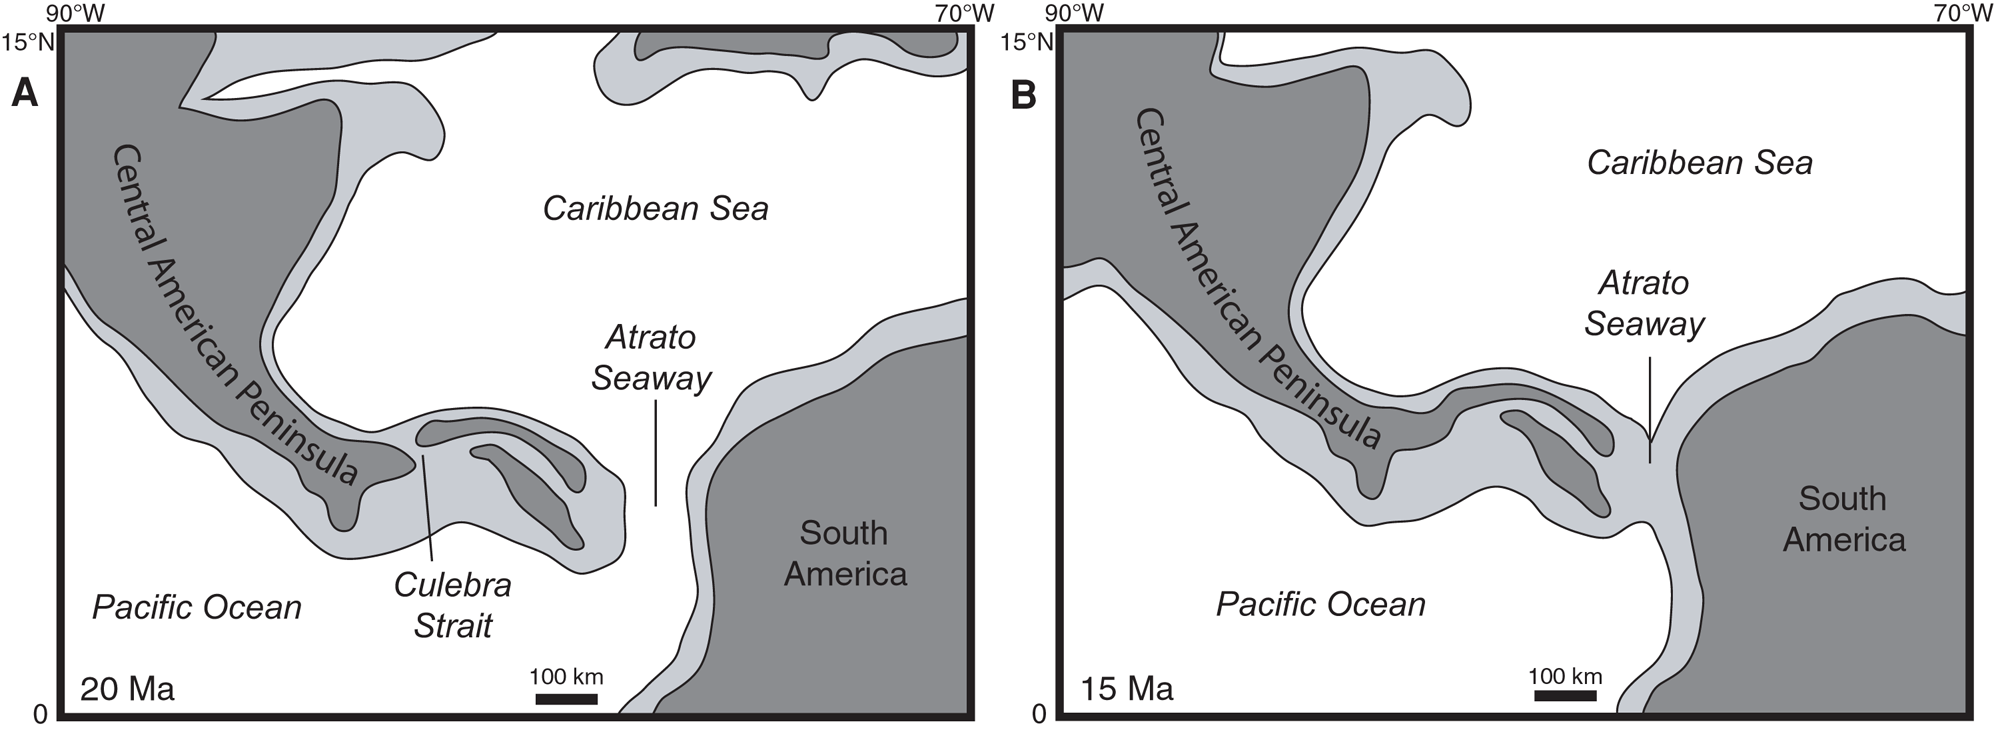
Maps showing the progressive closure of the Isthmus of Panama at 20 million years ago (A) and 15 million years ago (B). Dark gray is land, white and light gray are submerged areas. Modified from Figure 11 in Kirby et al. (2011) PLoS ONE 3(7): e2791 (Creative Commons Attribution license, image reorganized and resized).
Quaternary (2.6 million years ago to present)
Eventually, a sheet of sea ice formed over the Arctic, and ice sheets spread over northern Asia, Europe, and North America, signaling the start of the most recent ice age. Since just 800,000 years ago, a type of equilibrium has been reached between warming and cooling, with the ice caps growing and retreating primarily due to the influence of astronomical forces (i.e., the combined gravitational effects of the Earth, Sun, moon, and planets).
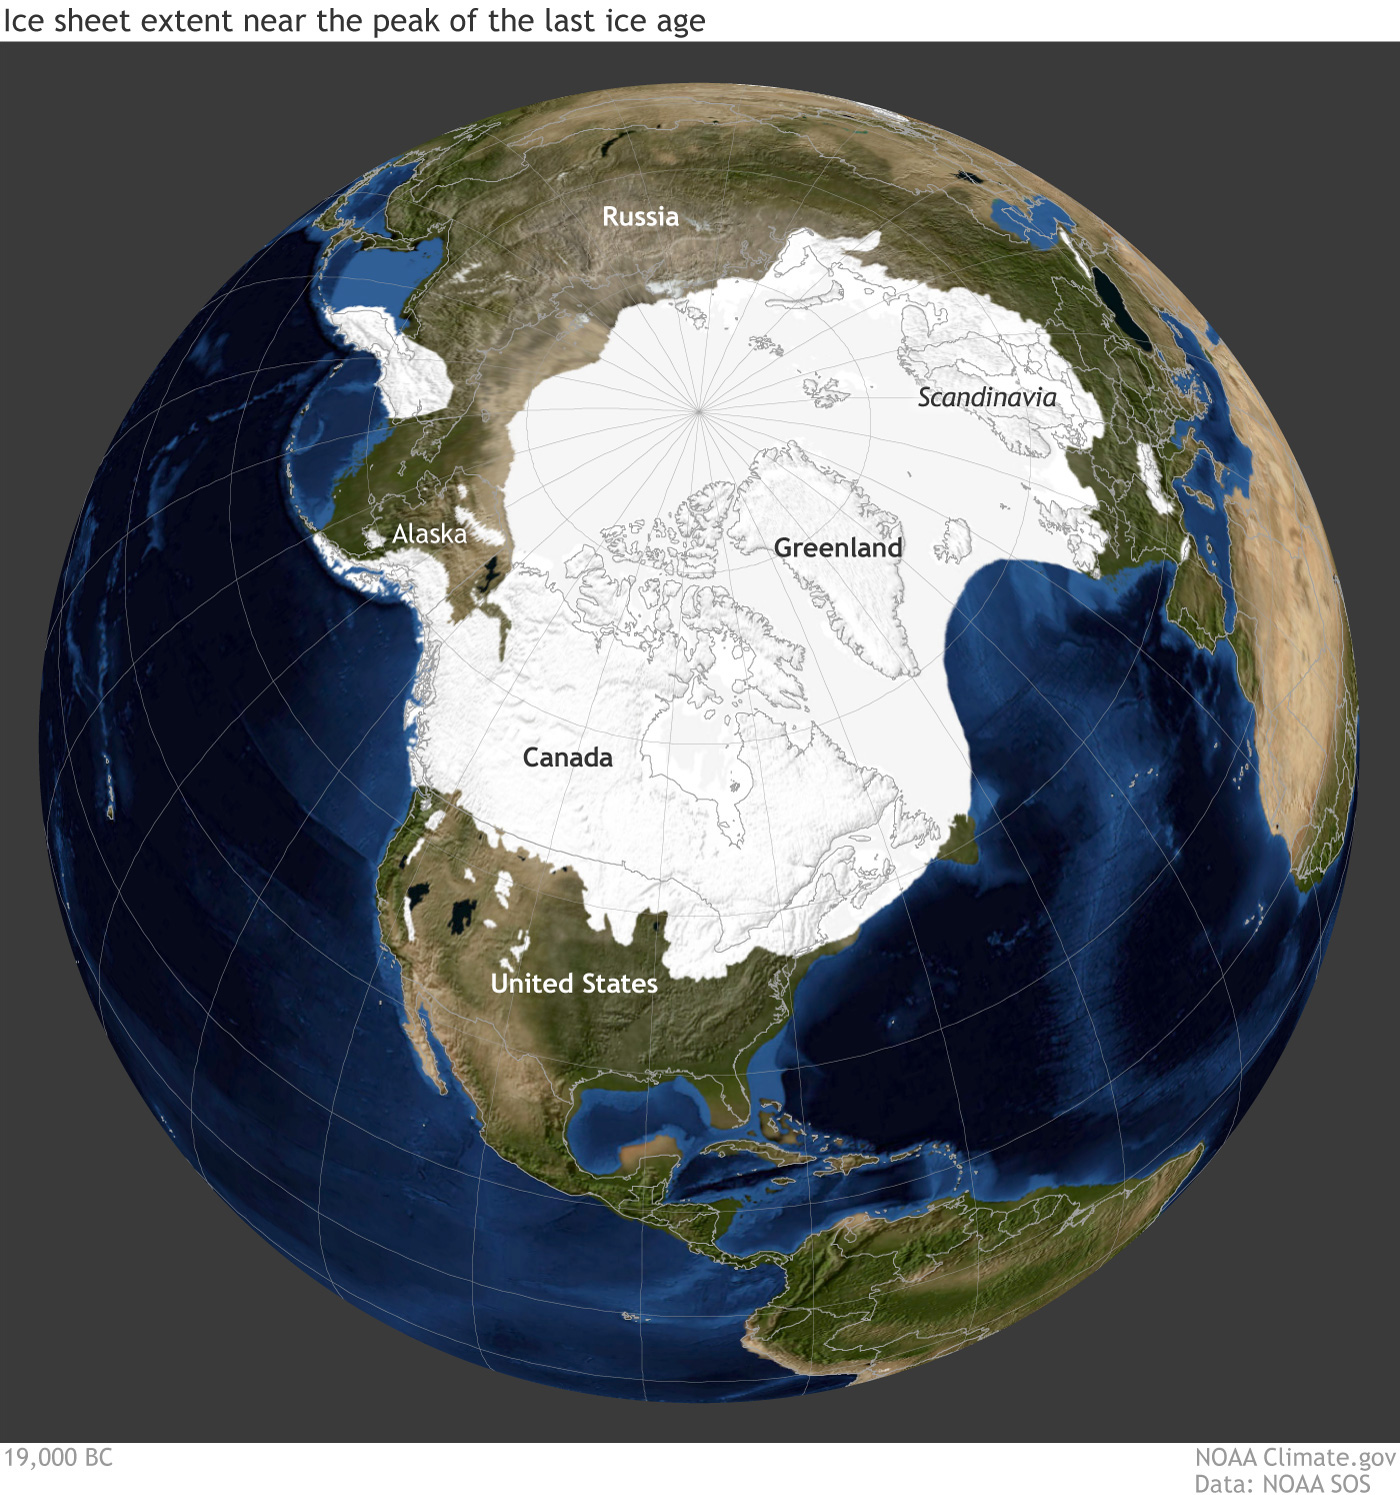
Earth during the last glacial maximum, around 20,000 years ago in the Pleistocene epoch. Much of North America was covered with a large sheet of glacial ice and the coastlines were different because sea level was lower. Reconstruction from climate.gov based on data from the University of Zurich Applied Sciences.
Present climate of the United States
A commonly used way to categorize climate is with the Köppen-Geiger map, developed by Wladimir Köppen in the late 19th century and early 20th century and refined by Rudolf Geiger. The U.S. contains all five main climate groups of the Köppen-Geiger map: Tropical, Arid, Temperate, Continental (cold), and Polar. Most of these zones occur in the contiguous US (all states except Alaska and Hawa'ii), with much of the eastern to central U.S. having a continental climate in the north and a warm temperate climate in the south. In the west, the climate is a mix of continental, warm temperate, and arid. The contiguous U.S. does not have any polar climate zones, and an equatorial (tropical) climate occurs only at the southern tip of Florida. Hawa'ii includes equatorial, arid, warm temperate, and polar (tundra) climate zones, mainly due to extreme changes in elevation. Alaska includes continental and polar zones.
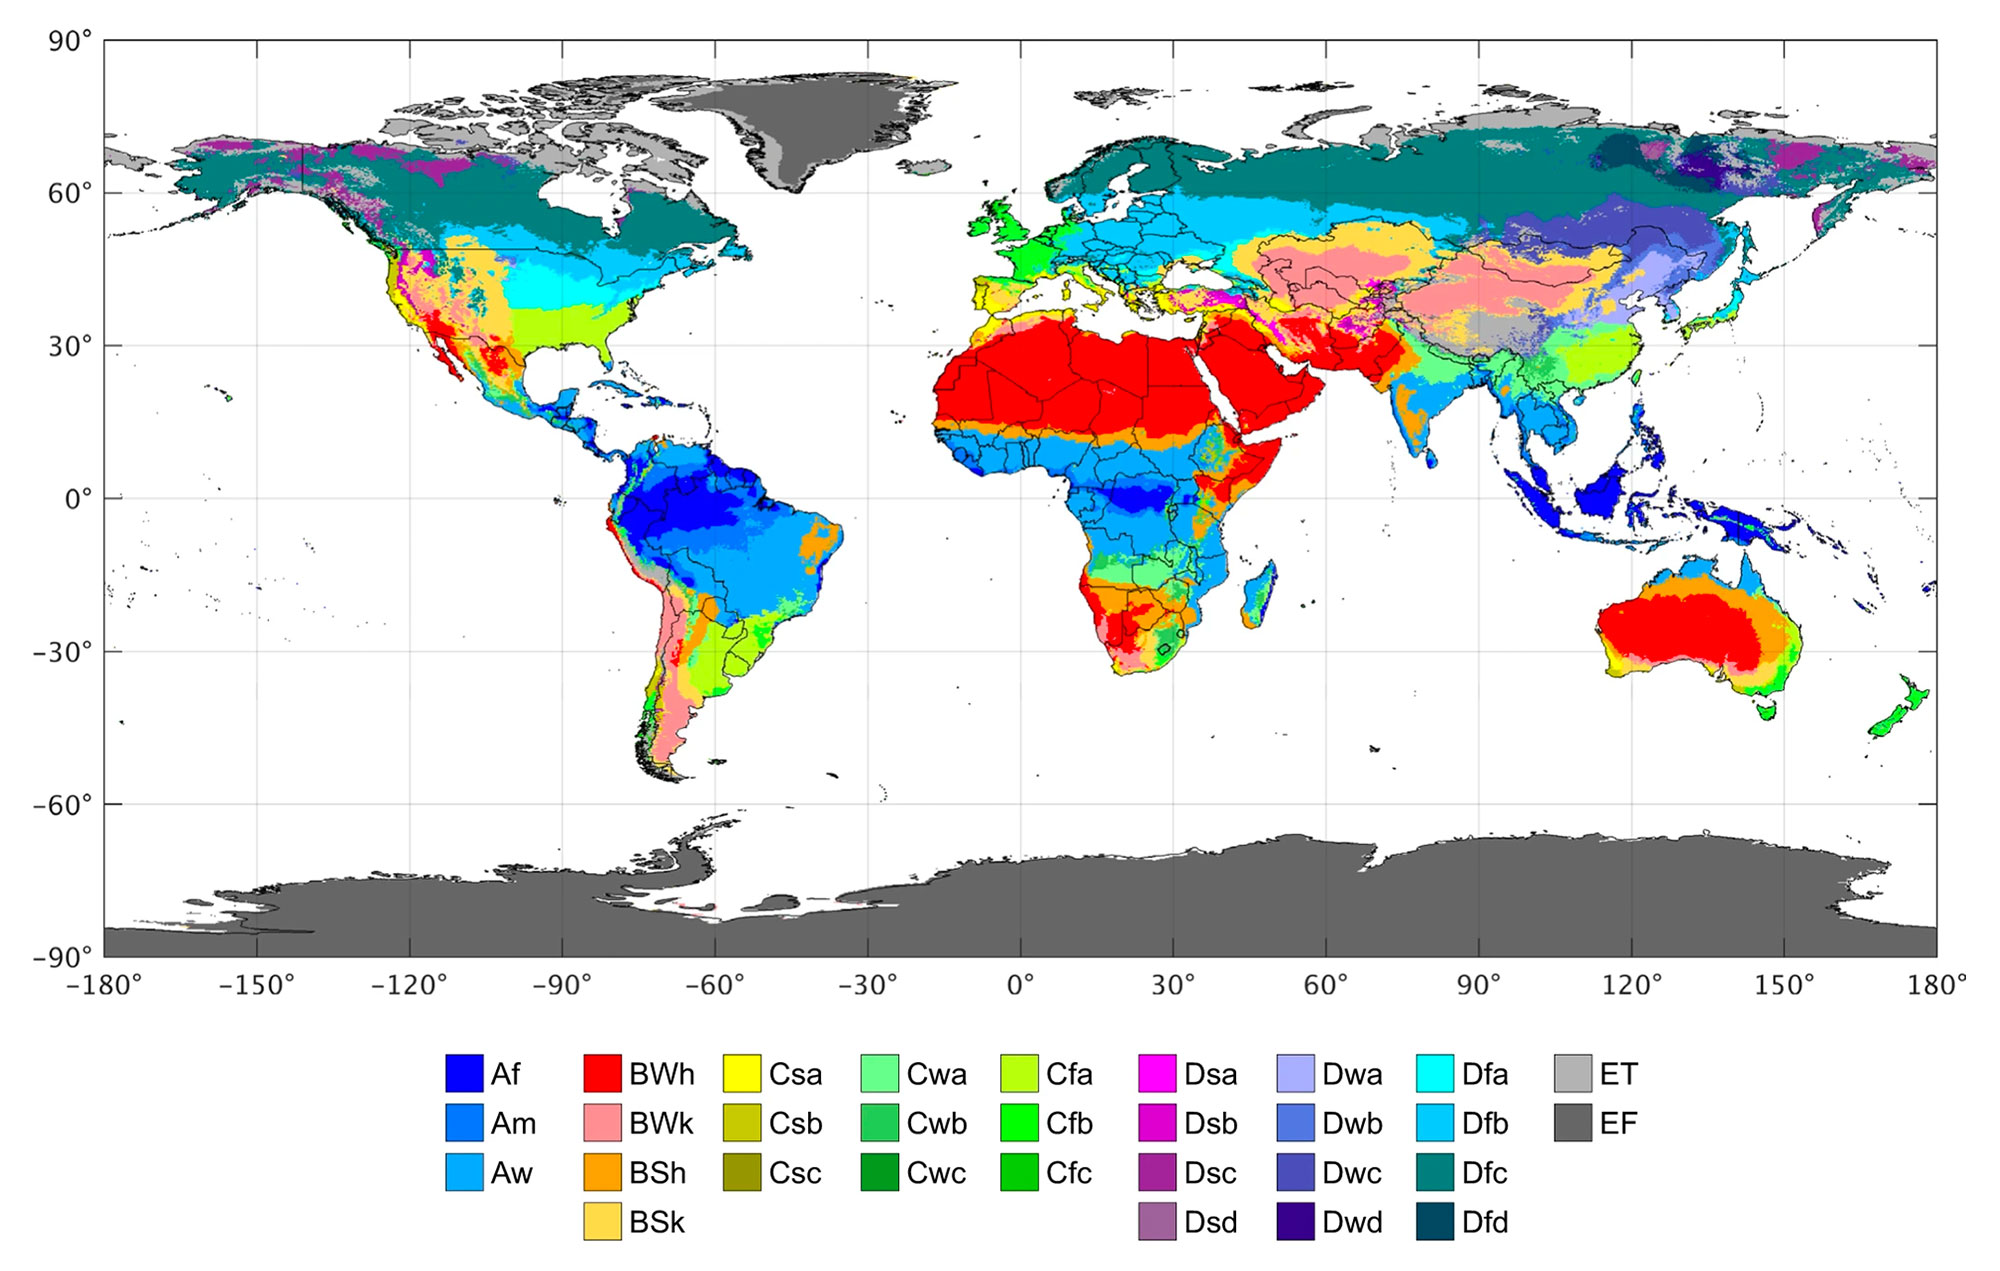
Complete Köppen-Geiger map of the world, representing climate zones as they existed from 1980 to 2016. The first letter of each zone in the key indicates its major classification. A = Tropical (equatorial), B = Arid, C = Temperate (warm temperate), D = Continental (cold), E = Polar. Modified from fig. 1a in Beck et al. (2018) Scientific Data 5: 180214 (Creative Commons Attribution 4.0 International license). See the original article for a complete key to the colors in the figure, or see the keys in the figures below.
Climate of the contiguous U.S.
Below is a summary of climate by region as covered on the Earth at Home website. For more information on each region, you may visit each region's climate page.
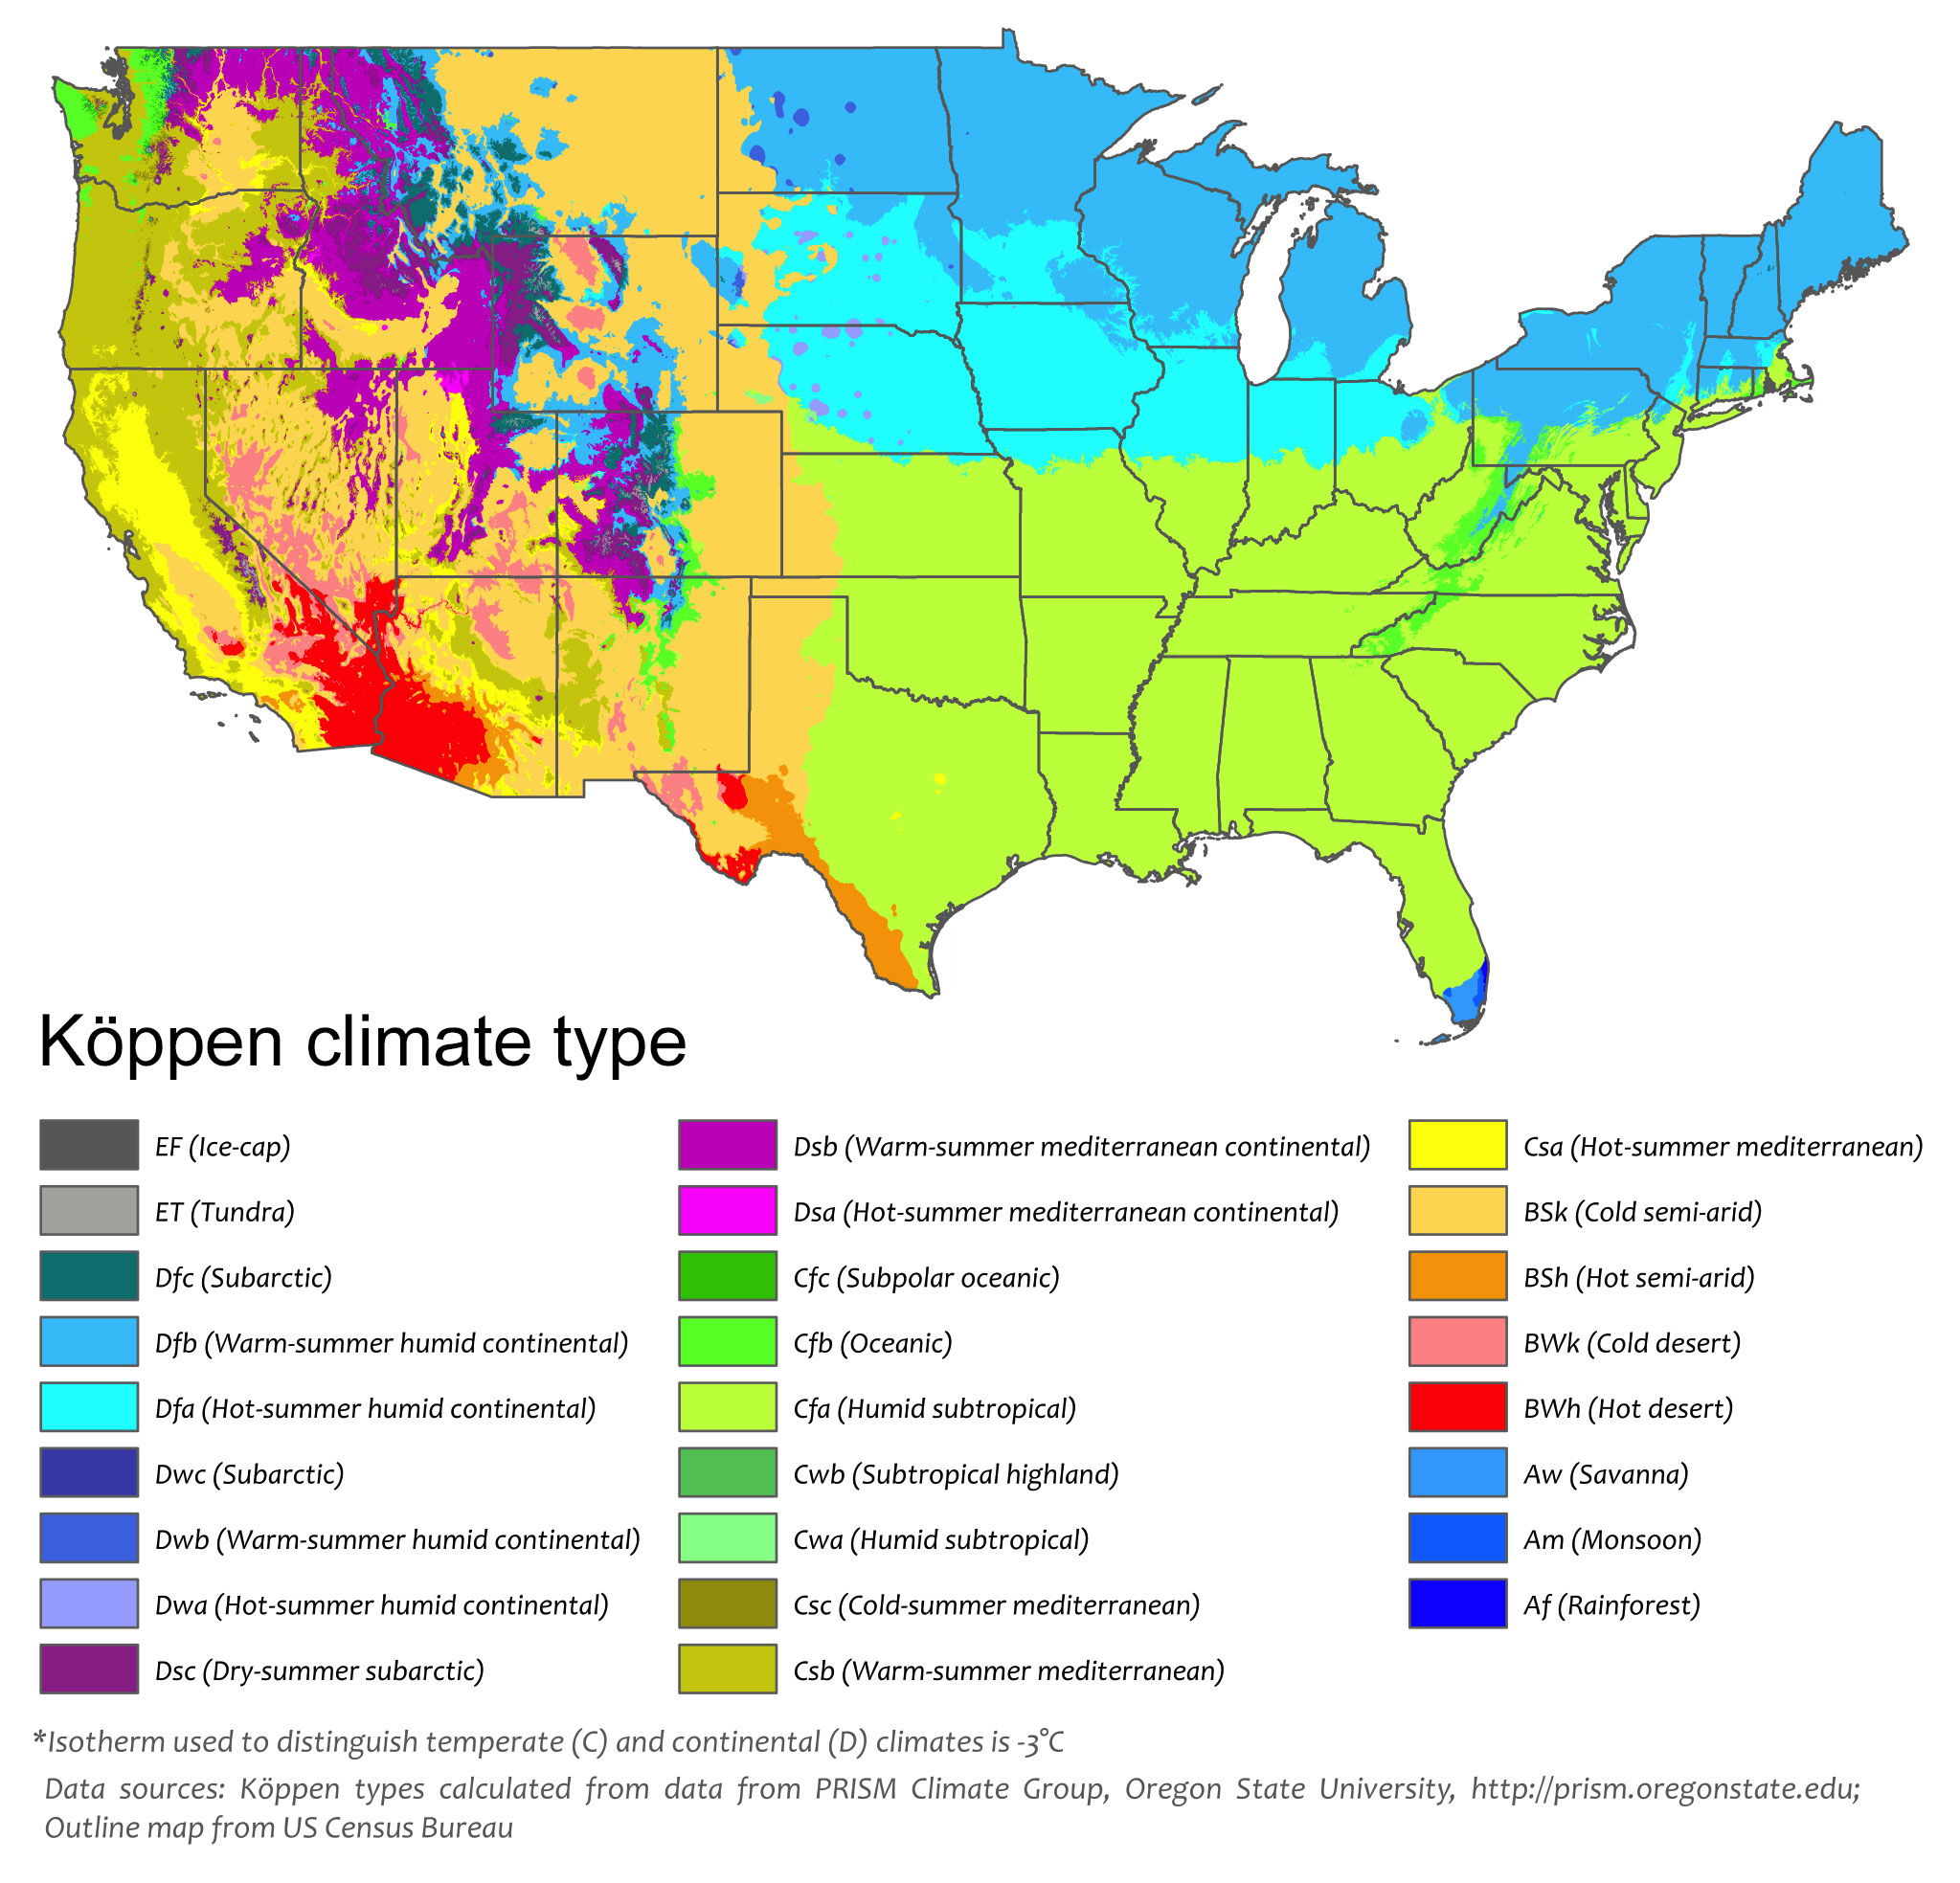
Köppen climate map of the 48 contiguous states of the United States. The first letter of each zone in the key indicates its major classification. A = Tropical (equatorial), B = Arid, C = Temperate (warm temperate), D = Continental (cold), E = polar. Modified from a map by Adam Peterson (Wikimedia Commons, Creative Commons Attribution-ShareAlike 4.0 International license).
Northeastern U.S.:
States covered: Connecticut, Delaware, Maine, Maryland, Massachusetts, New Hampshire, New Jersey, New York, Pennsylvania, Rhode Island, Vermont.
Climate: The Northeast has two broad climate regions, described in the Köppen system with prefixes D (moist, continental, mid-latitude) in the north and C (moist, subtropical, mid-latitude) in the south. “D” climates tend to have cold winters, while “C” climates experience hot, humid summers. Average temperatures can vary from summer to winter by as much as 22°C (72°F) in Maine and 16°C (61°F) in Maryland. The Northeast can get hot—Pennsylvania experienced a record high of 44°C (111°F) in 1936—but, in general, the Northeast’s climate is cool enough that even the states in its southern portion have average low temperatures below freezing during the winter.
Midwestern U.S.:
States covered: Illinois, Indiana, Iowa, Ohio, Michigan, Minnesota, Wisconsin.
Climate: Nearly all of the Midwest has a humid continental climate. Temperatures vary greatly from summer to winter, and precipitation occurs year-round. This climate is represented in the Köppen system with the prefix “D.” Southernmost Illinois, Indiana, and Ohio are closer to a humid subtropical climate, or “C.” The primary difference in these areas are that winter is warmer than in the regions with a cold or continental climate (D-type). While averages are important factors in describing climate, the Midwest has unusually extreme annual variation in temperature.
Northwest-Central U.S.:
States covered: Idaho, Montana, Nebraska, North Dakota, South Dakota, Wyoming.
Climate: Due to their diverse topographical features, these states encompass a broad range of climates, including subarid steppe in the Great Plains, warm temperate highlands in the Cordillera (mountains), and humid continental plains in the eastern Central Lowland. Even individual states can have tremendous diversity. For example, depending on which of the many Köppen system maps you refer to, the state of Idaho alone contains as many as eight different climate types. The main drivers of climate in the northwest-central U.S. are exposure to Arctic air from Canada in the winter, the lack of large bodies of water nearby (except for Idaho, whose climate is influenced by the Pacific Ocean), and the presence of the Rocky Mountain chain in the west. These mountains block moist Pacific Ocean air from the interior of the continent and create a cold, high altitude zone.
South-Central U.S.:
States covered: Arkansas, Kansas, Louisiana, Missouri, Oklahoma, Texas.
Climate: Today, the south-central U.S. lies at the intersection of several distinct climate zones, with much of the region characterized as warm temperate (represented by “C” in the Köppen system). Northern Missouri and northern Kansas are characterized as continental (represented by “D”), and the eastern parts of Kansas and Texas are arid (represented by “B”). The location of the south-central U.S. and its direct relationship to the Gulf of Mexico strongly influence the area’s weather. Since it encompasses locations along the coast as well as areas farther inland, the south-central U.S. experiences nearly every variety of extreme weather: heat waves and cold snaps, droughts, floods, blizzards, tornados, and hurricanes.
Southeastern U.S.:
States covered: Alabama, Florida, Georgia, Kentucky, Mississippi, North Carolina, South Carolina, Tennessee, Virginia, West Virginia.
Climate: In a broad sense, the Southeast's climate is mostly mild and humid, with much of the region characterized as warm temperate (represented by "C"). The Southeast does contain other climate zones, however, with a tropical climate (represented by "A") in southern Florida and areas of moist, continental climate (represented by "D") at higher elevations in the Appalachians.
Southwestern U.S.:
States covered: Arizona, Colorado, New Mexico, Utah.
Climate: The location of the Southwest and the topographical extremes across this area strongly influence its weather. The Southwest experiences nearly every variety of extreme weather; heat waves and cold snaps, droughts, floods, blizzards, and even tornados. In a broad sense, the Southwest’s climate is mostly dry and hot, with much of the region characterized as arid (represented by "B" in the Köppen system). Such conditions are common throughout the Great Plains, Colorado Plateau, and Basin and Range. Cold continental conditions (represented by "D") dominate the higher altitudes, especially within the Rocky Mountains. Scattered pockets of drier, Mediterranean temperatures (represented by "C") can also be found.
Western U.S. (contiguous United States):
States covered: California, Nevada, Oregon, Washington.
Climate: Because of its wide latitudinal range, its proximity of the Pacific Ocean, and the presence of long, north-south mountain ranges, the western states have an enormous variety of climatic areas. These include hot, dry deserts in the Basin and Range, a Mediterranean climate along the southern Pacific Border, and rainforests on the northern Pacific Border. Even individual states can have tremendous diversity. Depending on which of the many Köppen system maps you refer to, the state of Washington alone contains as many as eight different climate types.
Climate of Alaska
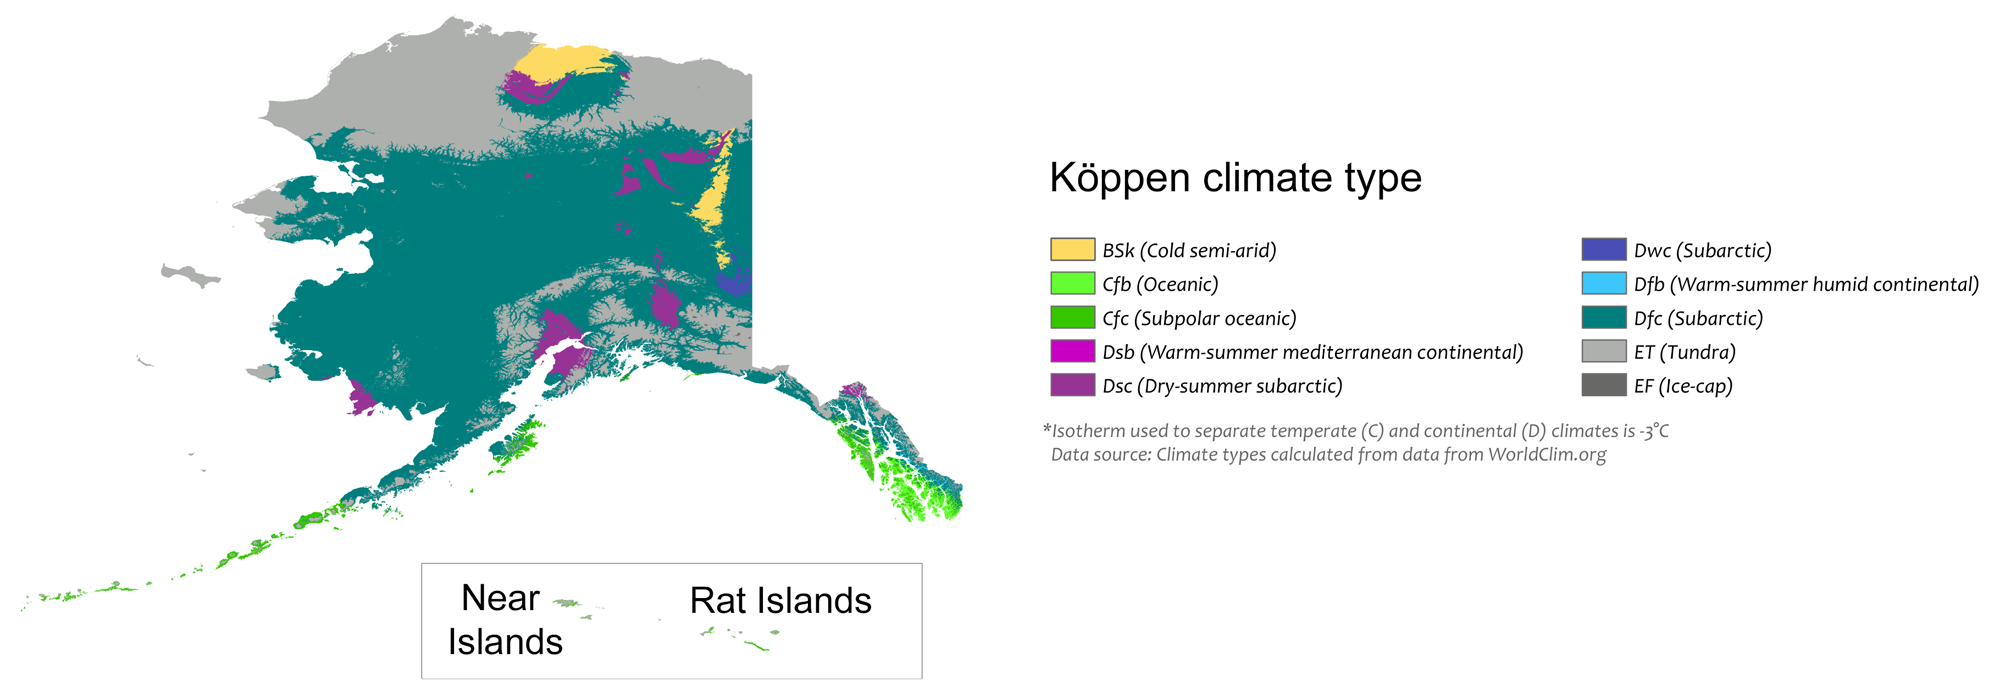
Köppen map of the Alaska. The inset shows the Near Islands, the Rat Islands, and the small Buldir Island that occurs between them in the westernmost Aleutian Islands (the island chain stretching from the southwest of mainland Alaska) The first letter of each zone in the key indicates its major classification. B = Arid, C = Temperate (warm temperate), D = Cold (continental), E = polar. Modified from a map by Adam Peterson (Wikimedia Commons, Creative Commons Attribution-ShareAlike 4.0 International license).
Alaska’s climate, like that of other parts of the western U.S., is influenced by its mountain ranges and its proximity to the ocean (Alaska has large coastlines on the Pacific and Arctic Oceans). North of the Brooks Range, Alaska has a cold, dry, polar climate with frequent winter blizzards. Temperatures on the coast are moderated somewhat by the Arctic Ocean. Central Alaska has a dry continental climate, with a large variation between summer and winter temperatures.
Moderate temperatures and high precipitation characterize southeastern Alaska and the Alaskan south coast and southwestern islands. The climate in west-central Alaska is influenced by the seasonal presence of sea ice. In the winter when sea ice covers the Bering Sea, this area loses the moderating effect of open water and has a continental climate. When the sea ice melts in summer, the climate returns to a warmer, more humid maritime state.
Climate of Hawai'i
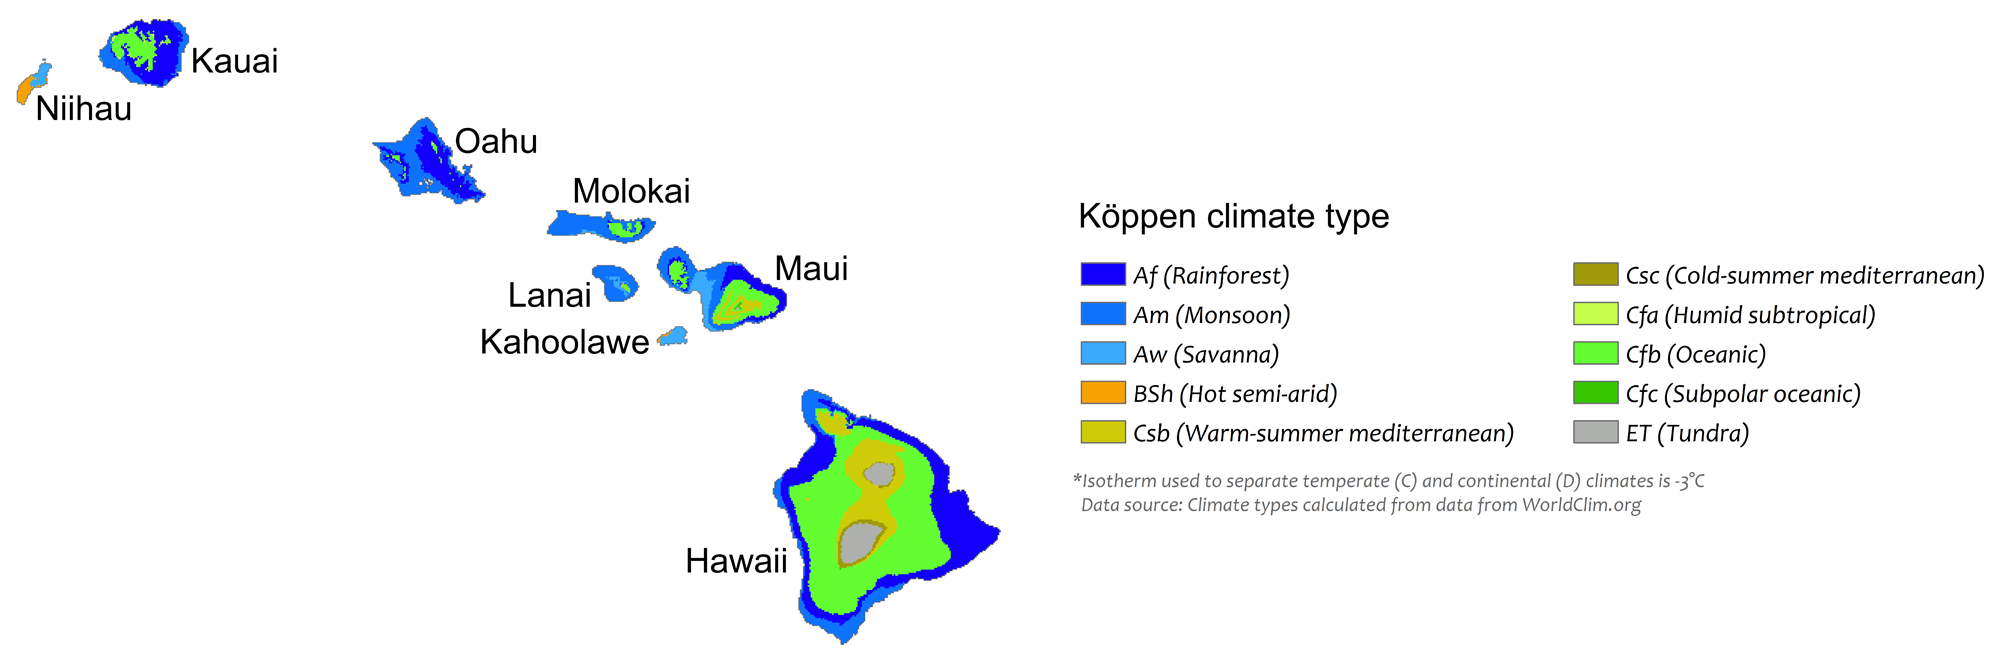
Köppen map of the Hawai'i. The first letter of each zone in the key indicates its major classification. A = Tropical (equatorial), B = Arid, C = Temperate (warm temperate), E = polar. Modified from a map by Adam Peterson (Wikimedia Commons, Creative Commons Attribution-ShareAlike 4.0 International license).
The eight main Hawaiian Islands stretch between 19° and 22° north latitude. This places them firmly within the tropics and also within the belt of persistent northeast trade winds. This geography, combined with the high topography of many Hawaiian peaks, gives rise to large variations in climate across the islands. Half of the land area of Hawai'i lies within eight kilometers (five miles) of the ocean, and the farthest inland you can be on any of the islands is 65 kilometers (40 miles). Thus, the ocean is an important control on climate.
Future climate
By using techniques that help to reconstruct past climates and by tracking trends in the present, we can predict how current climates might change. Overall, the world is warming. Yet, because we are still in an ice age, eventually the current interglacial period should end, allowing glaciers to advance towards the equator again (although likely not for about 80,000 years). Because the Earth is already getting warmer, however, the effects of anthropogenic (human-caused) warming are amplified through feedback. Some scientists worry that, if not curbed, human activity could disrupt the glacial-interglacial cycle and knock the planet entirely out of the interglacial period, melting all the ice on Earth.
Time series animation showing global warming from 1880 to 2021. Through time, temperatures become warmer, with some of the most extreme changes seen at high northern latitudes. Video created by NASA's Scientific Visualization Studio, bused on data provided by Robert B. Schmunk (NASA/GSFC GISS, via YouTube).
Causes of climate change
While astronomical and tectonic forces will continue to cause climatic shifts (learn more in the Digital Encyclopedia—Natural Causes of Climate Change), they act so slowly that they will be overshadowed in the near term by human-induced effects. In 1956, NOAA established the Mauna Loa Observatory (MLO) in Hawaii to measure a variety of atmospheric parameters, including carbon dioxide (CO2) concentration. The CO2 record extends from 1958 to the present, and it shows the influence of both natural and anthropogenic processes. The zigzag pattern is the result of seasonal photosynthesis in the northern hemisphere, which has over 65% of the Earth's land.
In northern hemisphere spring and summer, the increased photosynthetic activity and growth of plants draws CO2 out of the atmosphere. Conversely, CO2 accumulates in the atmosphere during northern hemisphere fall and winter, when plants are dormant. The overall upward trend is caused by human activity. Industrialization, fossil fuel combustion, and deforestation all contribute CO2 to the atmosphere, adding it at a rate much faster than natural processes can remove it. Analyses of ancient atmosphere samples preserved in glacial ice cores show CO2 levels were 180 parts per million (ppm) at the height of the last ice age and 280 ppm when it ended.
The amount of CO2 in the atmosphere has been increasing at a rapid rate since the start of the Industrial Revolution, and it has accelerated since the end of World War II. In May 2013, measurements at MLO reached 400 ppm CO2 for the first time.
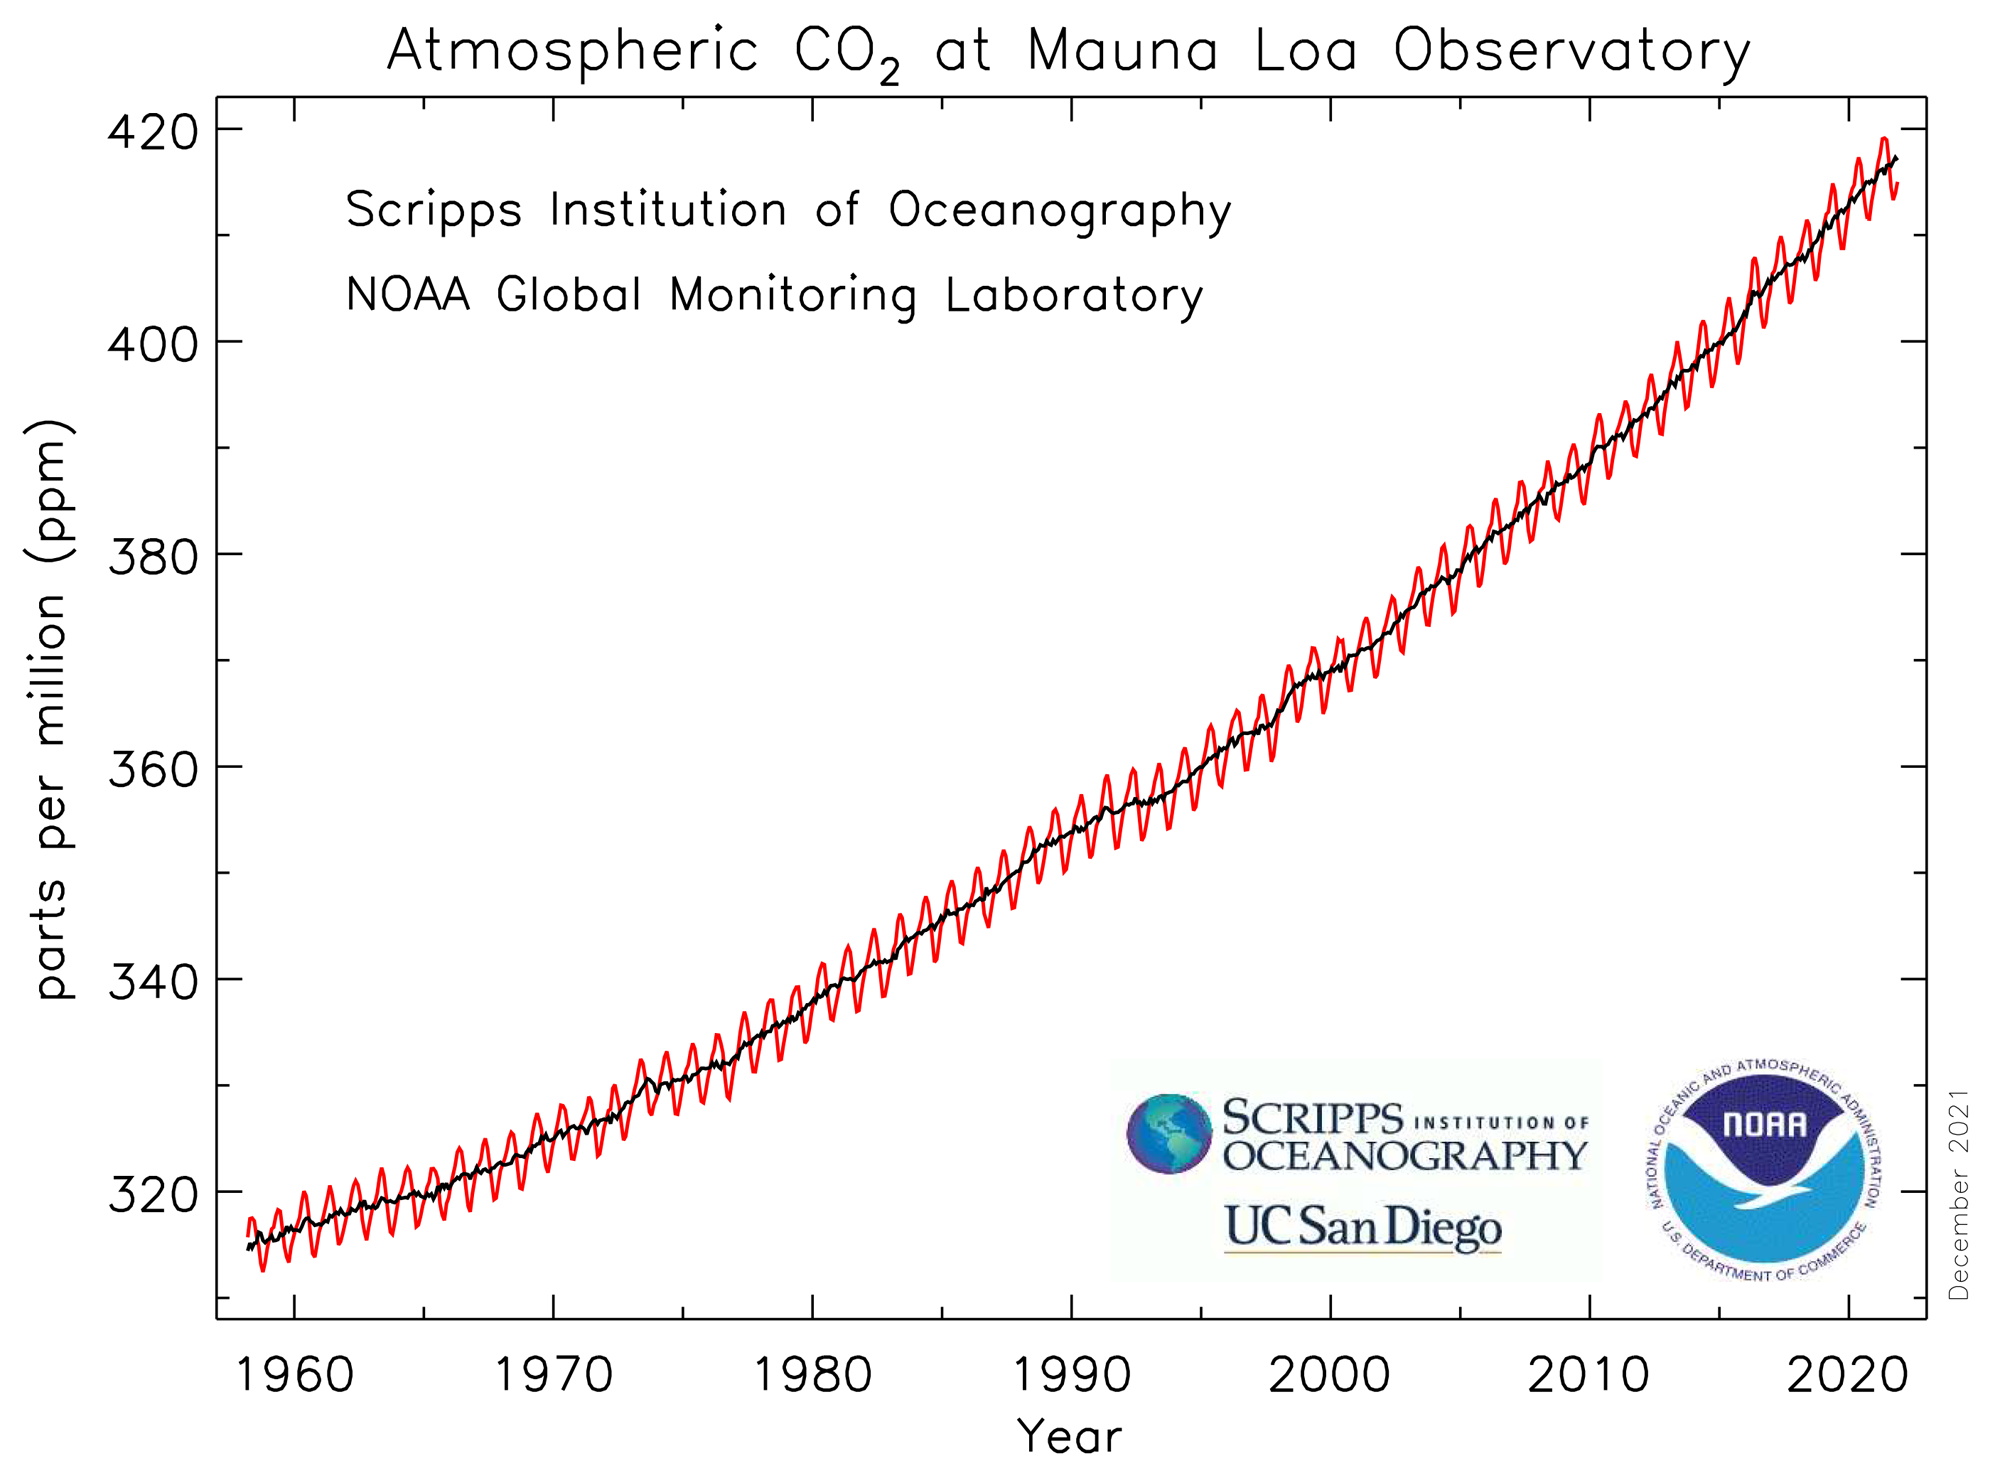
Graph showing the concentration of carbon dioxide in the atmosphere from 1958 to 2021 as measured at Mauna Loa Observatory in Hawaii. The red line shows the average carbon dioxide concentration measured each month. This measurement fluctuates seasonally. The black line is corrected to remove fluctuations caused by seasonal variability. Diagram by NOAA Global Monitoring Laboratory.
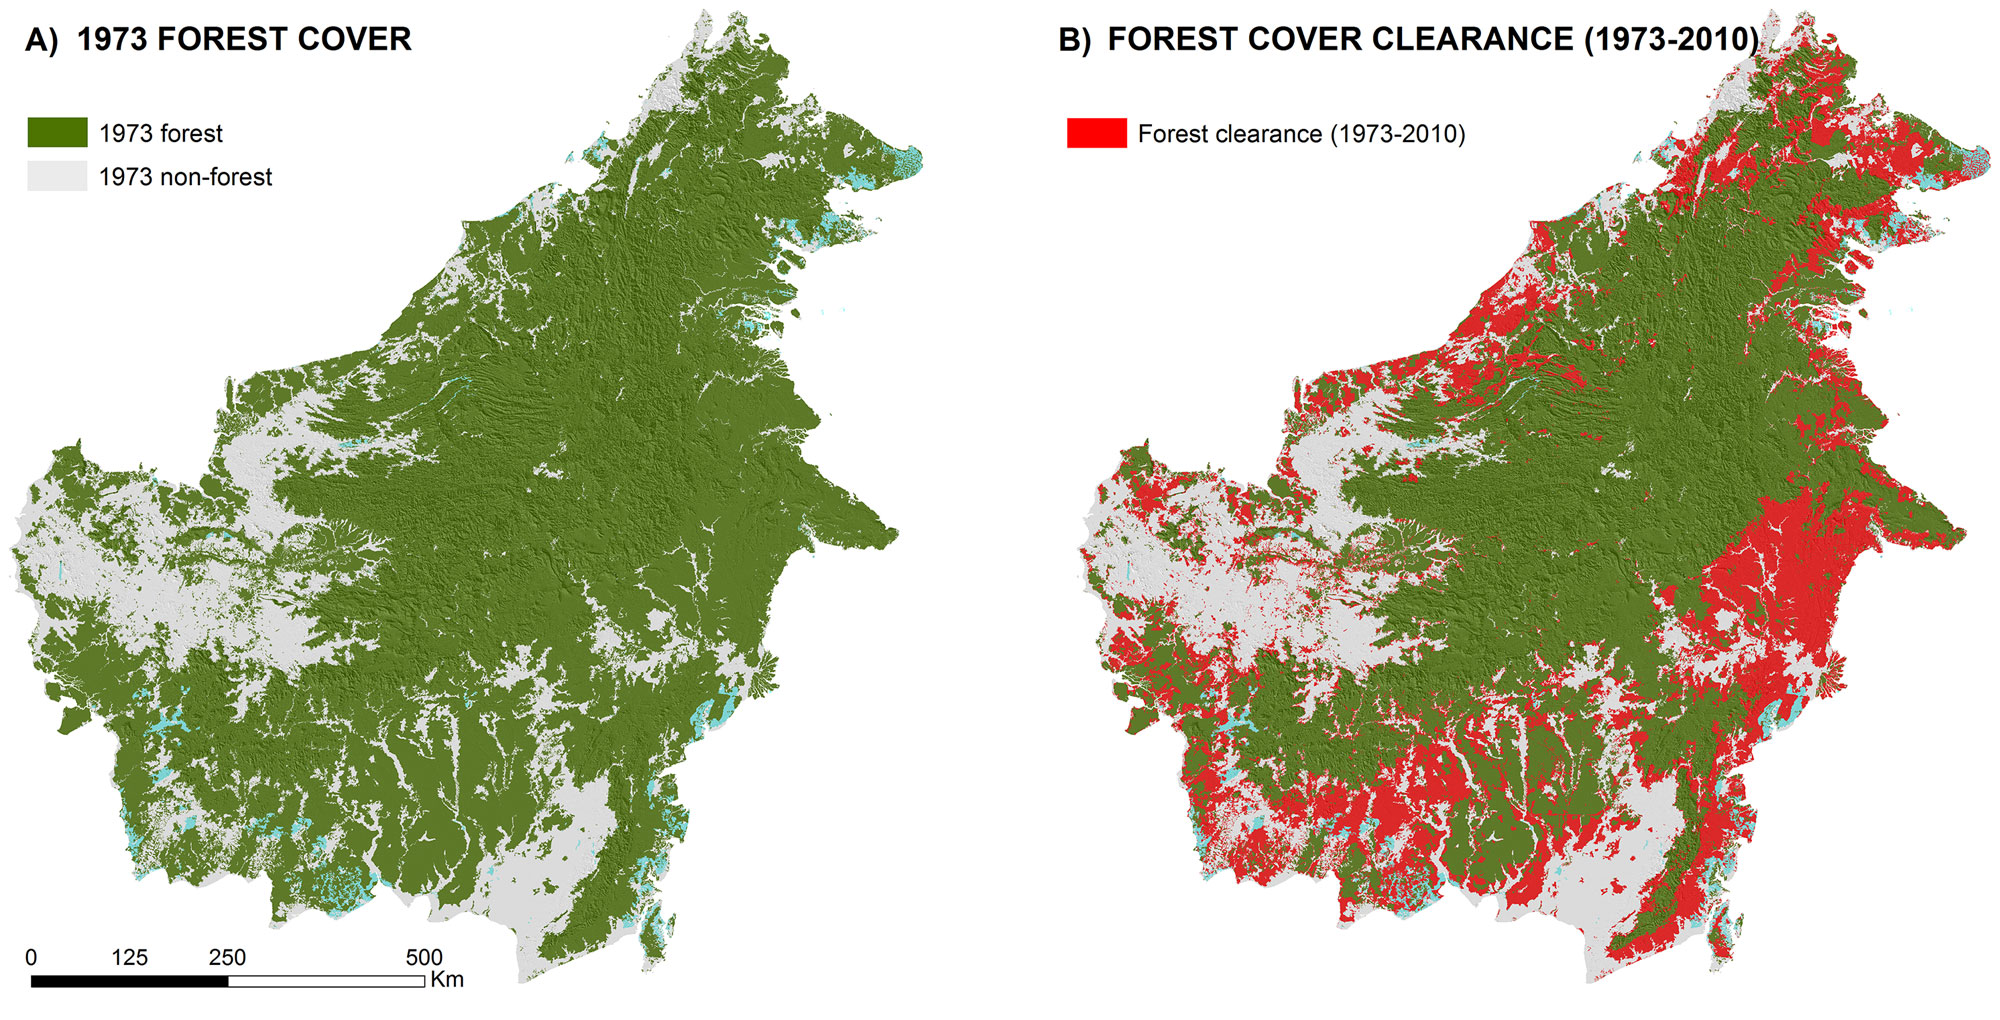
Maps of the island of Borneo showing deforestation. Left (A): Forested areas (green) as of 1973. Right (B): Extent of forest that was cleared (red) between 1973 and 2010. Modified from Fig. 3 in Gaveau et al. (2014) PLoS ONE 9(7): e1010654 (Creative Commons Attribution 4.0 International license).
"What is causing the Earth to warm?" Video by the Paleontological Research Institution, via Youtube.
While some atmospheric carbon dioxide is necessary to keep Earth warm enough to be a habitable planet, the unprecedented rapid addition of CO2 to the atmosphere by human beings is cause for concern. Everything we know about atmospheric physics and chemistry tells us that increased CO2 leads to a warmer planet. Multiple paleoclimate data sets verify this conclusion, and modern measurements confirm that we are living in an increasingly warmer world. The increasing heat is causing glaciers and sea ice around the globe to melt, and as the ground and ocean they covered is exposed, these darker surfaces absorb and re-radiate increasing amounts of heat.
Time series animation showing the change in the mass of Antarctica ice from 2002 to 2020. On average, 149 gigatons of ice was lost each year during from 2002 to 2020. Video by NASA and JPL/Caltech, via YouTube.
As permafrost in high latitudes melts, soils will release carbon dioxide and, worse, bacteria will convert stored carbon into the even more potent greenhouse gas methane. Less directly, higher temperatures lead to more frequent and severe droughts, which, in turn, lead to more wildfires that release carbon and aerosols into the atmosphere. Aerosols can have a cooling effect as they reflect away radiation from the sun, but they can also pose a public health hazard.
Water is extremely good at absorbing heat: water vapor is actually the most effective greenhouse gas. Higher temperatures increase evaporation and allow the air to retain more water. While water vapor feedback is the most significant reinforcer of climate warming, water tends to move out of the atmosphere in a matter of weeks, while greenhouse gases such as methane and carbon dioxide linger in the atmosphere for tens to hundreds of years.
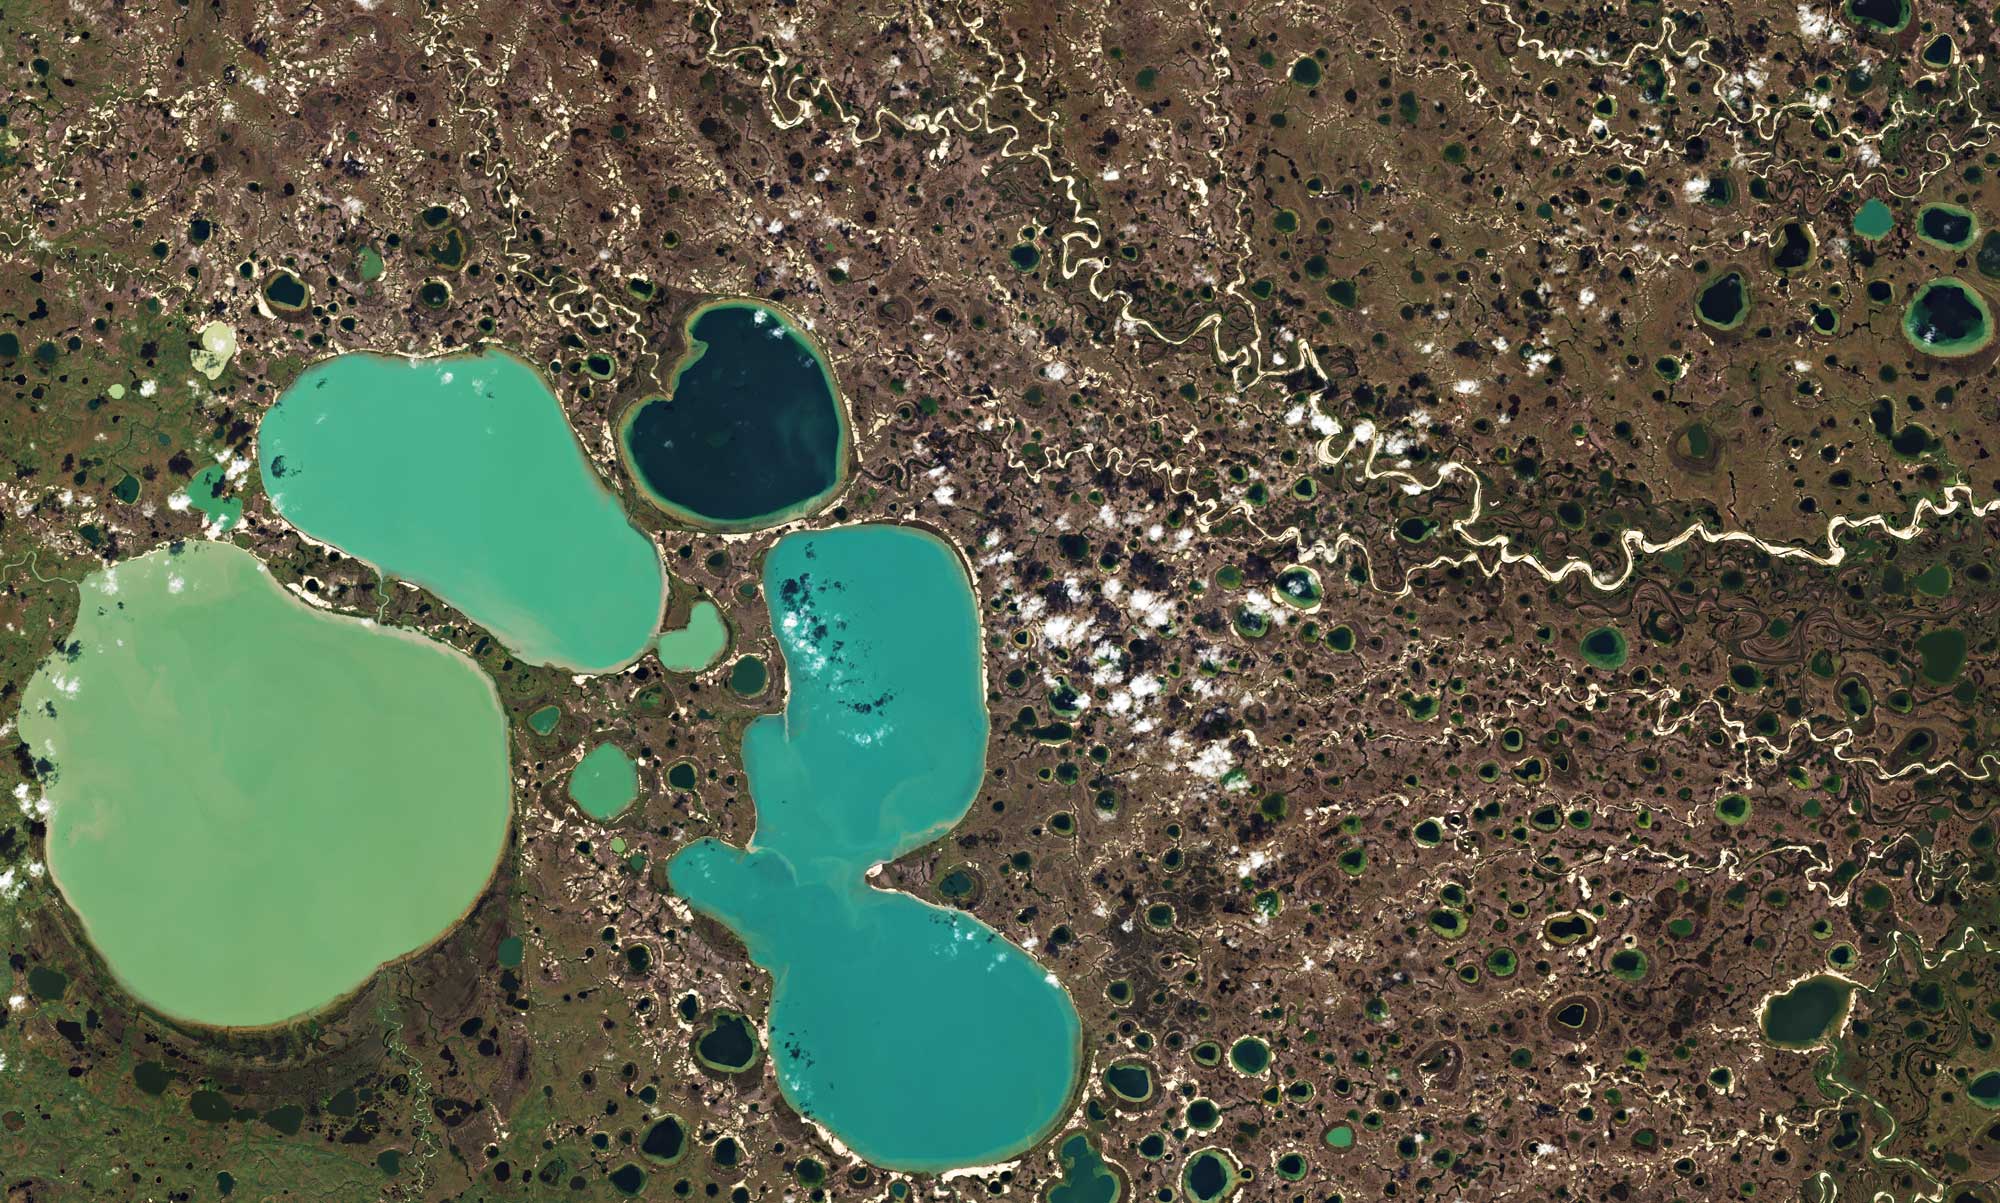
Excerpt from original description: "Ponds resulting from thawing permafrost in the Yamal Peninsula in northwest Siberia captured by the Copernicus Sentinel-2 mission on 27 August 2018." Photo by the European Space Agency (Wikimedia Commons, Creative Commons Attribution-ShareAlike 3.0 IGO license, image resized).
Resources
Resources from the Paleontological Research Institution
Books
Zabel, I. H. H., D. Duggan-Haas, and R. M. Ross (eds.), 2017, The Teacher-Friendly Guide to Climate Change. Paleontological Research Institution, Ithaca, New York, 284 pp. https://www.priweb.org/science-education-programs-and-resources/teacher-friendly-guide-to-climate-change
Allmon, W. D., T. A. Smrecak, and R. M. Ross. 2010. Climate change—past, present & future: a very short guide. Paleontological Research Institution Special Publication 38, Ithaca, NY, 200 pp.
Websites
Earth@Home Climate: https://climate.earthathome.org/
Earth@Home: Quick guides & FAQ: Climate and Energy: https://earthathome.org/quick-faqs/#climate
Online exhibit: Changing Climate, Our Future, Our Choice: https://www.museumoftheearth.org/changing-climate/
Videos
- Playlists on PRI's YouTube channel: