

Page snapshot: Introduction to the climate of the southwestern United States, including present, past, and future climate.
Topics covered on this page: Present climate of the southwestern U.S.; Present temperature; Present precipitation; Severe weather; Regional climate variation; Past climate of the southwestern U.S.; Paleozoic; Mesozoic; Cenozoic; Future climate of the southwestern U.S.; Resources.
Credits: Most of the text on this page comes from "Climate of the Southwestern US" by Ingrid H. H. Zabel, Judith T. Parrish, and Andrielle N. Swaby, chapter 8 in The Teacher-Friendly Guide to the Earth Science of the Southwestern US, edited by Andrielle N. Swaby, Mark D. Lucas, and Robert M. Ross (published in 2016 by the Paleontological Research Institution; currently out of print). The book was adapted for the web by Elizabeth J. Hermsen, Jonathan R. Hendricks, and Ingrid Zabel in 2022. Changes include formatting and revisions to the text and images. Credits for individual images are given in figure captions.
Updates: Page last updated July 1, 2022.
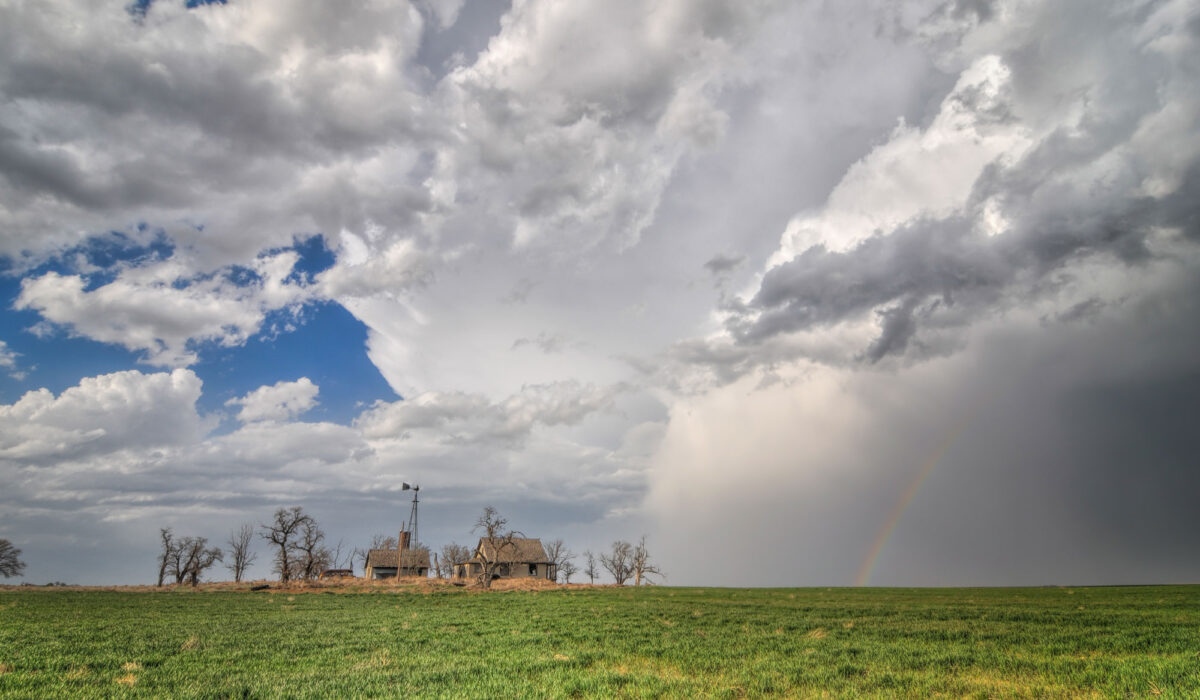
Image above: Sun and storm in Weld County, in the Great Plains region of Colorado, 2015. Photo by Lane Pearman (flickr, Creative Commons Attribution 2.0 Generic license, image cropped and resized).
Present climate of the southwestern U.S.
Although much of the Southwest falls within the category of an arid zone, using a single label to describe the Southwest's climate would belie its diversity. The main features that influence the area’s climate are latitude, regional topography, and a low atmospheric moisture content that leads to quick evaporation. For example, parts of the Colorado Rockies experience cool annual temperatures and over 8 meters (25 feet) of snowfall every year, while the dry deserts in southwestern Arizona receive only about 8 centimeters (3 inches) of precipitation a year and can experience as much as a 15°C (60°F) degree temperature difference between night and day.
The location of the Southwest and the topographical extremes across this area strongly influence its weather. The Southwest experiences nearly every variety of extreme weather; heat snaps and cold waves, droughts, floods, blizzards, and even tornados are all considerations for residents of the southwestern states.
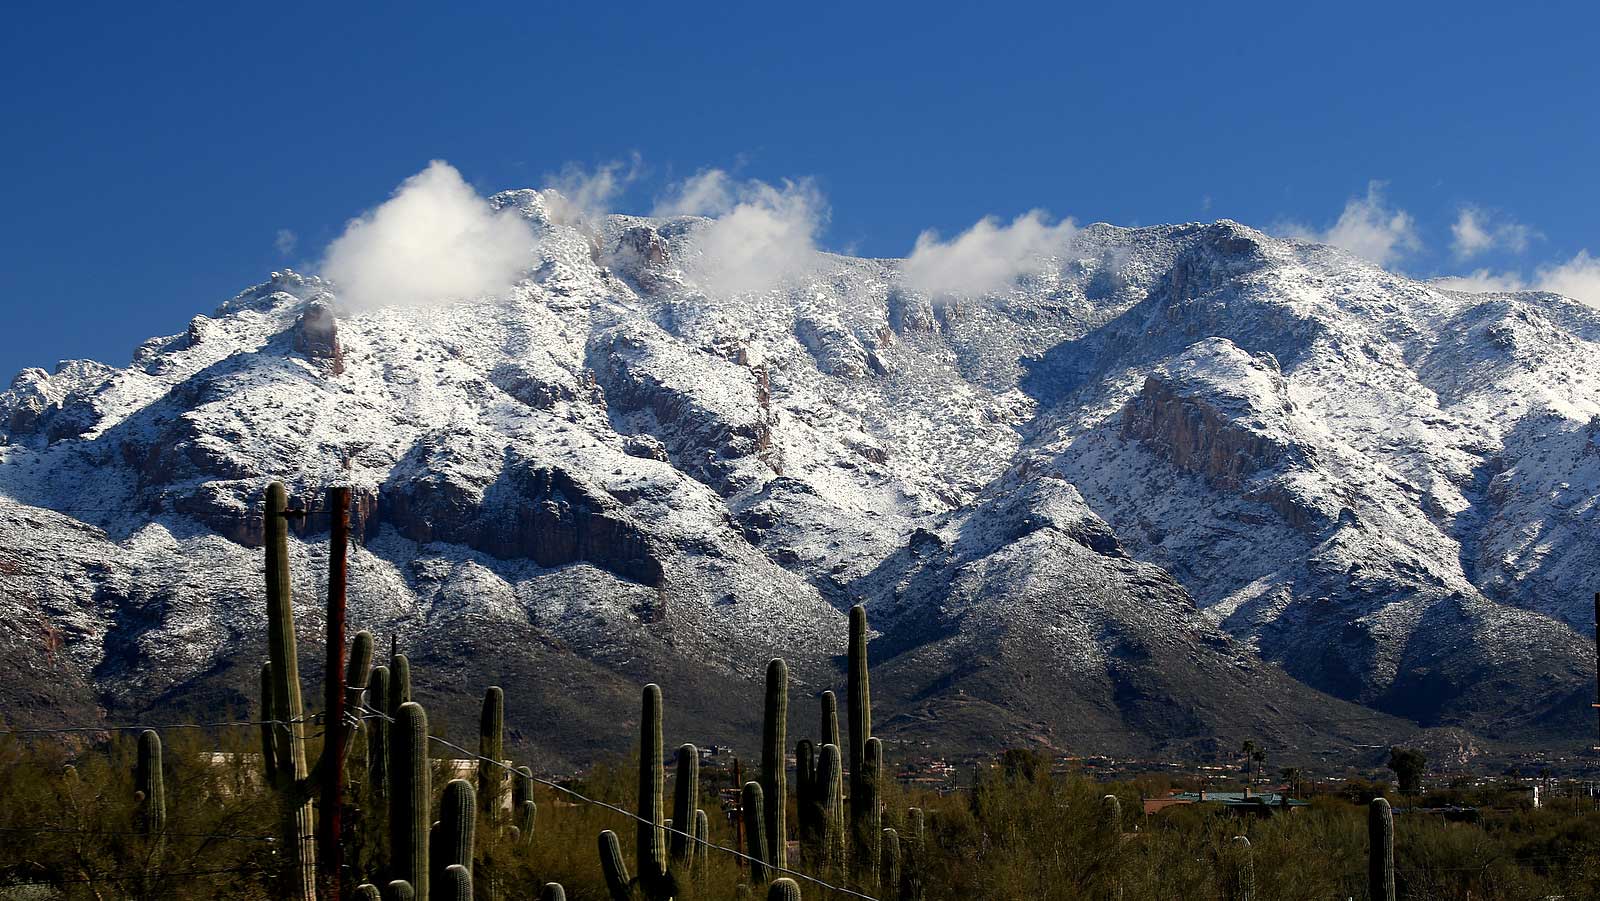
The Santa Catalina Mountains near Tucson, Arizona are surrounded desert in which saguaro cacti grow. The highest point in these mountains has a relief of 1572 meters (5157 feet) over the surrounding landscape, and the mountains are tall enough to receive snowfall. Photograph by Bill Morrow (Flickr; Creative Commons Attribution 2.0 Generic license).
Temperature
Average temperatures found in the Southwest tend to decrease northward, which is largely the influence of latitude and elevation. Lower latitudes receive more heat from the sun over the course of a year; for each degree increase in latitude, there is approximately a 1°C (2°F) decrease in temperature. Higher elevations (such as those found in the Rockies and on the Colorado Plateau) are also cooler, with approximately a 1.5°C (3°F) decrease in mean annual temperature for each 300-meter (1000-foot) increase in elevation. The warmest temperatures in the Southwest are found in Arizona and New Mexico, while the coolest are found in Utah and Colorado. The Southwest's overall average high temperature of 19.2°C (66.6°F) and average low of 2.8°C (37.0°F) are indicative of a varied climate, one much less uniform than that found in many other parts of the United States. By comparison, the average high and low temperatures for the entire United States are 17°C (63°F) and 5°C (41°F), respectively.
Another factor besides latitude and elevation that influences temperature in the Southwest is its arid climate. The lack of moisture in the air allows heat trapped in the earth during daylight hours to rapidly radiate away, leading to cool evenings. Thus, each Southwestern state experiences both extreme highs and lows. In New Mexico, for example, the average difference between the daily high and low temperatures ranges from 14° to 19°C (25° to 35°F). Record high temperatures for the Southwest range from 53°C (128°F) in Arizona to 47°C (117°F) in Utah, while record low temperatures range from −56°C (−69°F) in Utah to −40°C (−40°F) in Arizona.
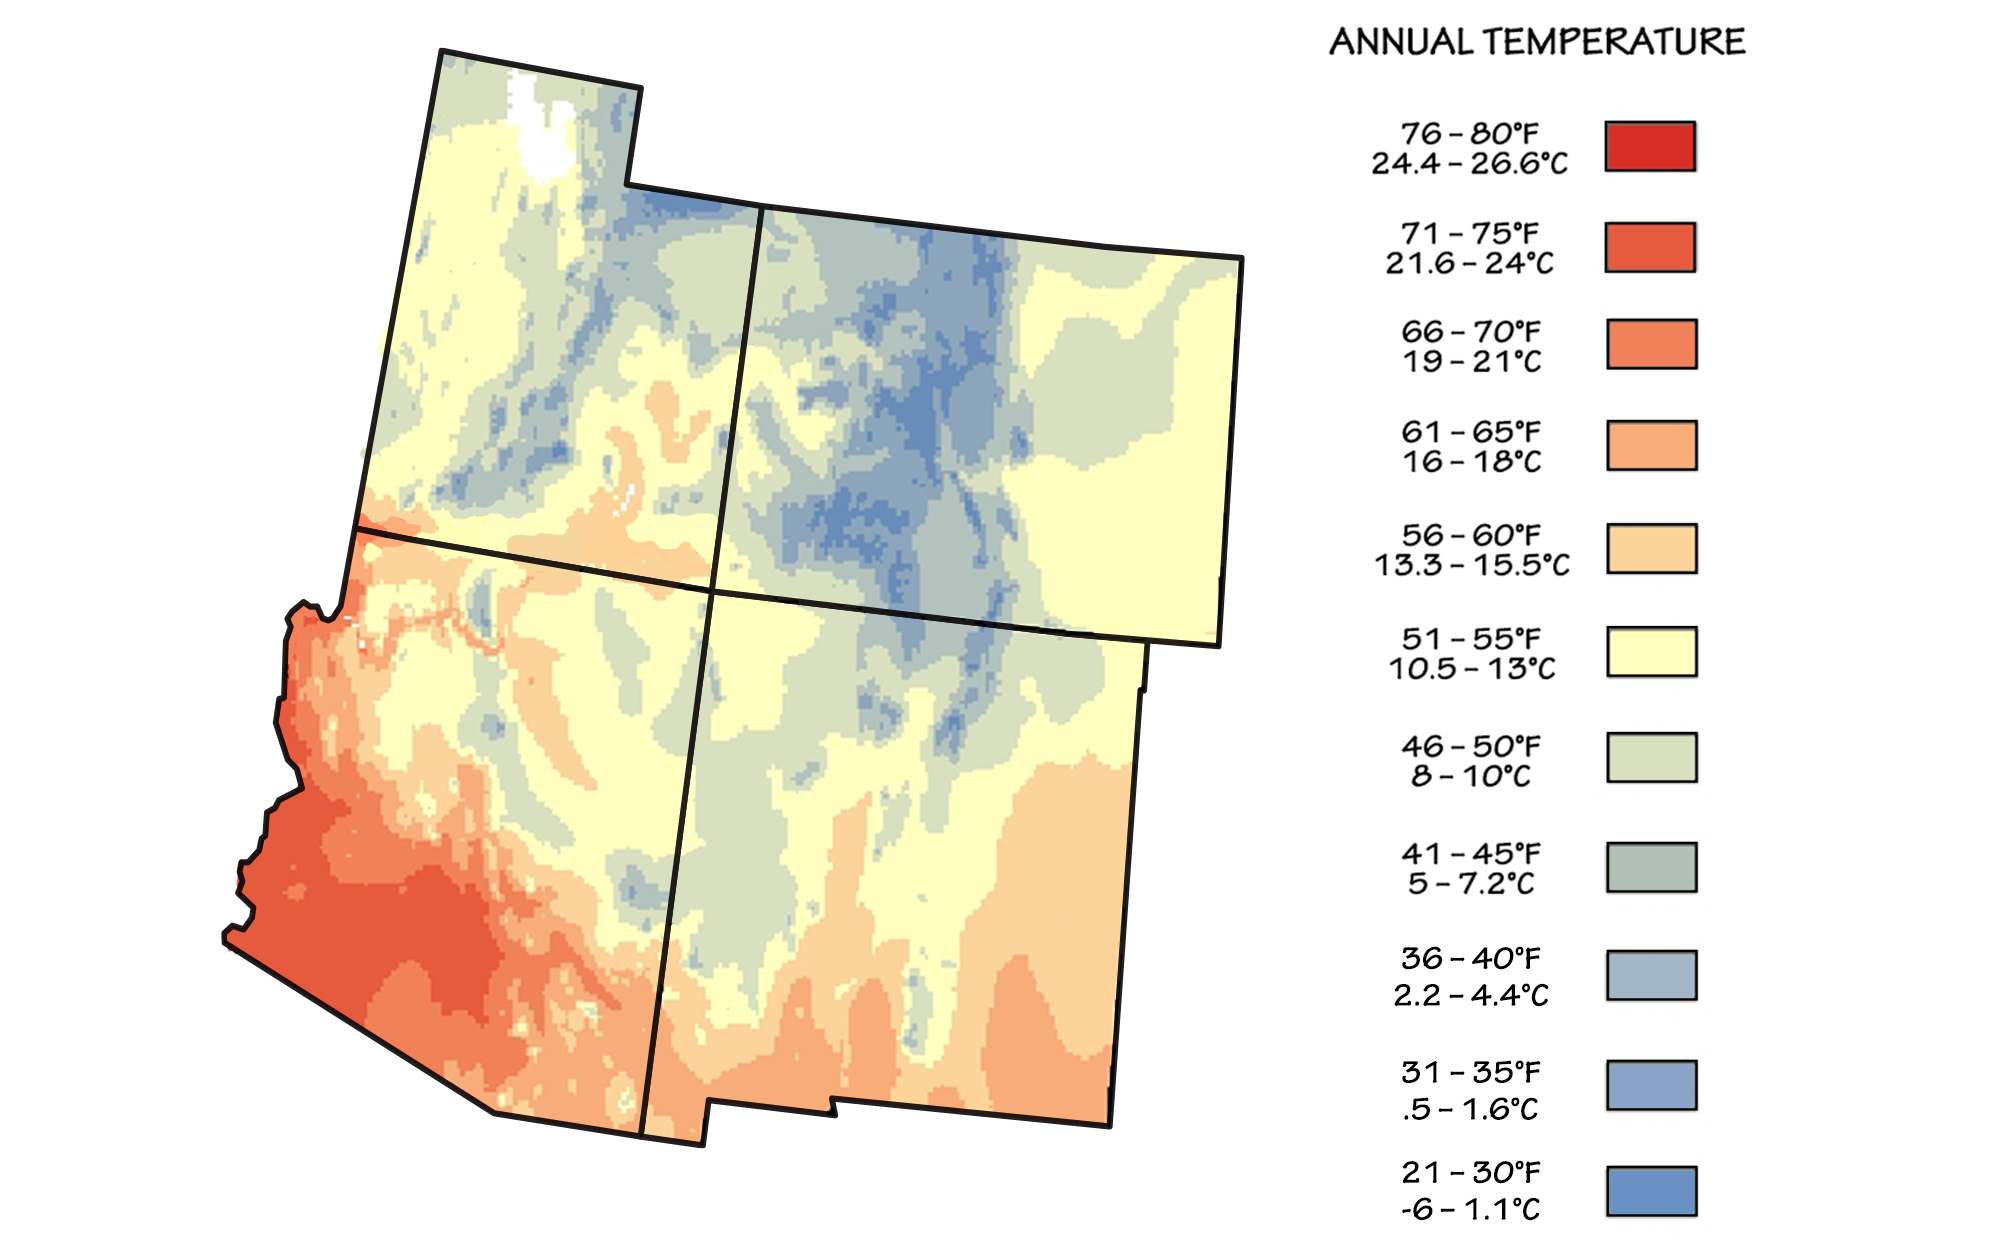
Average annual temperatures for the southwestern U.S. Image adapted from an image by Scenarios for Climate Assessment and Adaptation, first published in The Teacher-Friendly Guide to the Earth Science of the Southwestern US.
Average Annual Temperatures in the Southwestern United States
| Arizona | 16.0°C (60.8°F) | 7.6°C (45.7°F) | 24.5°C (76.1°F) |
| New Mexico | 11.9°C (53.2°F) | 3.0°C (37.4°F) | 20.3°C (68.5°F) |
| Utah | 9.1°C (48.4°F) | 1.5°C (34.7°F) | 16.7°C (62.1°F) |
| Colorado | 7.5°C (45.5°F) | -0.9°C (30.4°F) | 15.4°C (59.7°F) |
Precipitation
The average precipitation for the United States is 85.6 centimeters (33.7 inches). In the Southwest, average precipitation ranges from only 34 centimeters (13.4 inches) in Utah to 39.9 centimeters (15.7 inches) in Colorado, which reflects the area's general aridity. Elevation does, however, play a key role in precipitation received throughout the Southwest. In New Mexico, for example, average annual precipitation ranges from less than 25 centimeters (10 inches) within the Great Plains and Basin and Range regions to more than 50 centimeters (20 inches) at the higher elevations to the northwest. Arizona's highest elevations receive an average of 65 to 76 centimeters (25 to 30 inches), with lower areas in the state’s southwestern portion averaging less than 8 centimeters (3 inches). In Utah, areas below 1200 meters (4000 feet) receive less than 25 centimeters (10 inches) per year, while higher elevations in the Wasatch Mountains receive more than 100 centimeters (40 inches).
Across New Mexico, Arizona, and Utah, summer rains originate from moisture brought into the area from the Gulf of Mexico. Warm, moist air from the south occasionally but infrequently moves into Colorado during the summer. During the winter, moisture travels from the west, as storms from the Pacific Ocean move east. Pacific storms lose most of their moisture as they pass over the Rocky Mountains, so much of the Southwest's winter precipitation falls as snow within the area’s mountainous regions.
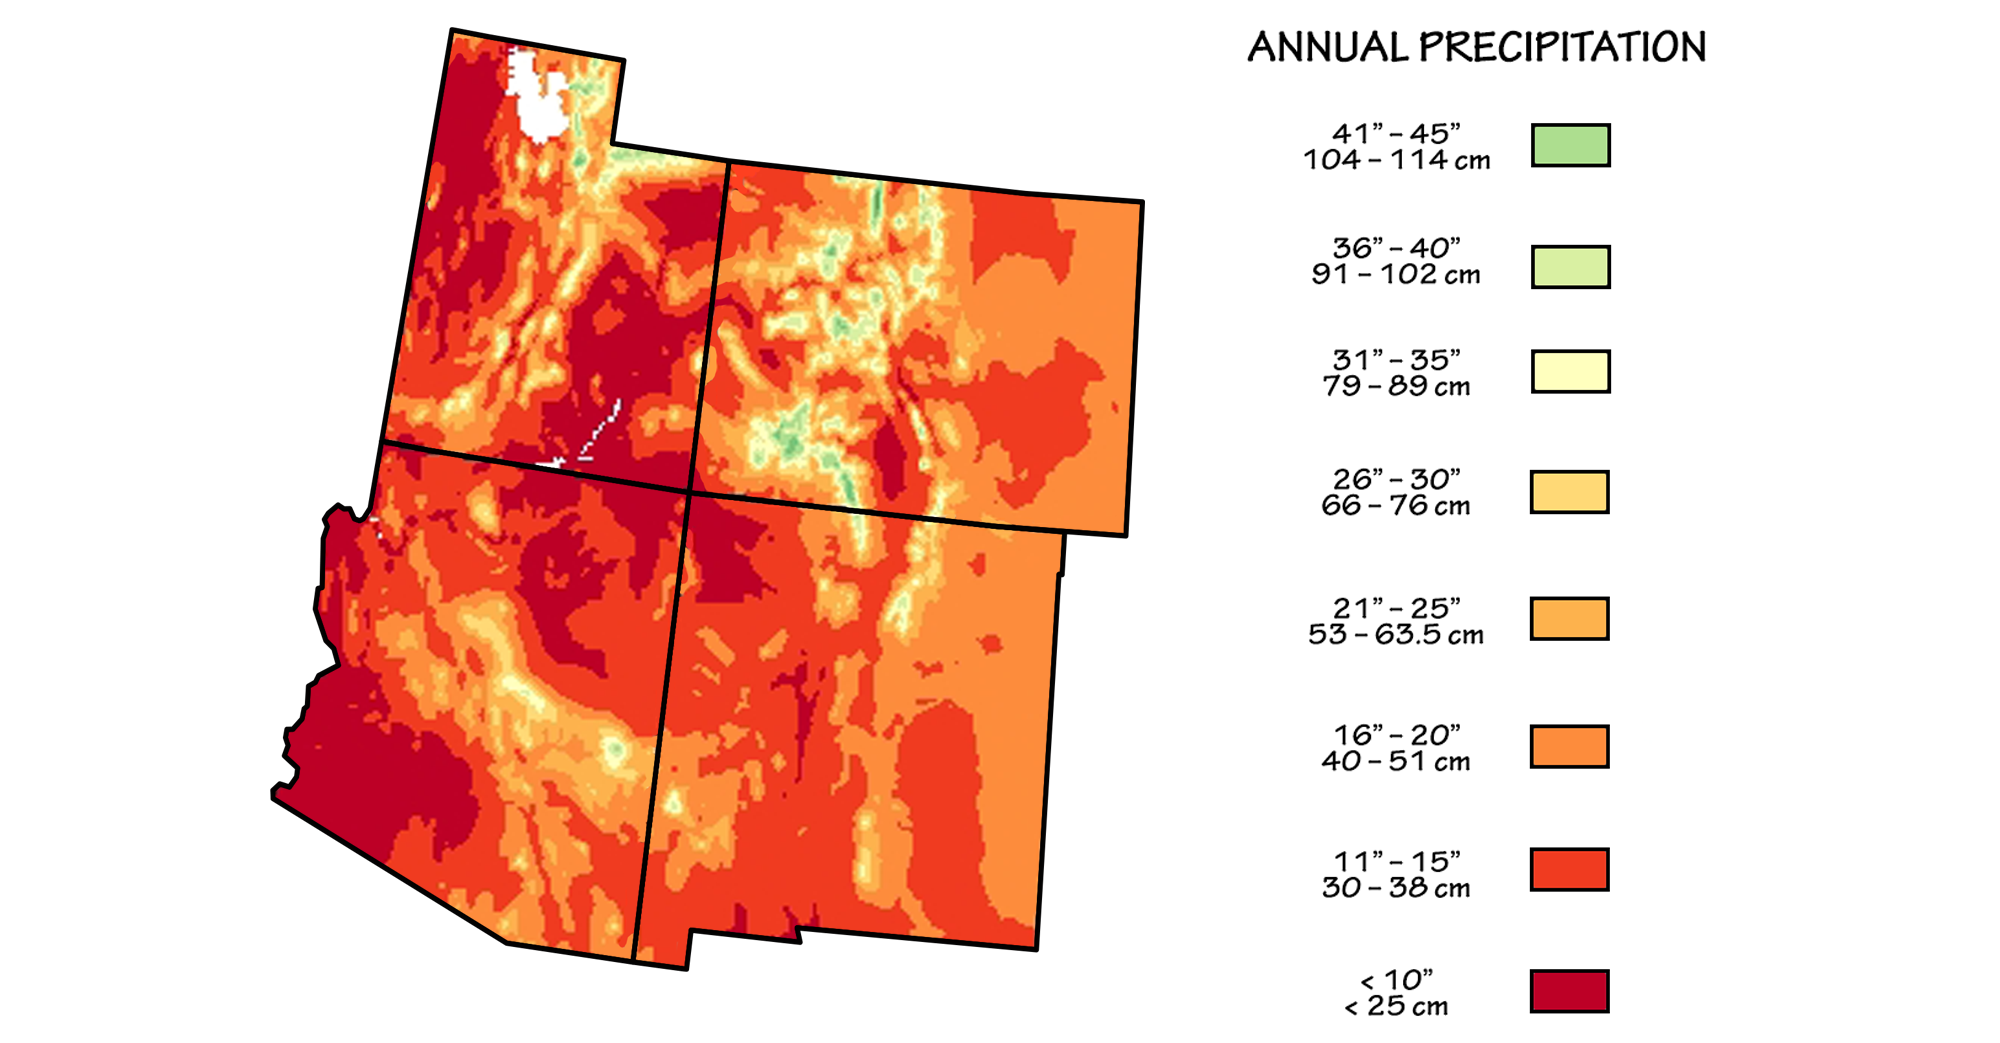
Average annual preciptiation for the southwestern U.S. Image adapted from an image by Scenarios for Climate Assessment and Adaptation, first published in The Teacher-Friendly Guide to the Earth Science of the Southwestern US.
Severe Weather
Thunderstorms and tornados
The geography and climate of the southwestern U.S. east of the Rocky Mountains (in other words, in the Great Plains region in Colorado and New Mexico) are nearly ideal for their formation of thunderstorms and tornados, especially in the summer.
Storms form when there is strong convection in the atmosphere. Convection occurs when buoyant warm air rises (moves up) while denser cool air sinks (moves down). Convective mixing forces the moisture in warm air to condense as it comes into contact with cool air, forming vapor (clouds) and precipitation (for example, rain or hail). A strong difference in air temperature at different heights creates instability; the warmer the air near the surface is relative to the air above it, the more potential (stored) energy the warm air has to move up, and the more potential for a storm. The final ingredient is wind. Wind moves the air, promoting mixing. The formation of precipitation also causes electrical charging of particles in the atmosphere, which in turn produces lightning.
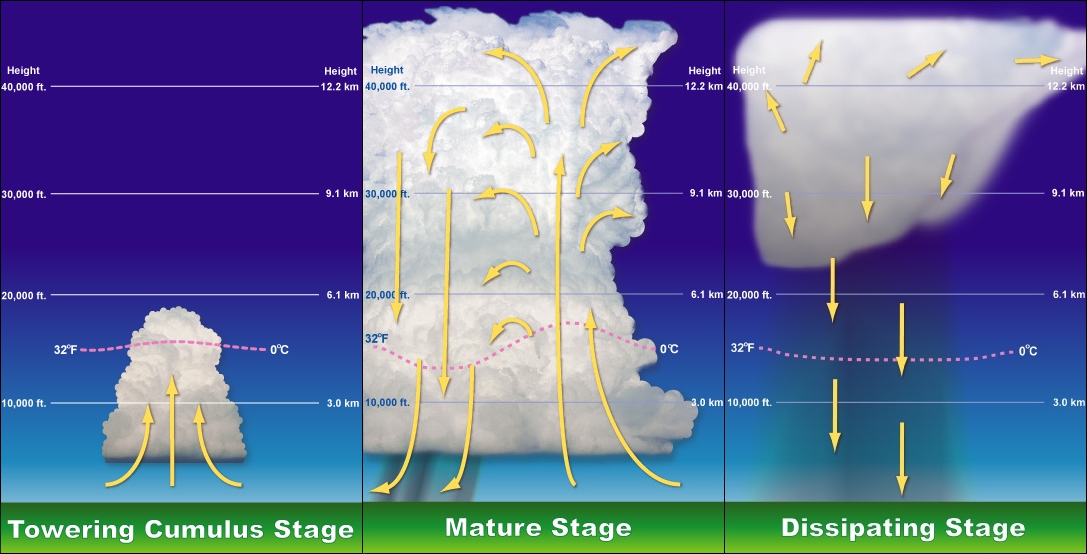
Stages in the formation of a thunderstorm. Left: Warm air rises. Moisture condenses out of the warm air as it comes into contact with cool air, forming clouds. Center: As warm air rises, cool air sinks. Precipitation forms. Right: As the vertical column of air turns over, with warm air at the top and cool air at the bottom, the storm begins to dissipate. Image by The High Fin Sperm Whale, created from images by NOAA National Weather Service training material (Wikimedia Commons, public domain).
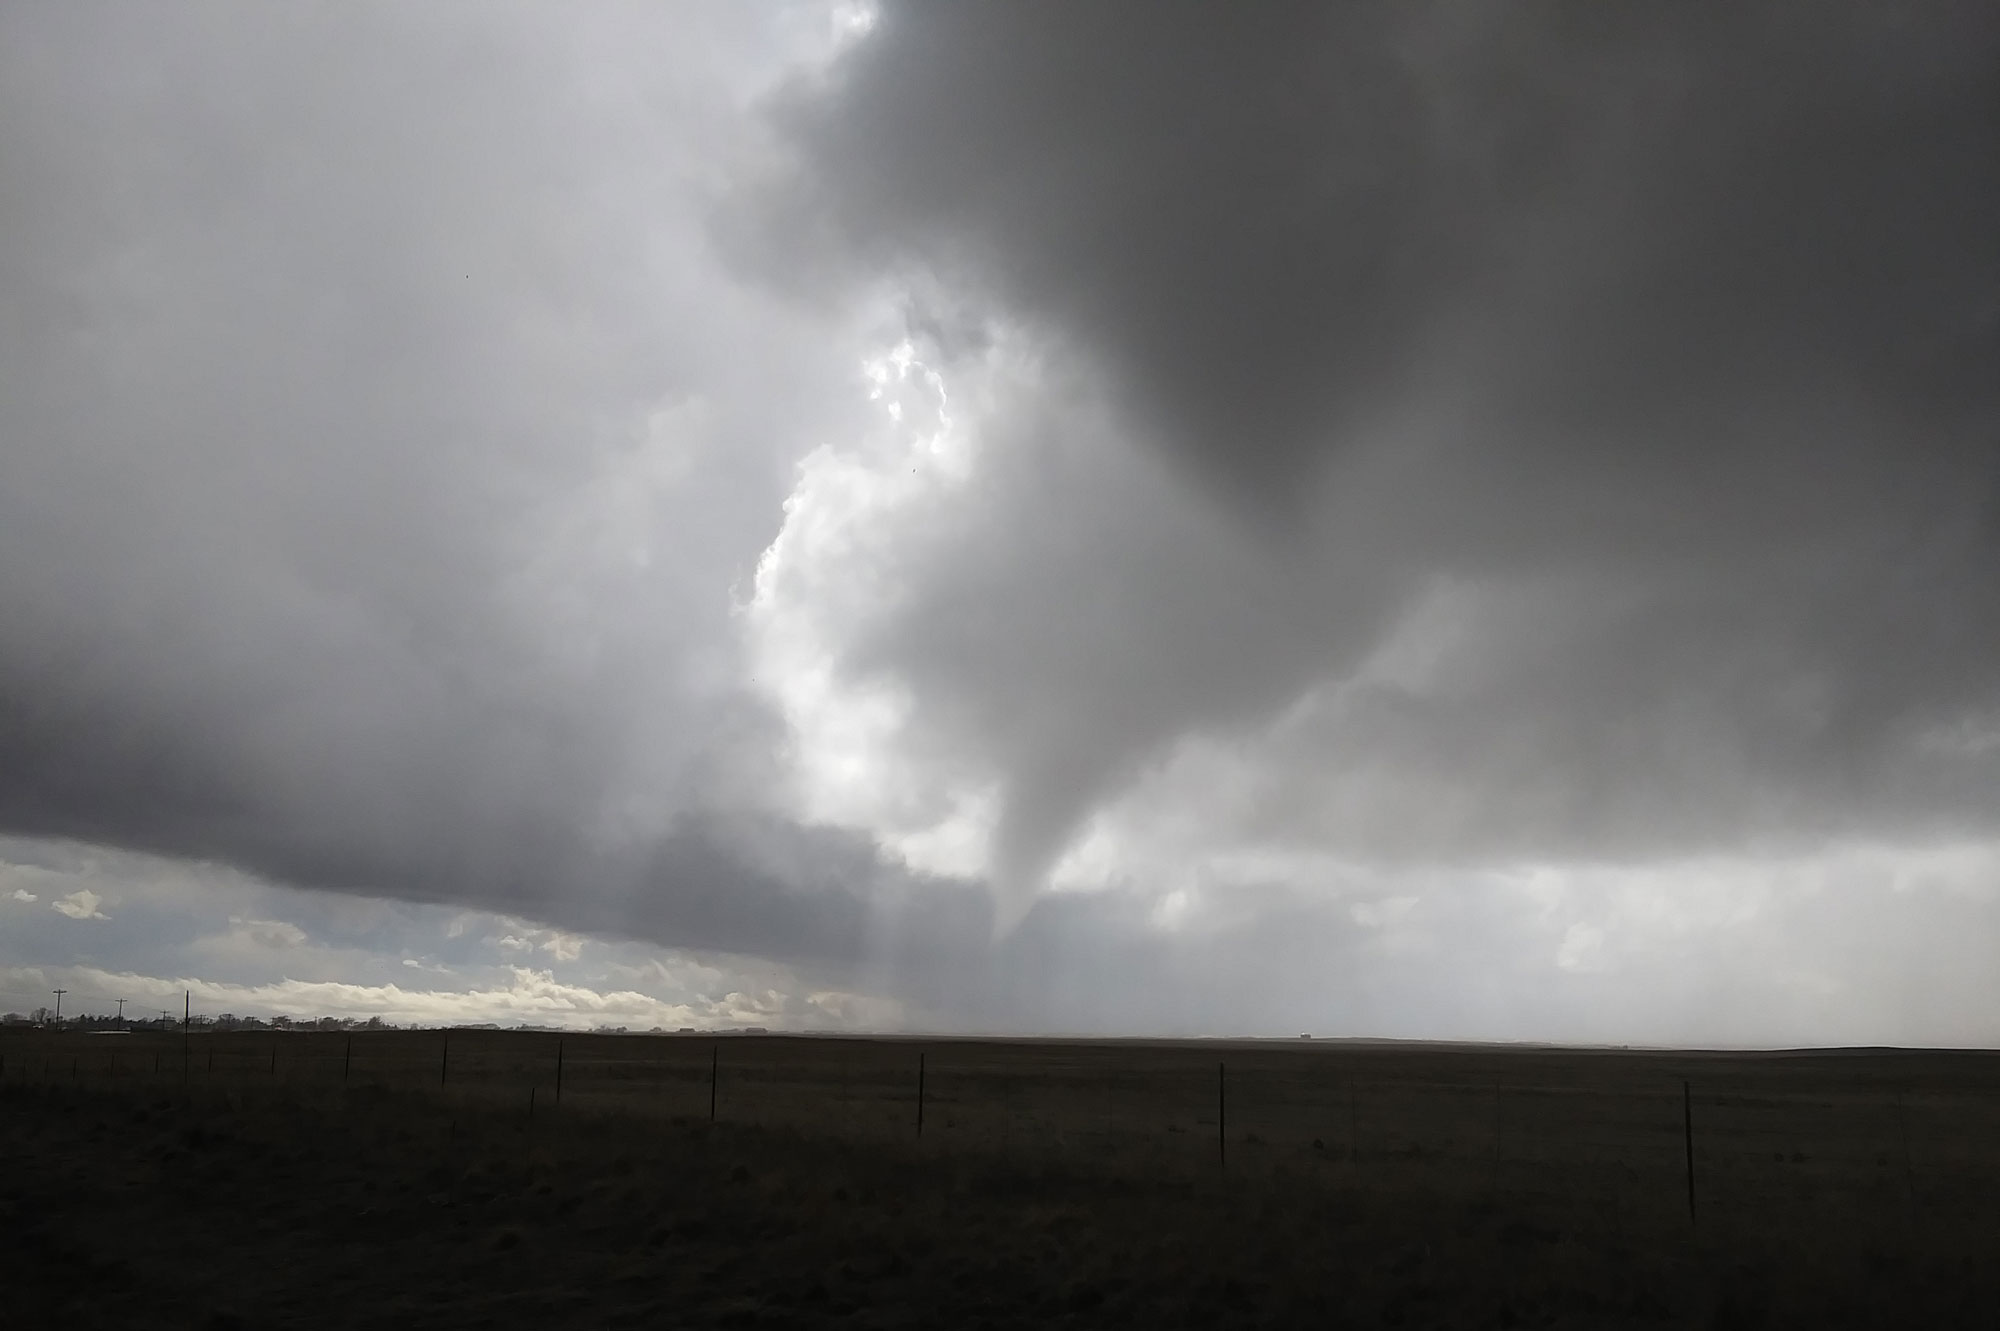
Funnel clouds (developing tornadoes) over El Paso County, Colorado, March 29, 2019. Photo by Stefan Klein (Wikimedia Commons, Creative Commons Attribution-ShareAlike 4.0 International license, image cropped and resized)
Typically, a storm blows itself out once the warm air has moved up and the cool air has moved down. Convective mixing stops because the vertical column of air has turned over so that the cool air is at the bottom and the warm air is at the top.
A strong temperature difference at different heights creates instability. The warmer the air near the surface is relative to the air above it, the more potential energy it has to move up. The Great Plains receive warm, moist air moving north from the Gulf of Mexico, and cold, dry air moving in from the Rocky Mountains and the northern U.S. Where these air masses meet, vigorous mixing causes thunderstorms. Because warm air can hold more moisture than cool air can, convective mixing with cool air forces moisture to condense out of warm air as vapor (clouds) and precipitation. This movement of air in different directions is also the reason for the high incidence of powerful tornados that occur along "Tornado Alley" in the Great Plains, which affect eastern New Mexico and especially eastern Colorado.
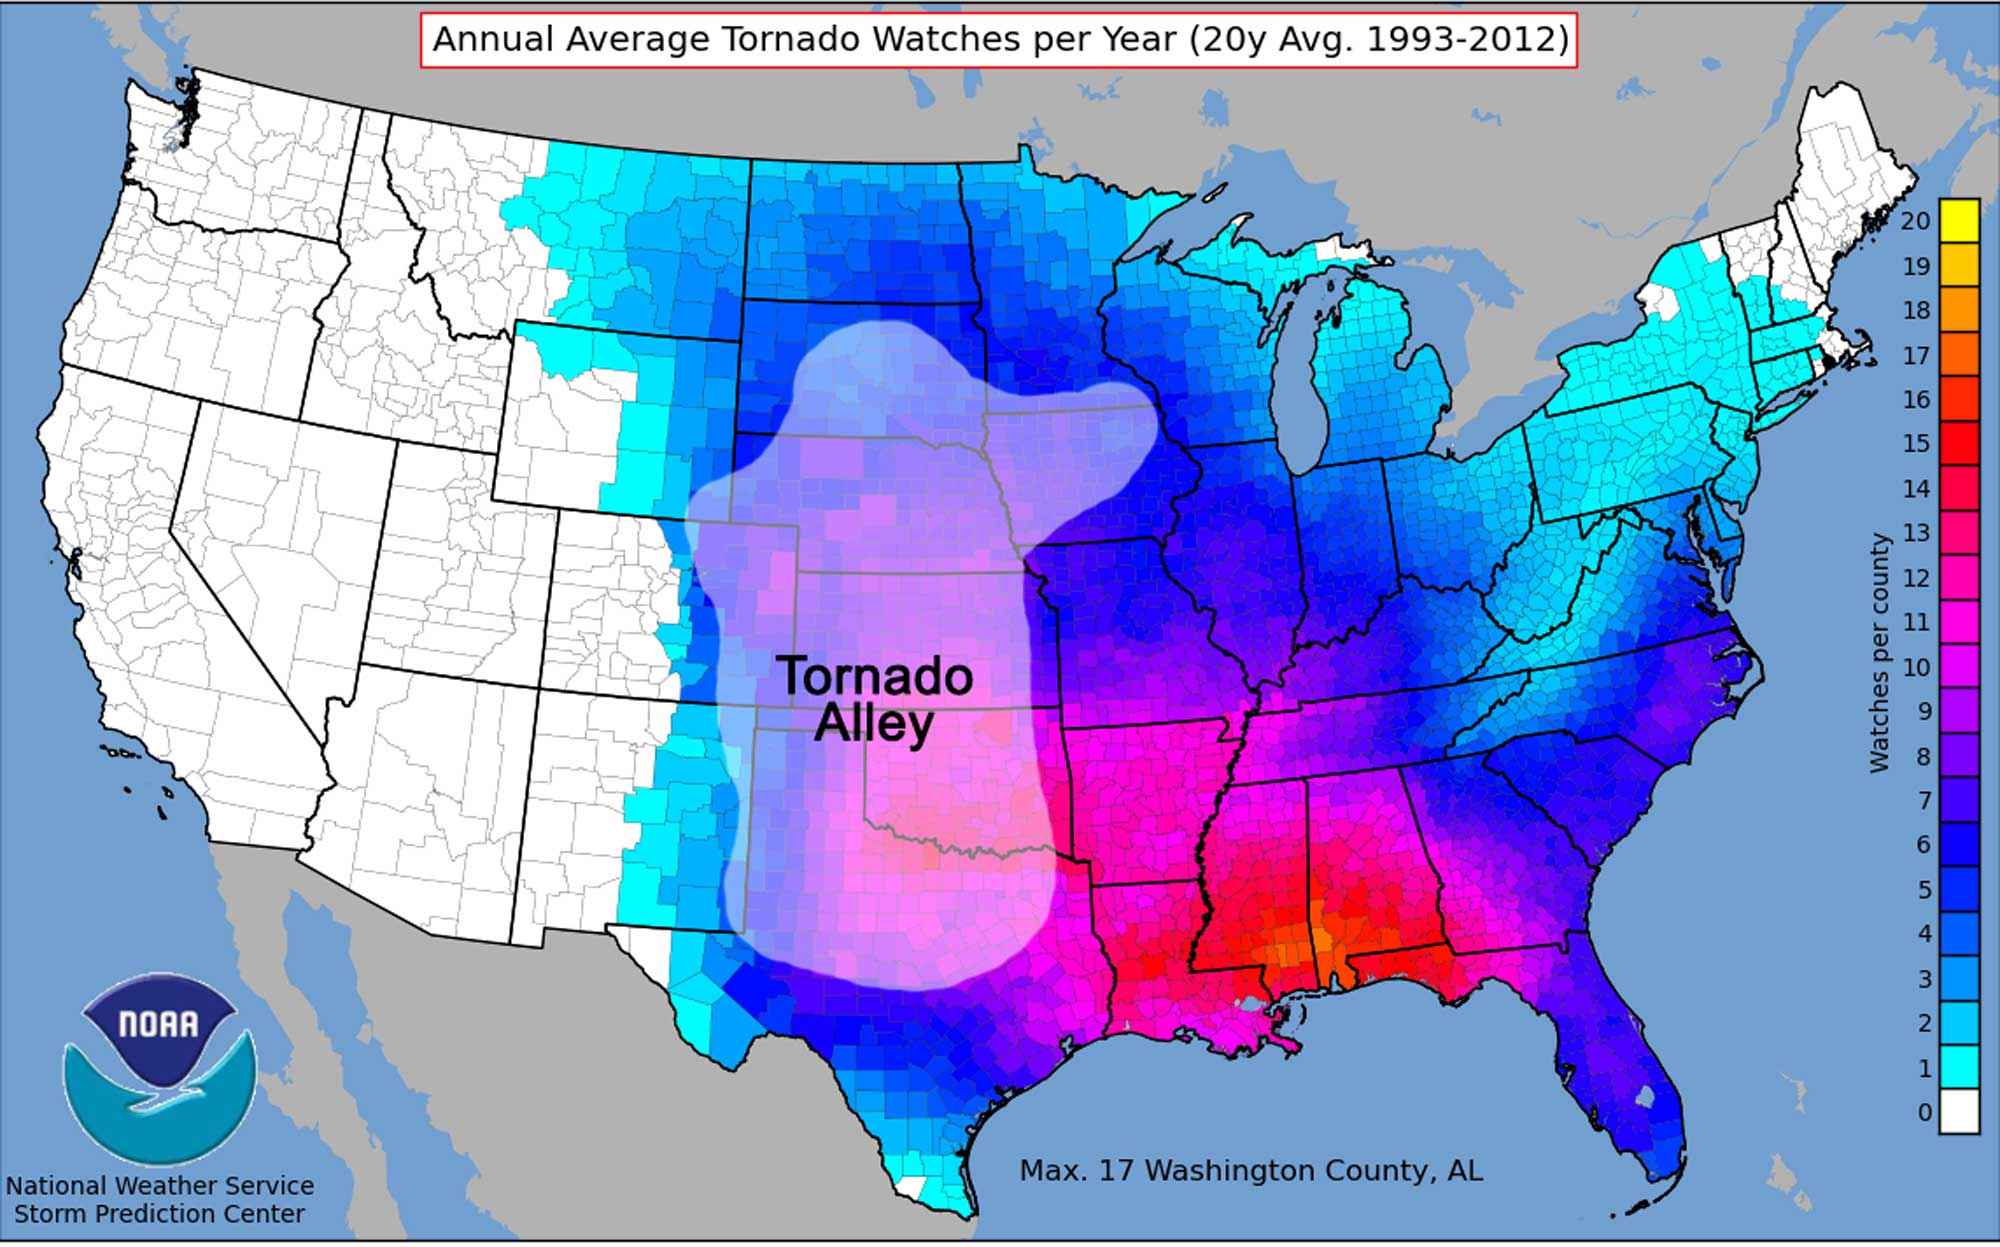
Average yearly tornado watches in each county of the United States between 1993 and 2012. Tornado Alley is identified. Map by NOAA (public domain) modified for the Earth@Home project.
Regional climate variation
In a broad sense, the Southwest’s climate is mostly dry and hot, with much of the region characterized as arid. Dry conditions are common throughout the Great Plains, Colorado Plateau, and Basin and Range. Cold continental conditions dominate the higher altitudes, especially within the Rocky Mountains. Scattered pockets of drier, Mediterranean temperatures can also be found.
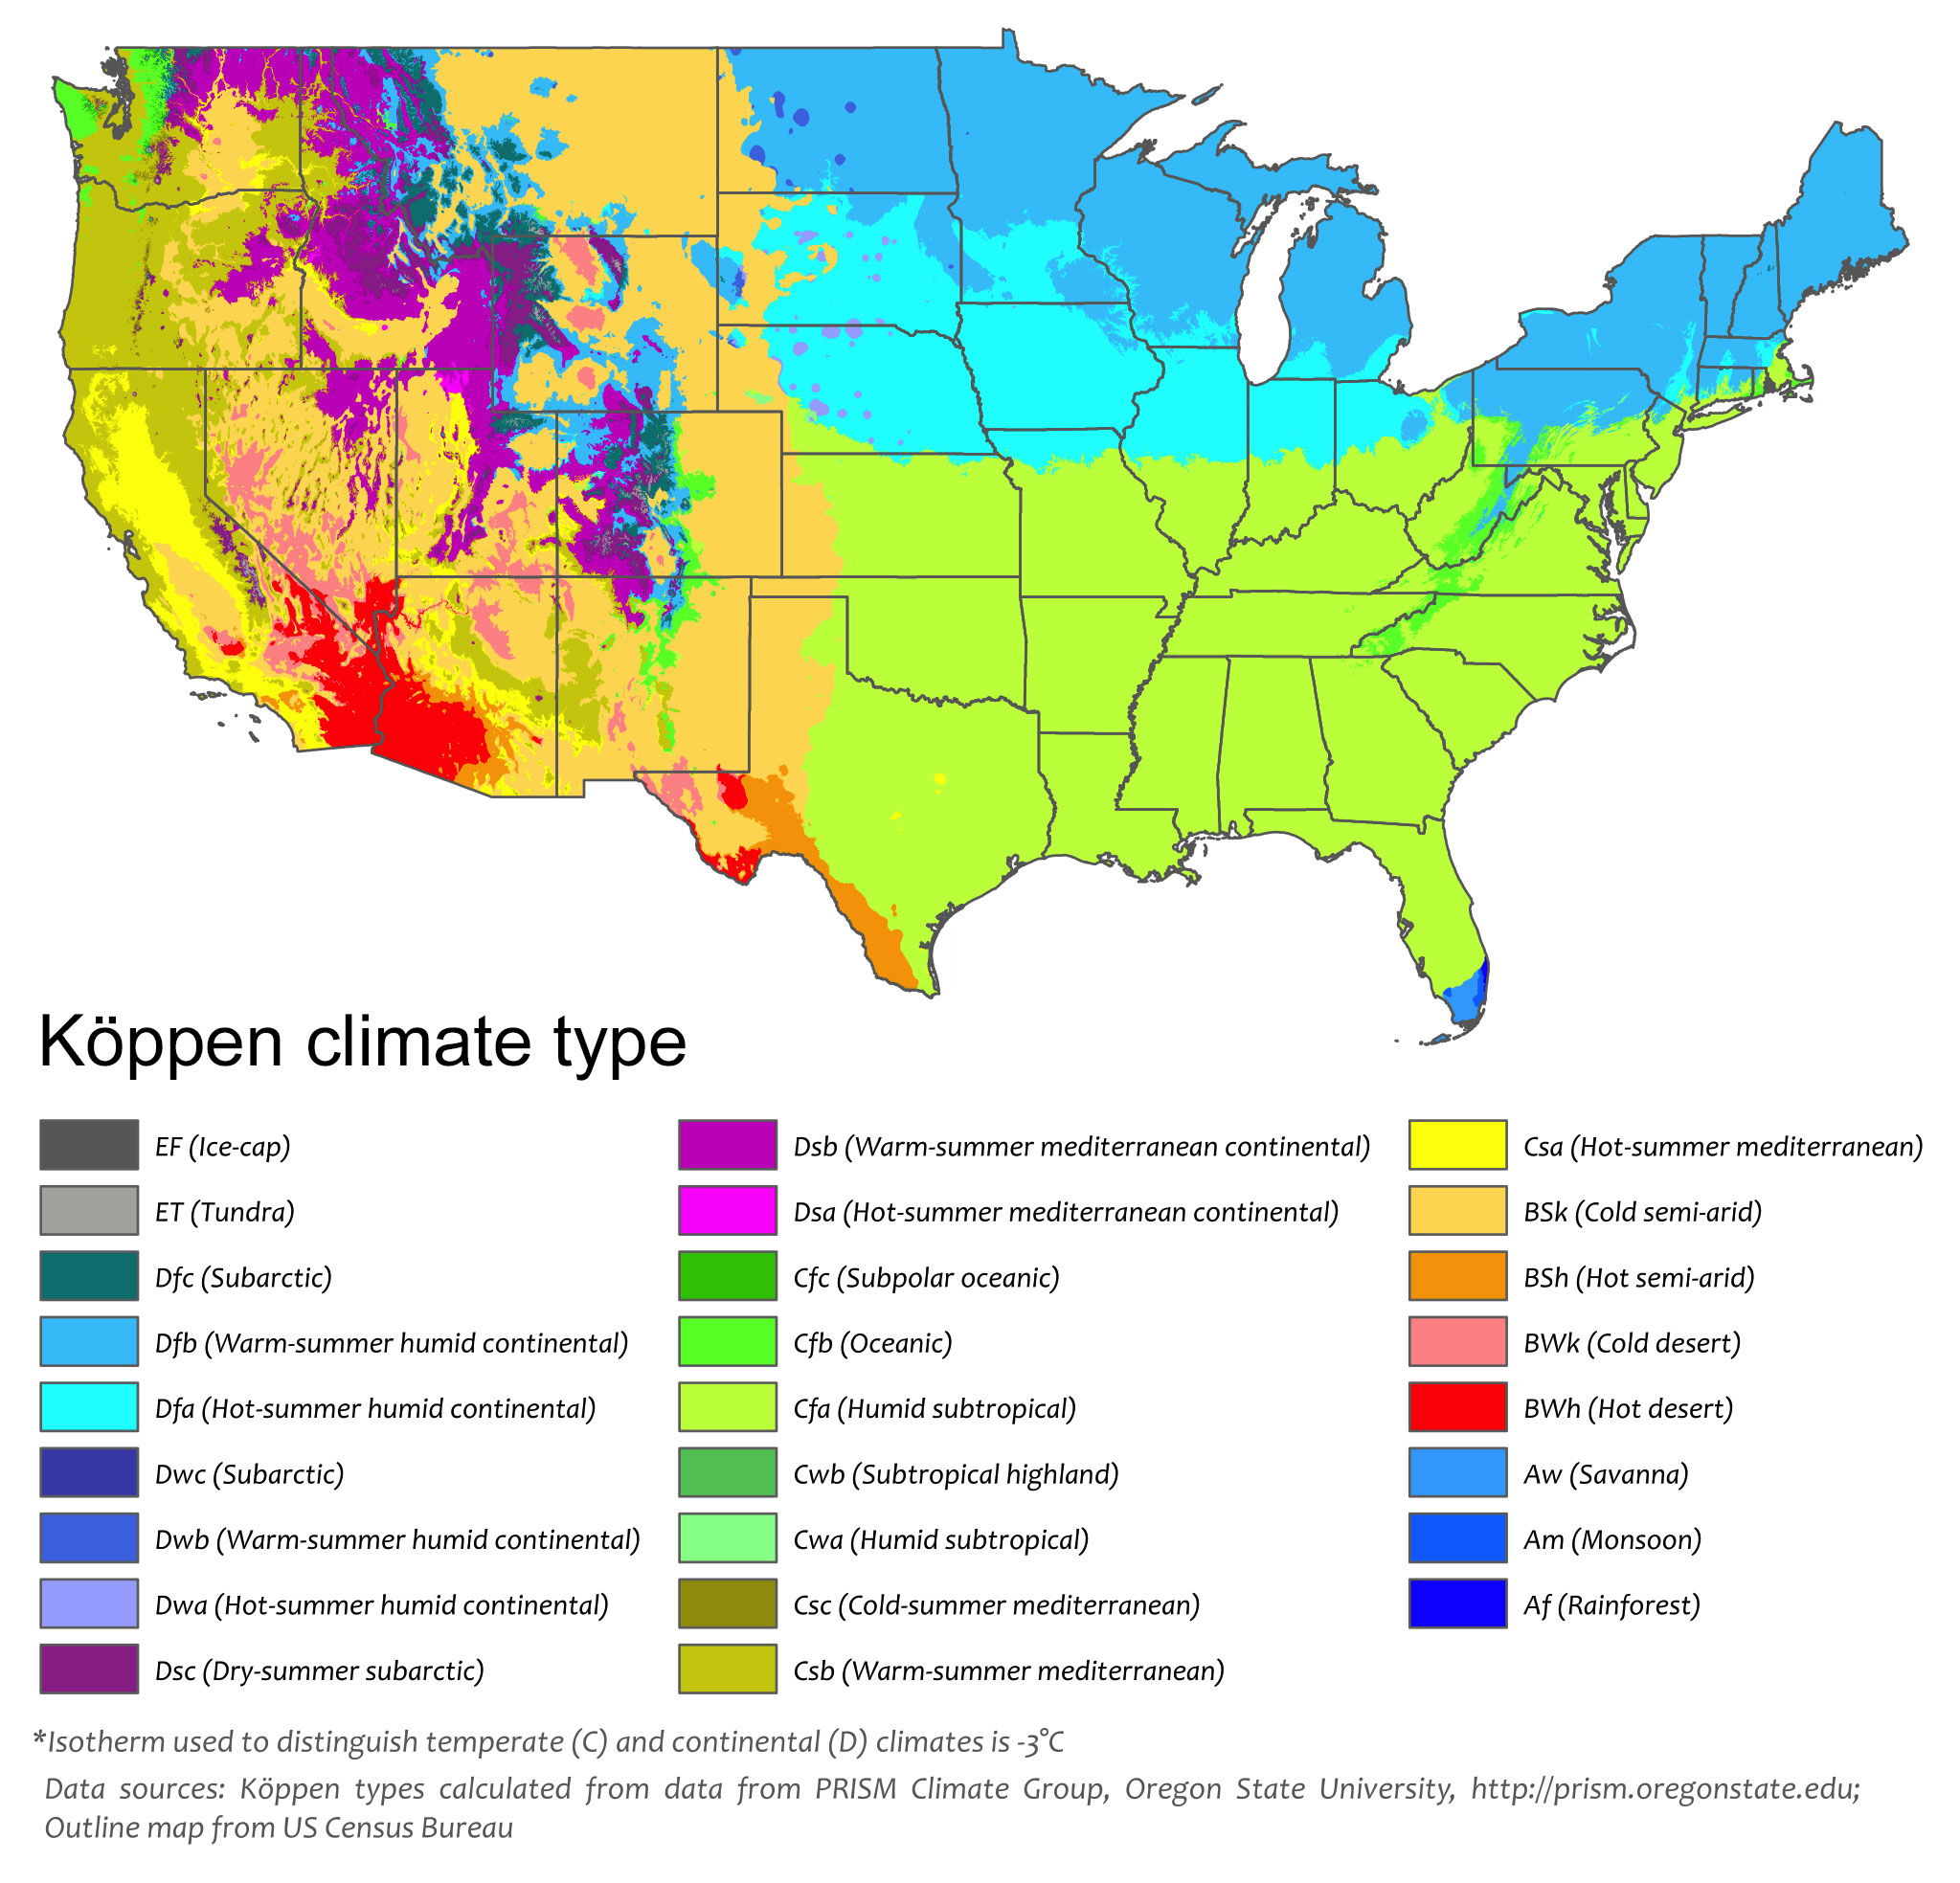
Köppen climate map of the 48 contiguous states of the continental United States. The first letter of each zone in the key indicates its major classification. A = Tropical (equatorial), B = Arid, C = Temperate (warm temperate), D = Continental (cold), E = polar. Modified from a map by Adam Peterson (Wikimedia Commons, Creative Commons Attribution-ShareAlike 4.0 International license).
Arizona
Arizona's climate is influenced by three main topographical areas: the high Colorado Plateau (about 1520–2130 meters or 5000–7000 feet in elevation), the rugged mountains to the west (2740–3660 meters or 9000–12000 feet high), and the low southwestern mountains with desert valleys (as low as 30 meters or 100 feet above sea level). While the state is generally arid, its high western mountains experience more precipitation each year than the desert southwest and the high northeastern plateau do. The desert experiences large temperature extremes, especially between day and night; daily temperature may change as much as 15°C (60°F) during the driest parts of the year.
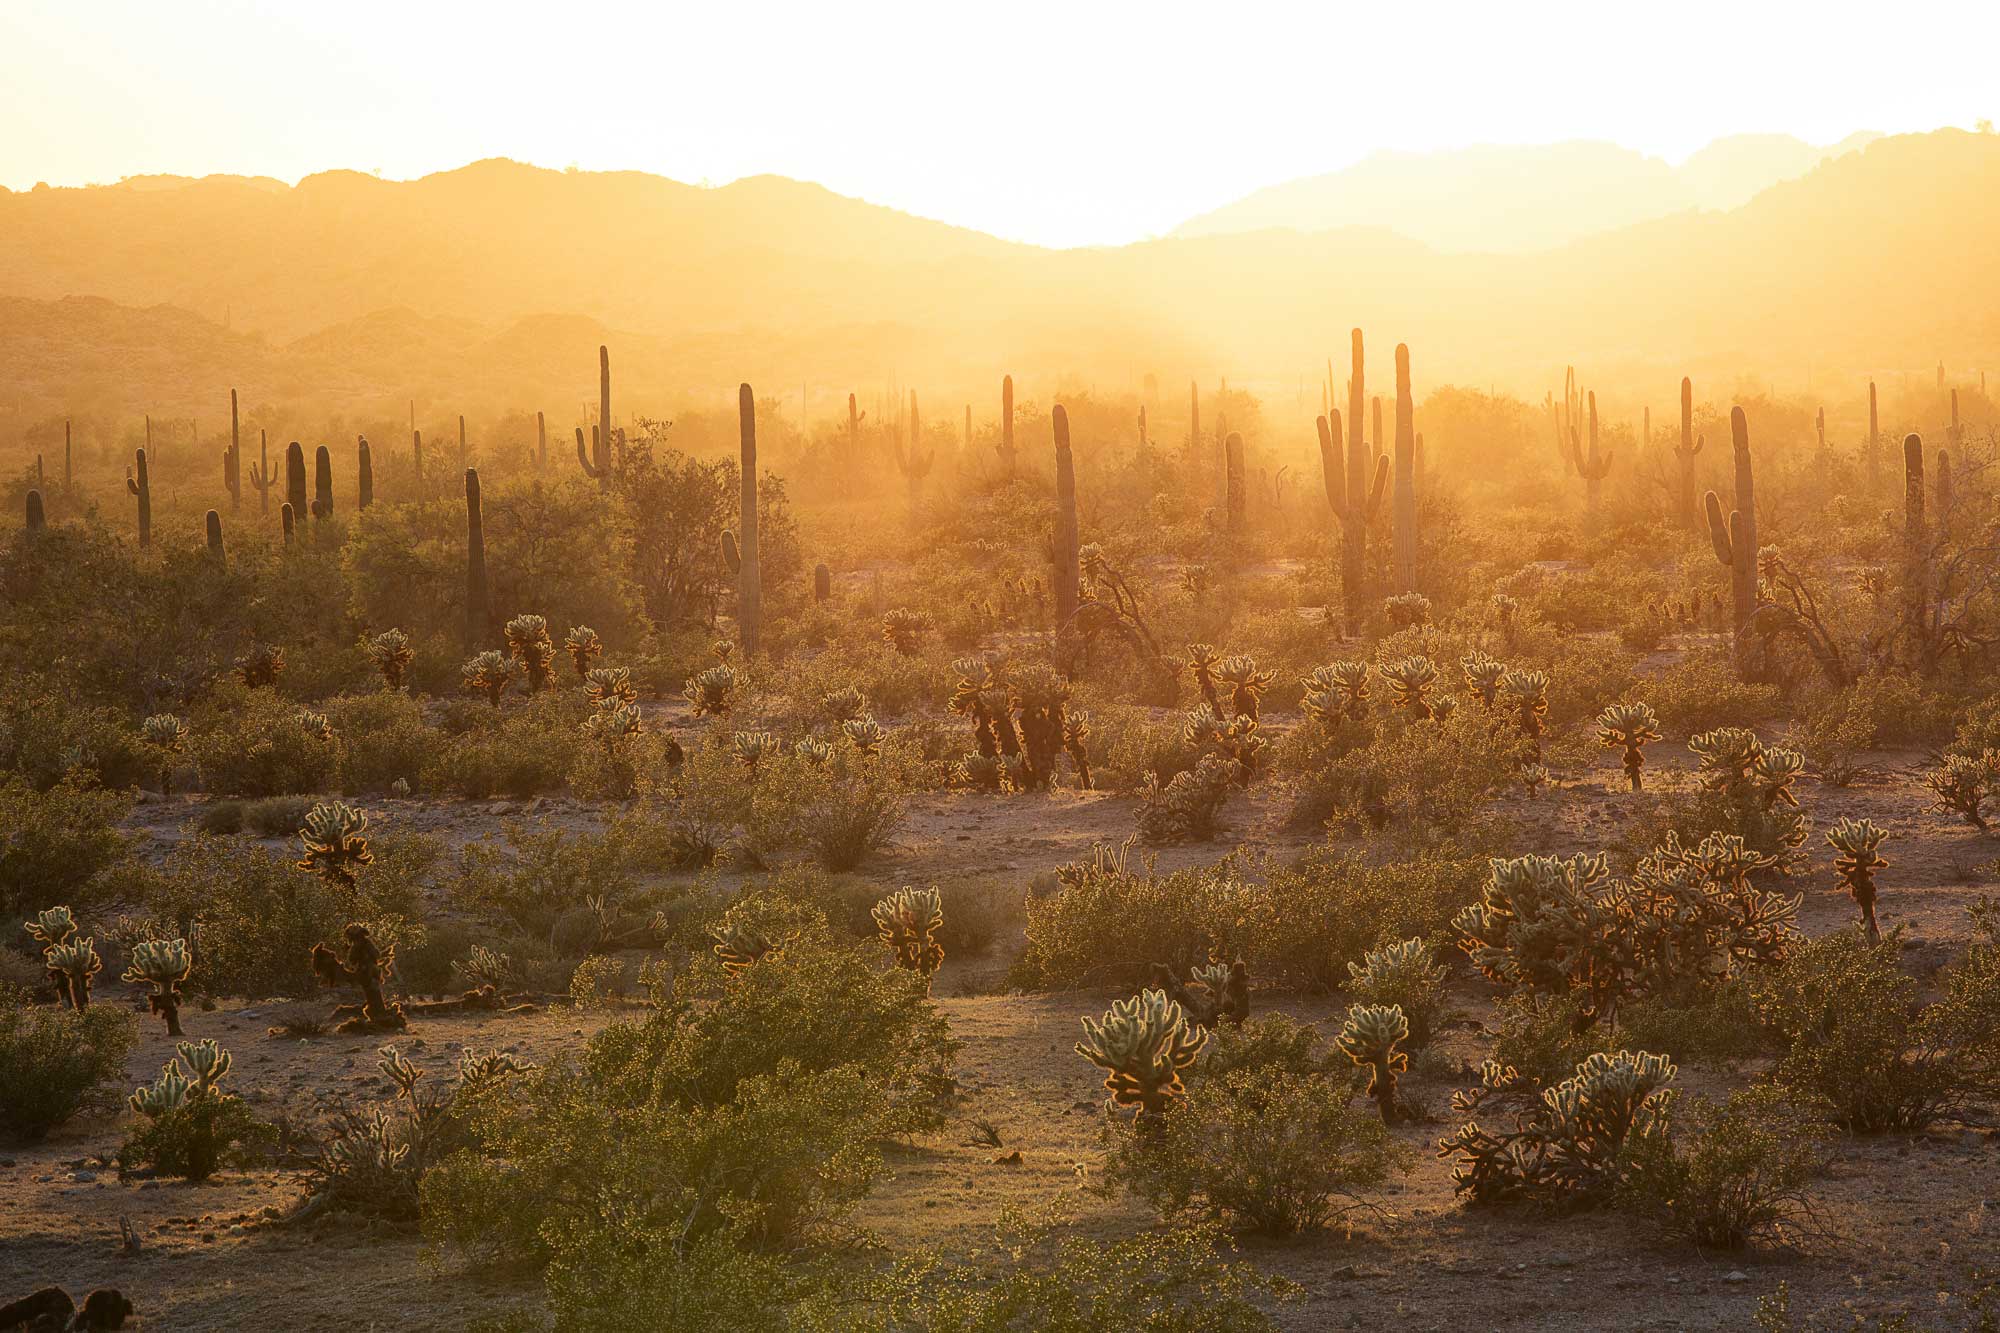
Saguaro and cholla cacti in the Sonoran Desert National Monument, Arizona. The Sonoran Desert is located in southwestern Arizona and adjacent regions of California and Mexico. Photo by Bob Wick, Bureau of Land Management (flickr, public domain).
Colorado
Colorado has a generally cool and continental climate with low humidity. The climate of the eastern plains is fairly uniform, with hot, windy summers and thunderstorms. The state's highest temperatures occur in the northeastern plains, where they can exceed 46°C (115°F). Moving westward, Colorado's foothills and mountainous areas experience an overall cooler climate and higher levels of precipitation. Here, the state’s varied topography leads to wide changes in climactic conditions that occur across short distances. For example, the difference in annual mean temperature between Pikes Peak (4302 meters or 14,114 feet) and Las Animas (1188 meters or 3898 feet), only 145 kilometers (90 miles) to the southeast, is equivalent to that between Iceland and southern Florida! Precipitation also varies widely. Cumbres in the San Juan Mountains receives nearly 7.6 meters (300 inches) of snowfall annually, while Manassa, less than 50 kilometers (30 miles) away in the San Luis Valley, receives only about 63 centimeters (25 inches) of snow a year.
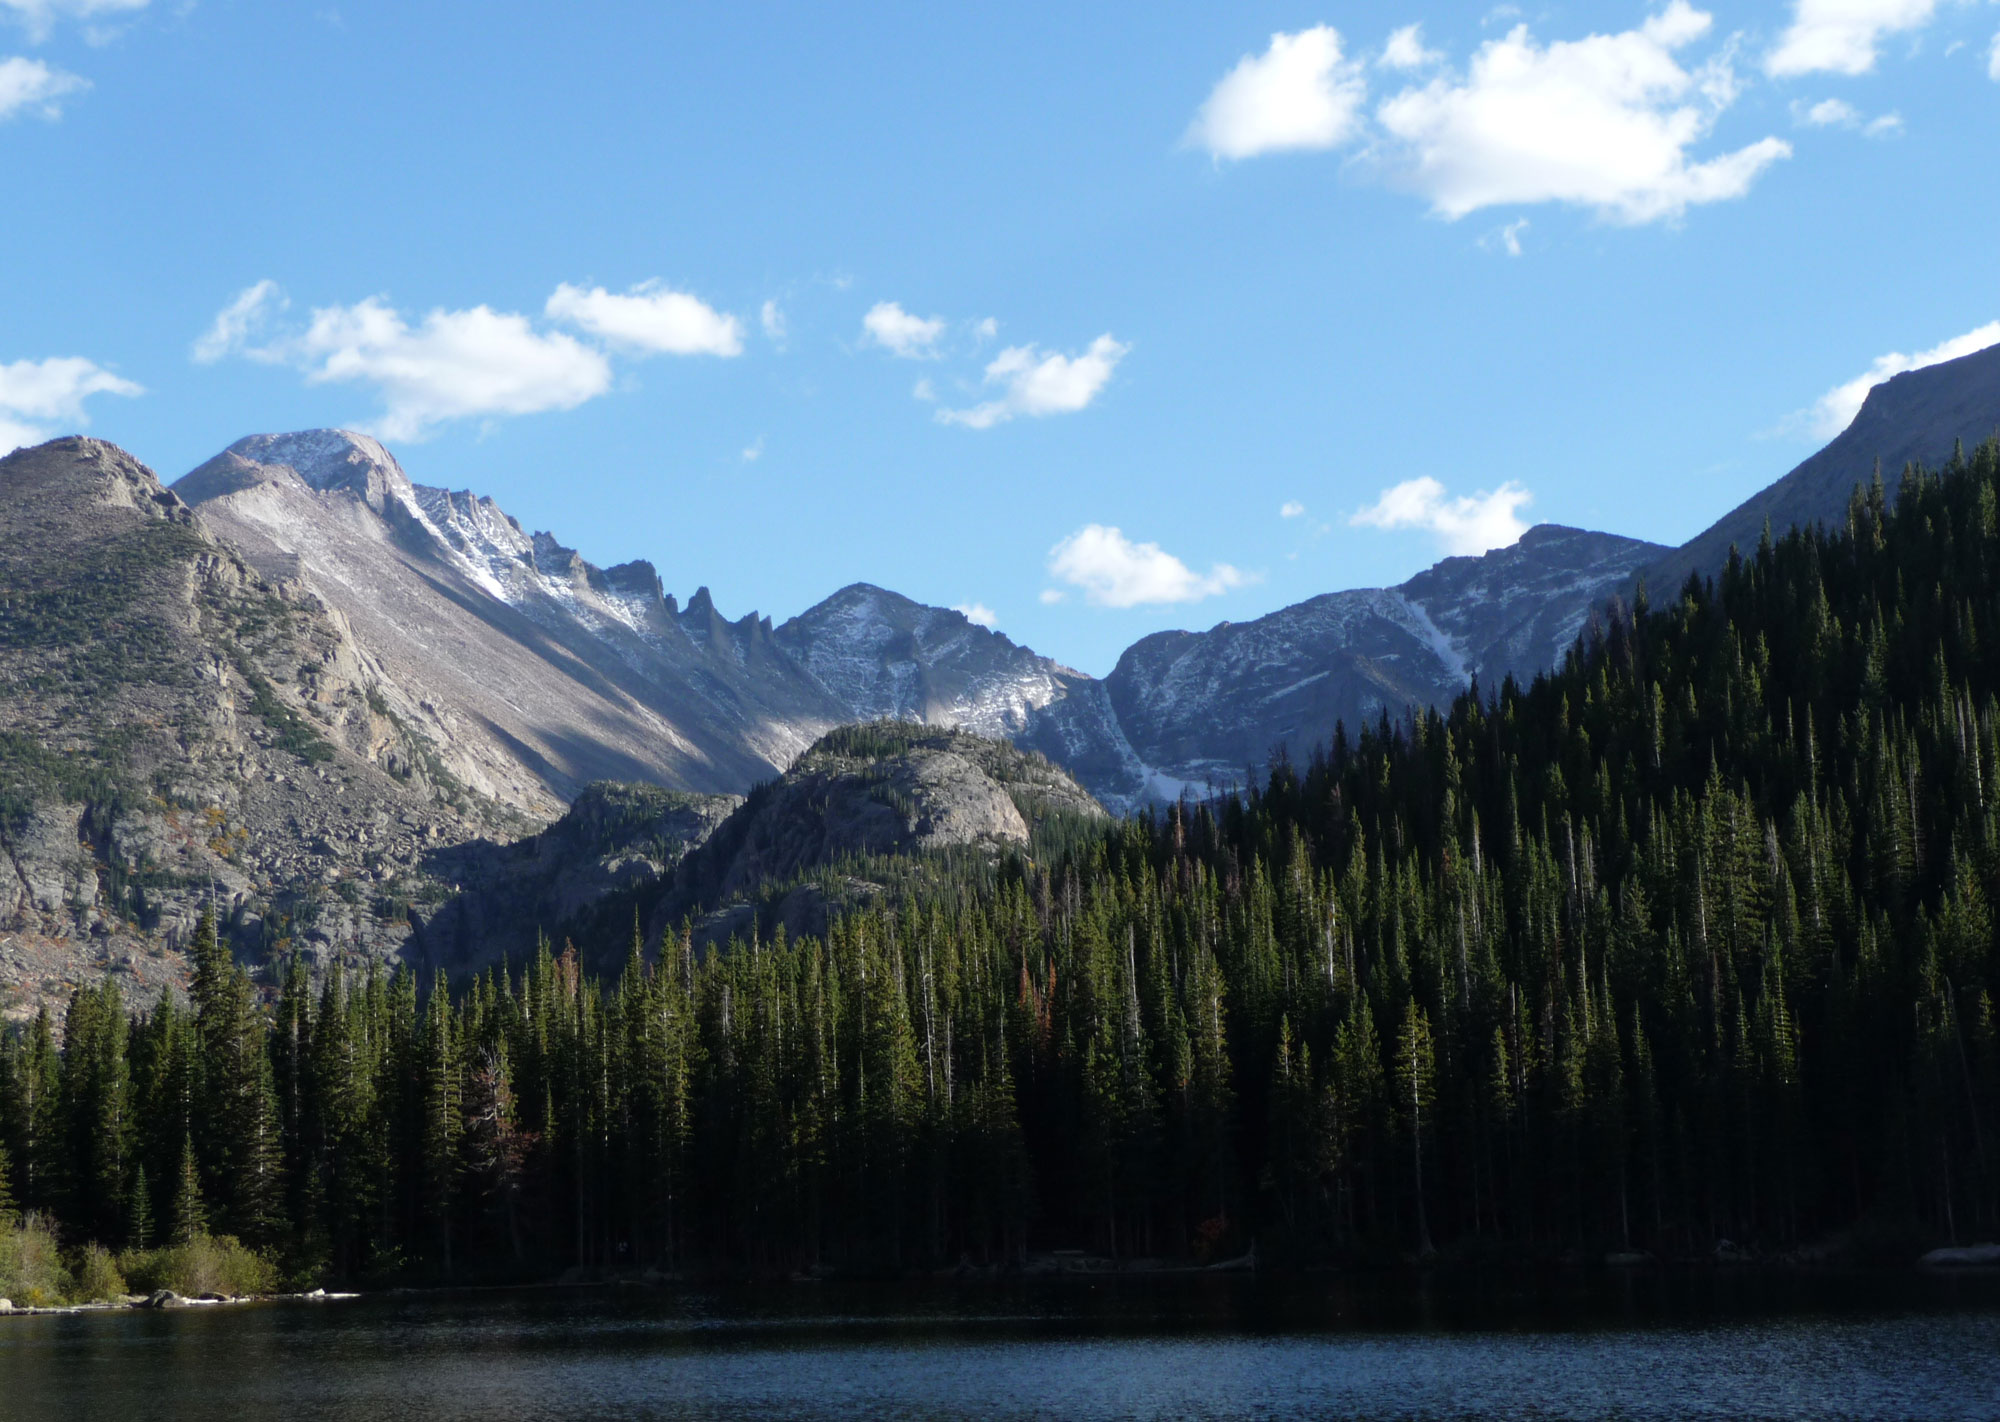
Bear Lake and Glacier Gorge, Rocky Mountain National Park, Colorado, 2011. The elevation of Bear Lake is about 2880 meters (9450 feet). Photo by Daniel Mayer (Wikimedia Commons, Creative Commons Attribution-ShareAlike 3.0 Unported license, image resized).
New Mexico
In New Mexico, climate is characterized by arid, semiarid, or continental conditions, with light precipitation, low humidity, and abundant sunshine. As in Arizona, the desert experiences a large range of temperature on a daily basis. The state's mountainous areas, however, have climate characteristics that more closely follow those found in the Colorado Rockies. Summer rains fall almost entirely during brief but intense thunderstorms on the Great Plains, although the occasional hurricane in the Gulf of Mexico may push heavier precipitation inland. Winter is the driest season in New Mexico, because precipitation from eastward-traveling Pacific storms is left behind in the western mountains of Arizona and Utah.
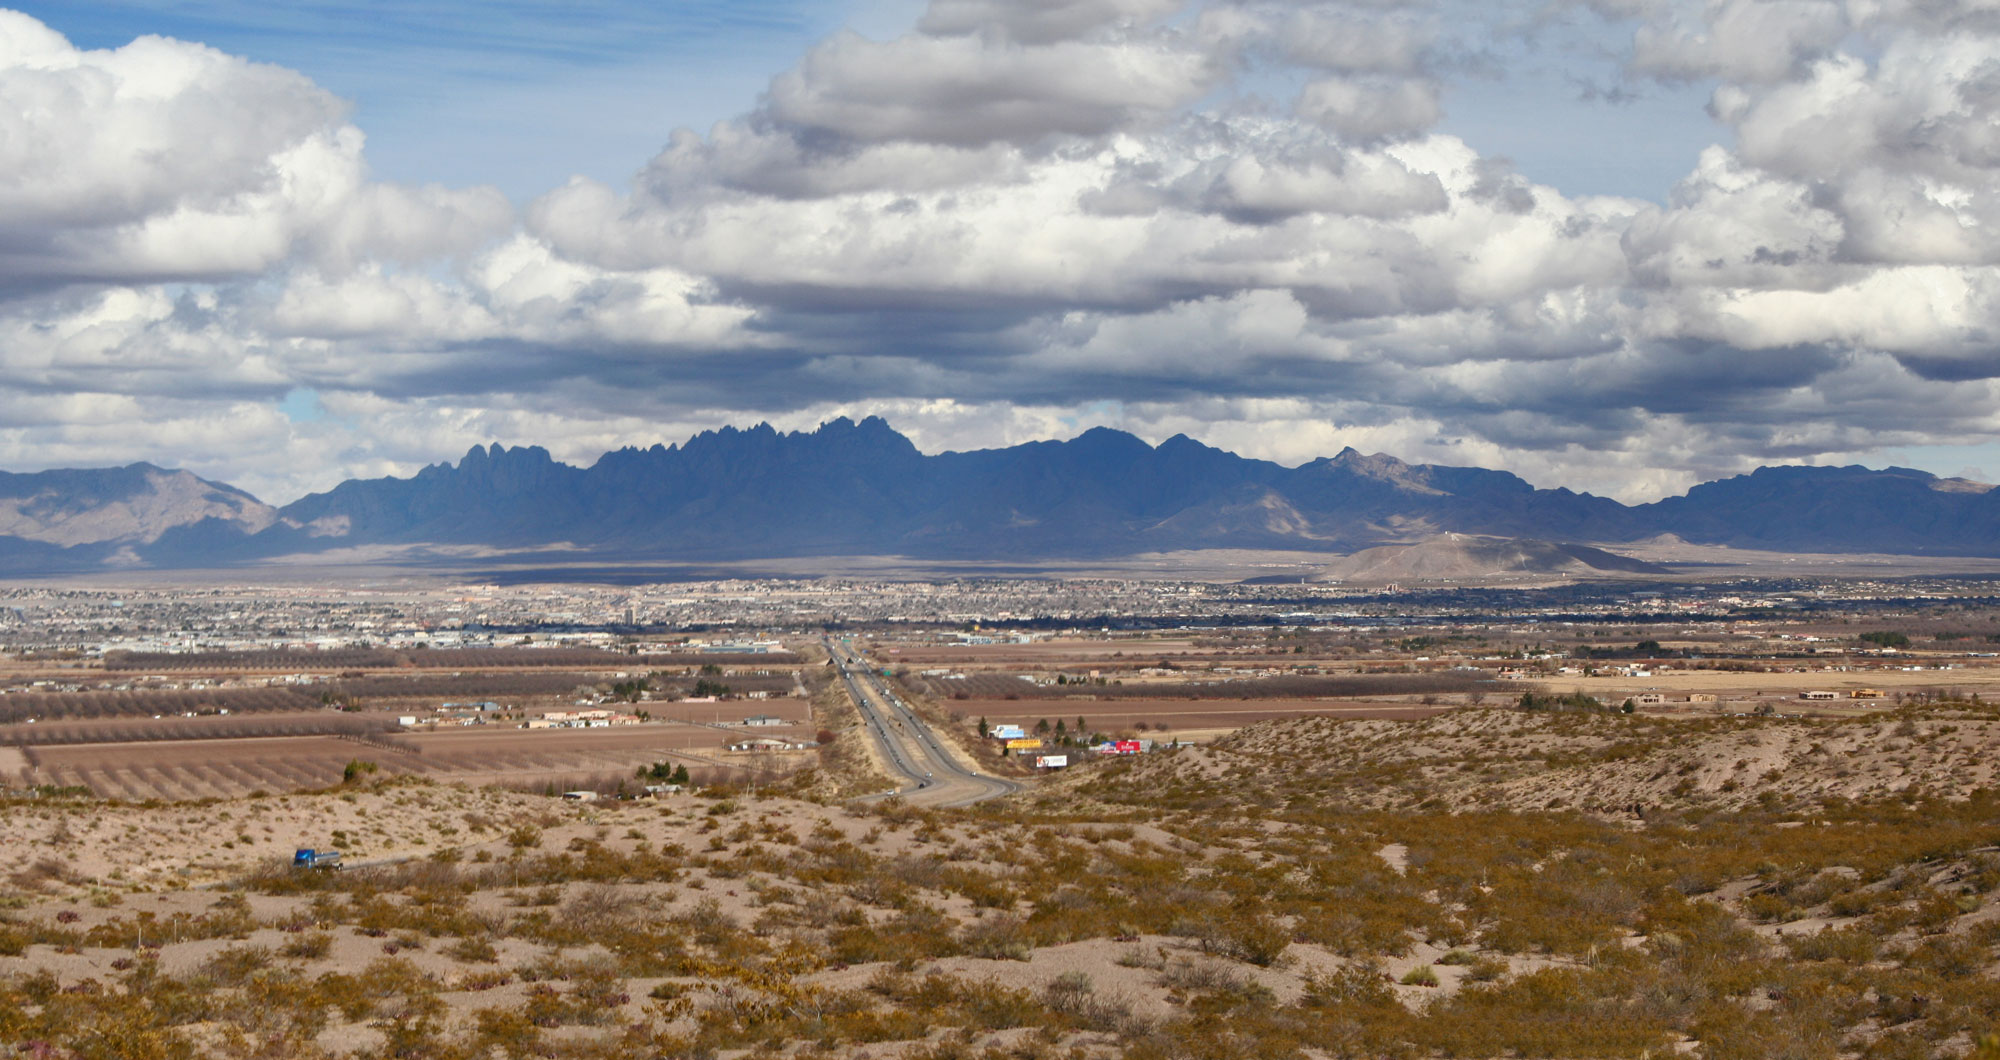
Las Cruces, New Mexico, 2006. Las Cruces is located in the Basin and Range region of New Mexico. Photo by Richard Stephen Haynes (Wikimedia Commons, Creative Commons Attribution-ShareAlike 4.0 International license, image resized).
Utah
Utah’s distance from both the Pacific Ocean and the Gulf of Mexico prevents heavy precipitation, and much of the state is typically sunny year-round, with light to moderate winds. Changes in atmospheric pressure during the late fall and winter can lead to an accumulation of haze. Light precipitation travels eastward over the Sierra Nevada and Cascade mountains after dropping heavy snowfall in areas of high elevation. Because high mountains to the west and north act as a barrier to cold Arctic air masses, most areas of Utah rarely experience temperatures below freezing or prolonged periods of extreme cold.
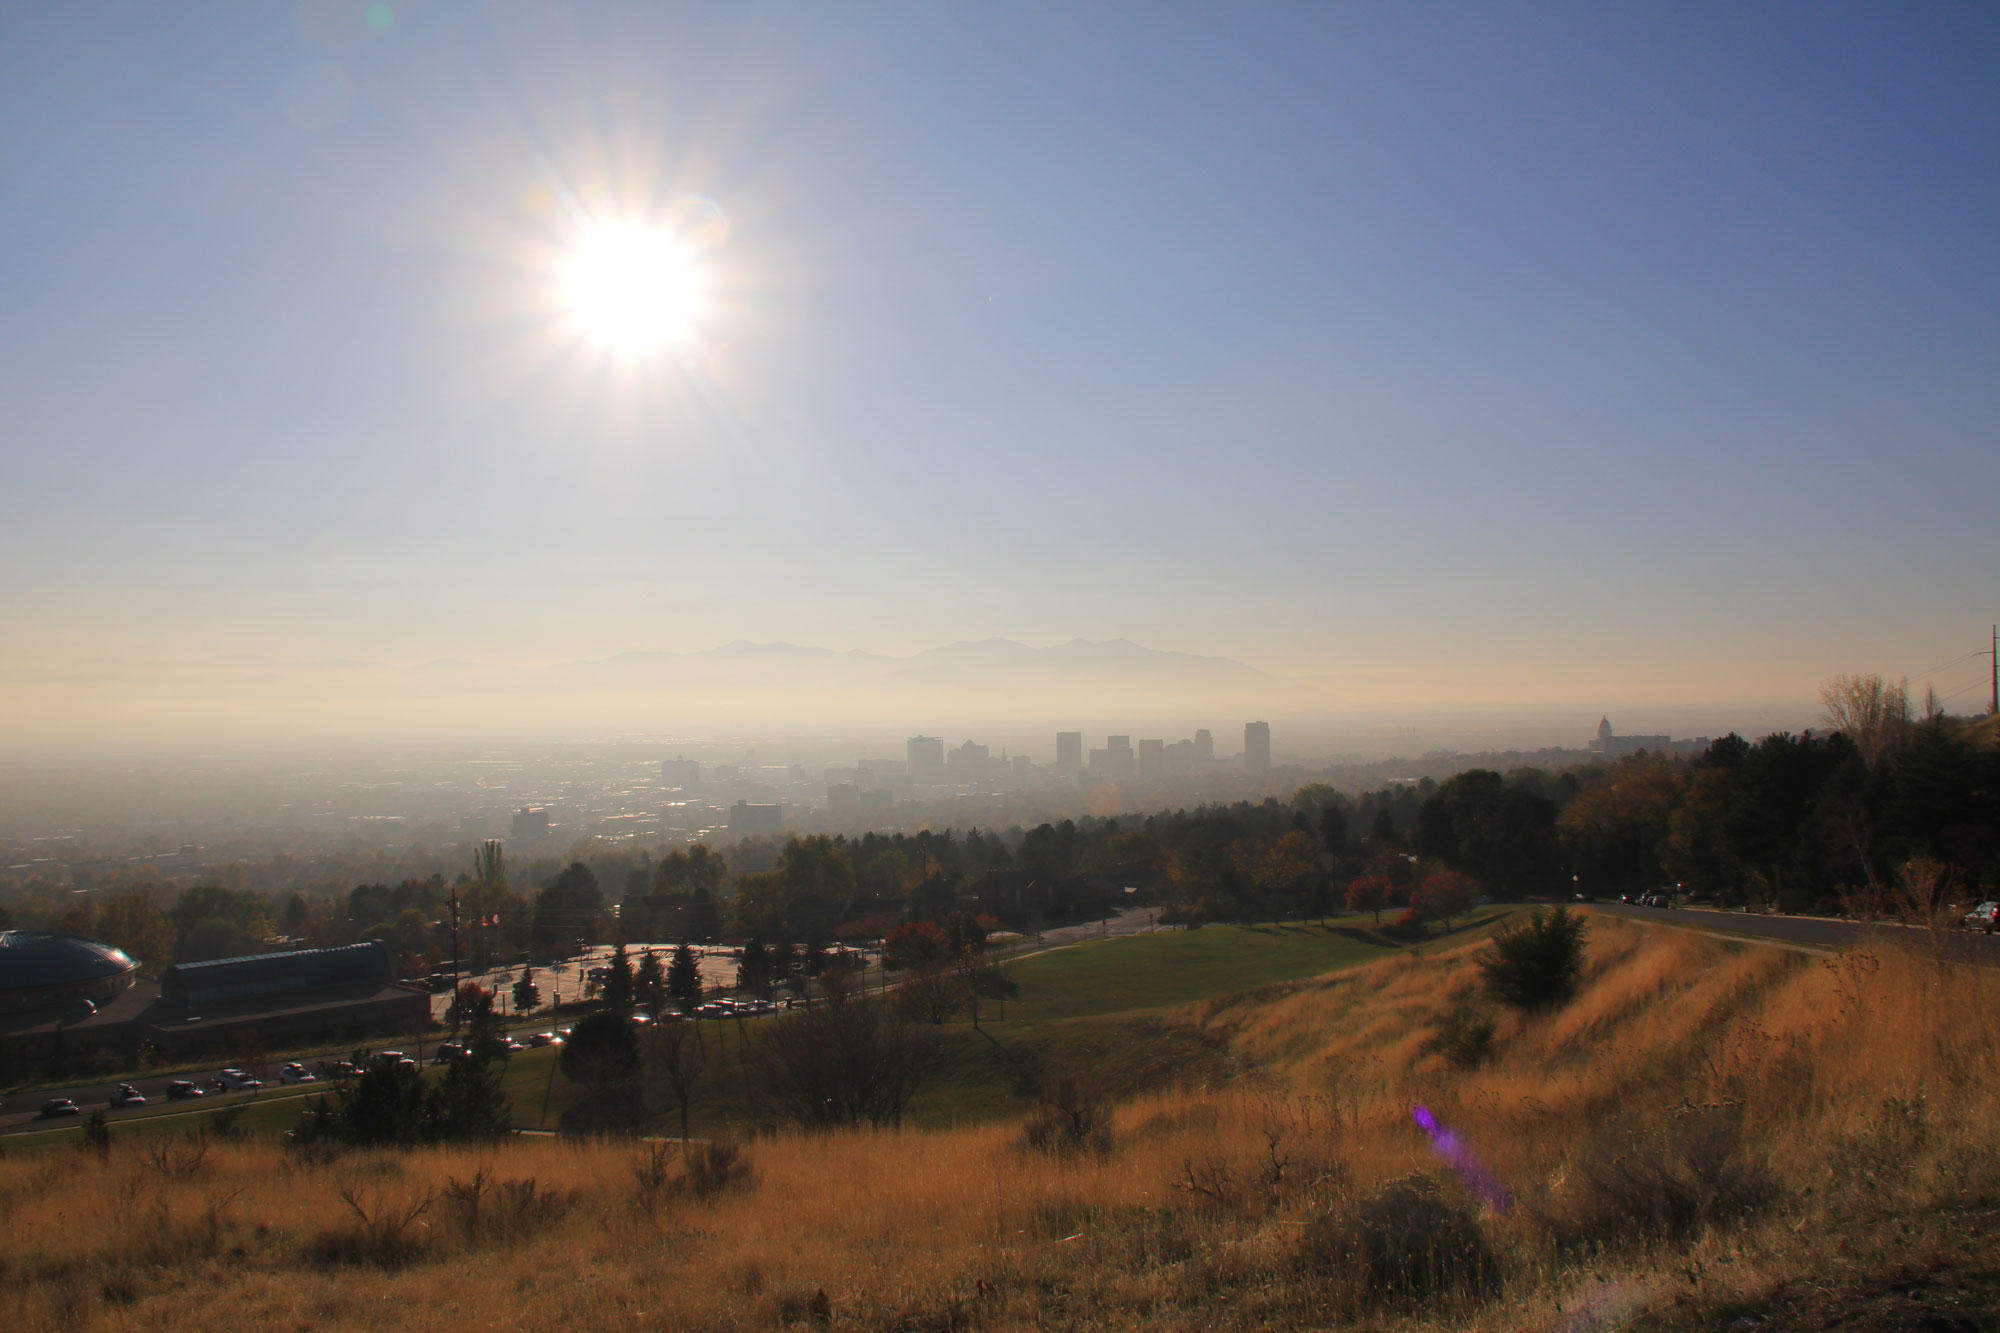
Smog (haze caused by air pollution) over Salt Lake City, Utah, 2016. Photo by Eltiempo10 (Wikimedia Commons, Creative Commons Attribution-ShareAlike 4.0 International license, image resized).
Past climate of the southwestern U.S.
This section covers the climate of the southwestern U.S. through the Phanerozoic, from about 541 million years ago to the recent. For the climate on early Earth prior to 541 million years ago, see the Introduction to Climate section.
Paleozoic (541 to 252 million years ago)
Cambrian to Ordovician (541 to 444 million years ago)
With the start of the Paleozoic era, climates across the world were warm, and North America was located in the low and warmer latitudes of the Southern Hemisphere. As the Cambrian progressed, North America moved northward, and what would become much of the southwestern U.S. was located near the Tropic of Capricorn. Shallow seas invaded the continent, ultimately covering the whole area until the late Carboniferous. During this time, the only exposed areas were islands in western Colorado and parts of New Mexico. There is a rich marine fossil record from the areas between these islands.
In the late Ordovician (about 460 to 430 million years ago), the Earth fell into another brief but intense ice age. Glaciers covered most of the world's southern landmasses, which were located over the South Pole. This led to global cooling and dropping global sea levels. North America's position near the equator kept its climate relatively warm. Ordovician deposits across the Southwest indicate warm, shallow seas rich in invertebrate life. Shelly sandstones in Utah represent vast tidal flats.
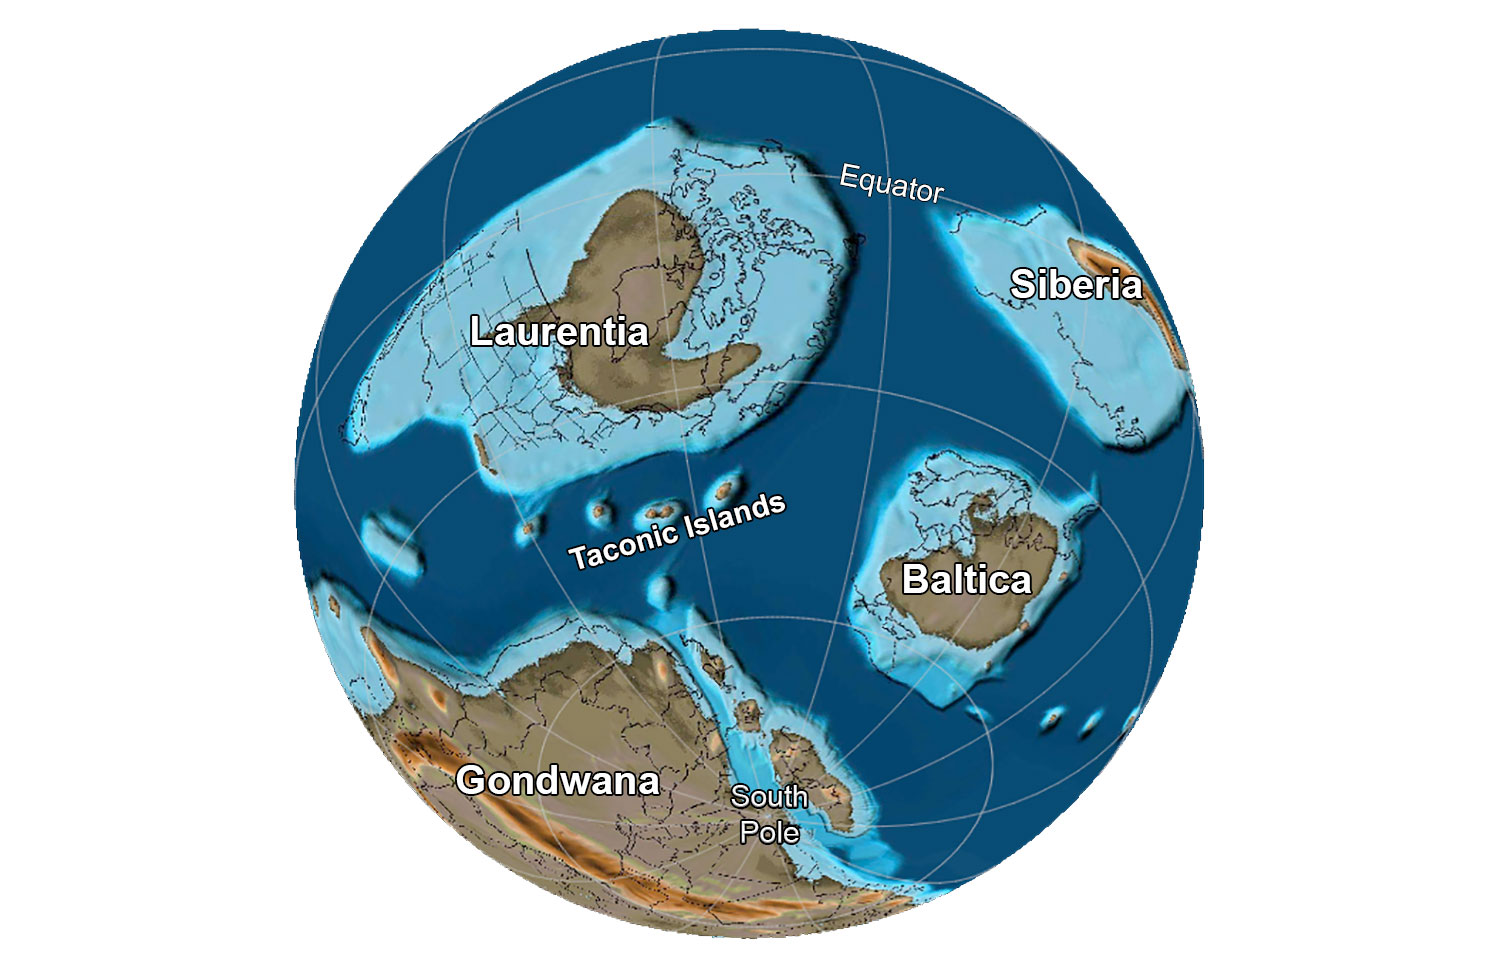
The globe about 485 million years ago, near the Cambrian-Ordovician boundary. Note that the southwestern region of the U.S. is covered by a shallow sea. Reconstruction created using basemap from the PALEOMAP PaleoAtlas for GPlates and the PaleoData Plotter Program, PALEOMAP Project by C. R. Scotese (2016); map annotations by Jonathan R. Hendricks for PRI's Earth@Home project (CC BY-NC-SA 4.0 license).
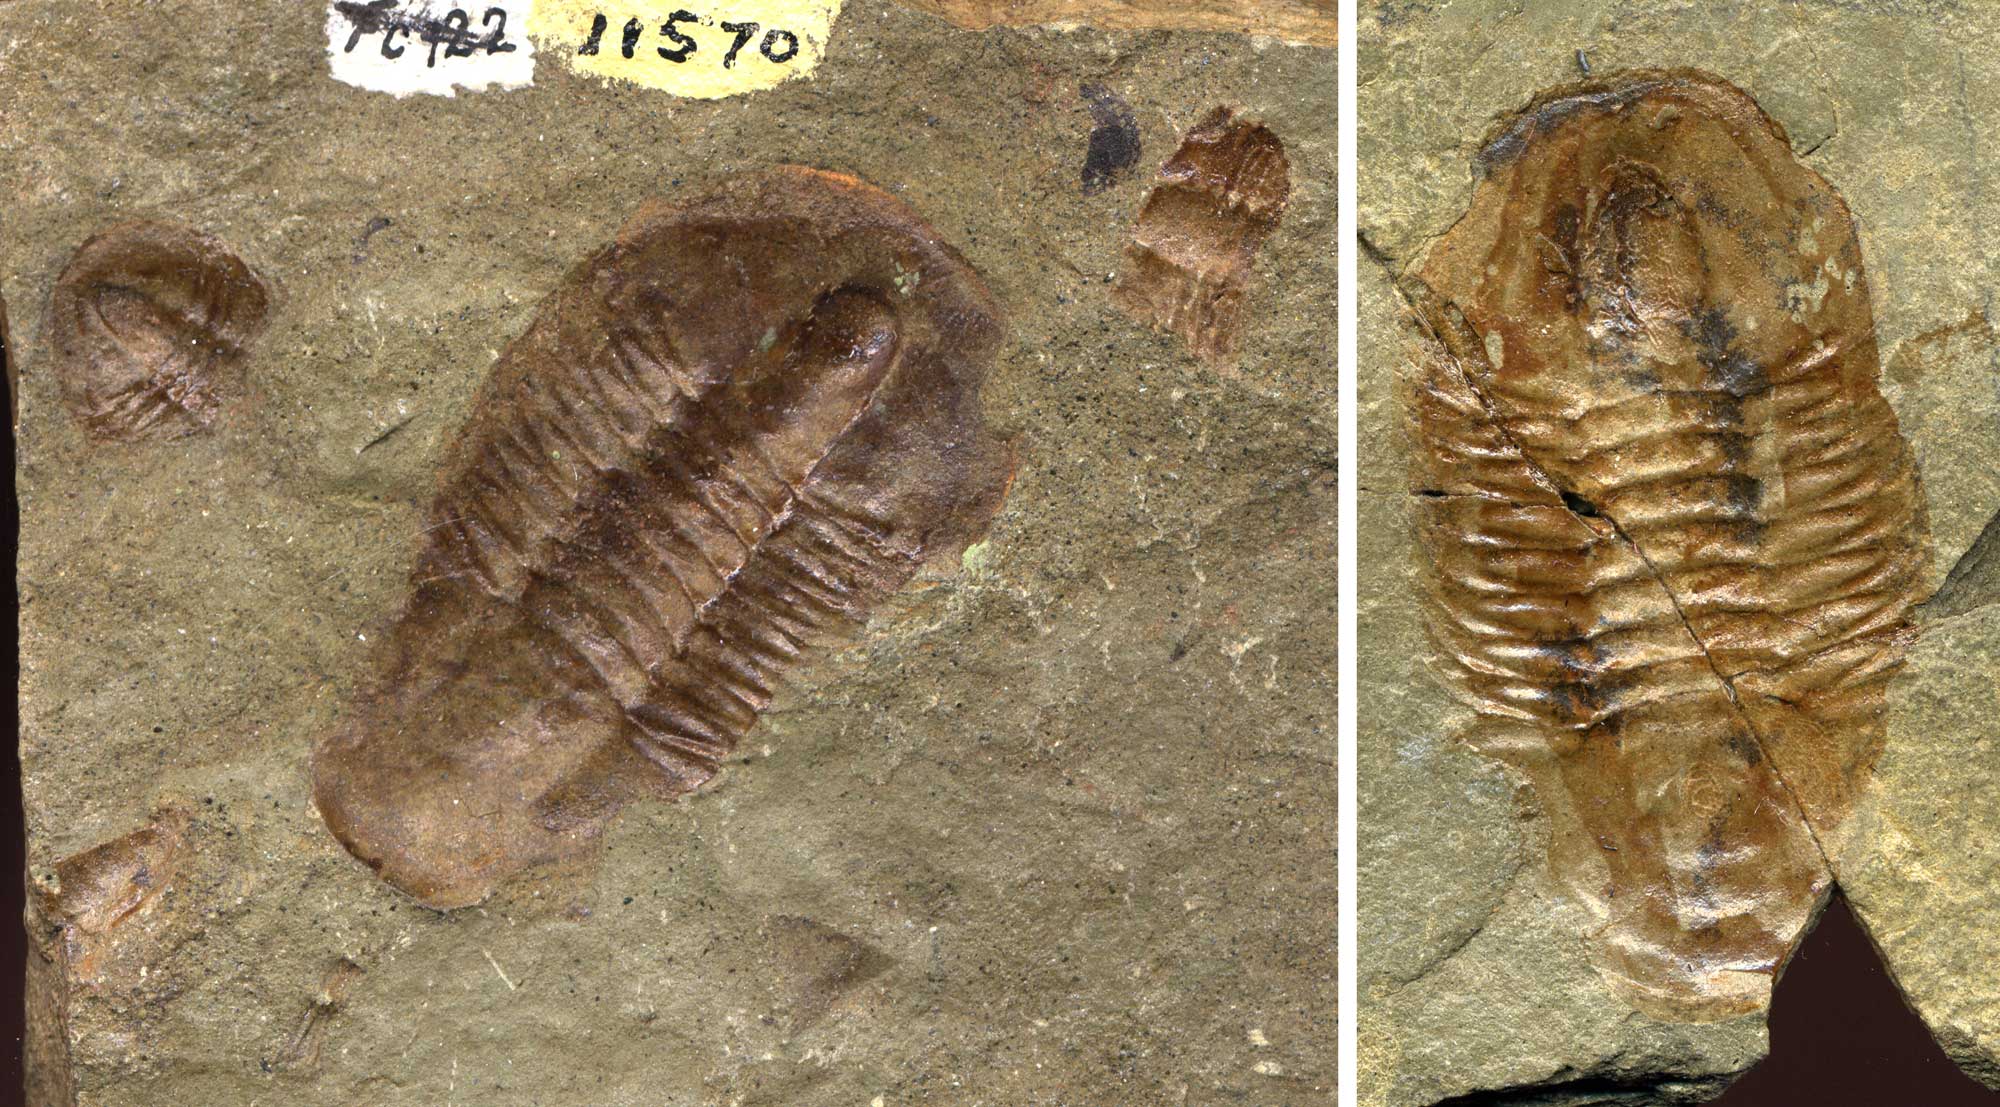
Cambrian trilobites from the Bright Angel Shale (Tonto Group), Grand Canyon National Park, Arizona. Left: Trilobites identified as Dolichometoppus productus and Alokistocare althea. Right: Dolichometoppus productus. Left photo and right photo by NPS/Michael Quinn (Grand Canyon National Park via flickr, Creative Commons Attribution 2.0 Generic license, images cropped and resized).
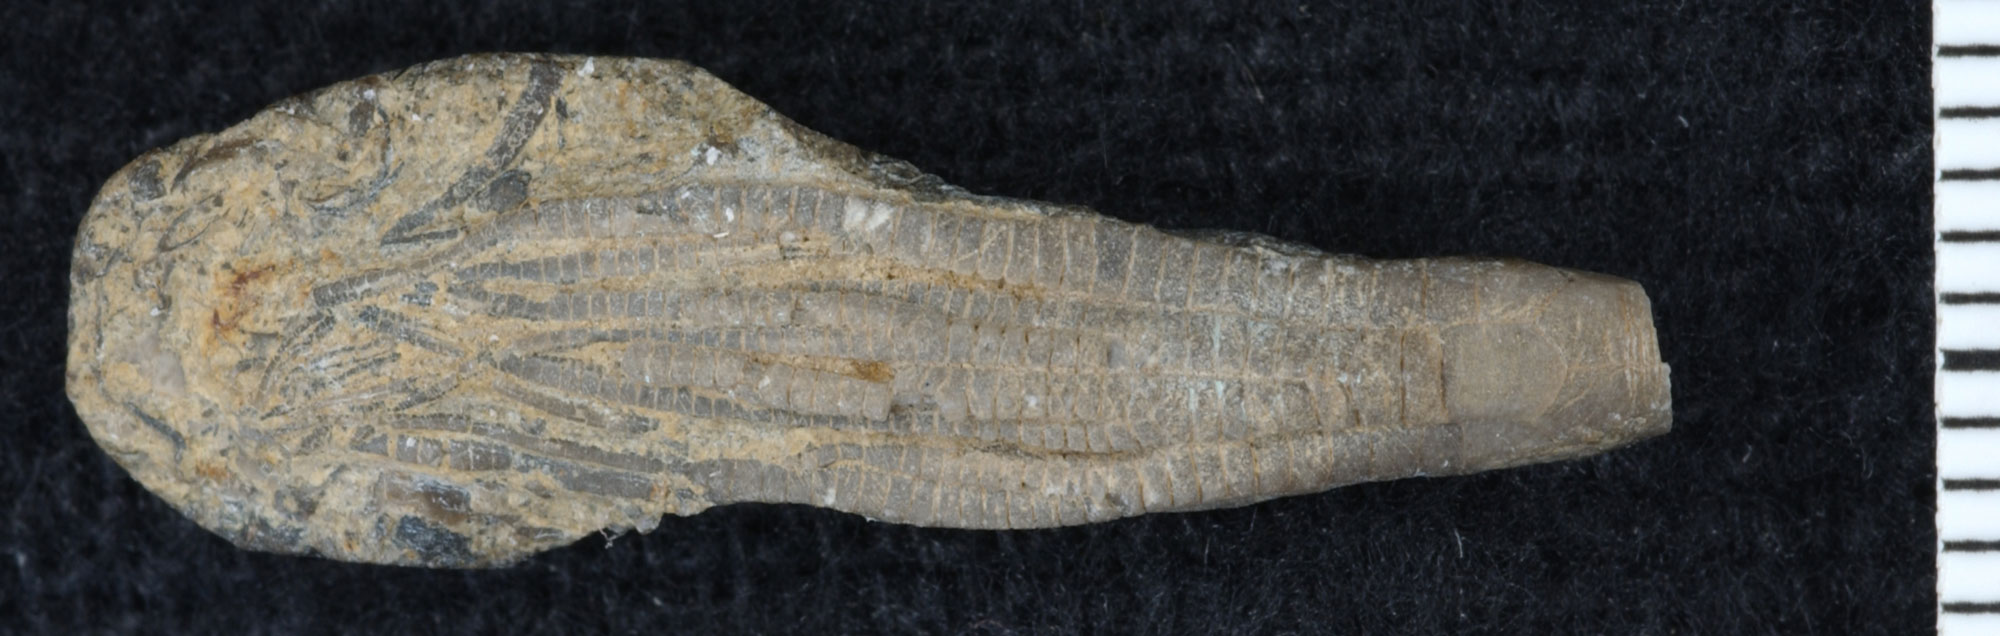
A crinoid (Ibexocrinus lepton) from the Ordovician Kanosh Shale, Millard County, Utah. Photo of USNM PAL 165239 by Crinoid Type Project (Smithsonian National Museum of Natural History, public domain).
Silurian to Devonian (444 to 359 million years ago)
In the Silurian and Devonian (430 to 359 million years ago), North America moved north across the equator, and the cycle of warming and cooling was repeated yet again. Glaciation in the Southern Hemisphere occurred during the late Devonian, while the supercontinent Gondwana was located over the South Pole, and intensified during the early Carboniferous. At this time, the Southwest was still submerged. The oceans between Gondwana and North America began to close.
Carboniferous (359 to 299 million years ago)
In the early Carboniferous (Mississippian), ice capped the South Pole and began to expand northward. Much of the Southwest became an archipelago of warm shallow seaways and uplifted islands, with terrestrial swampy forests and shallow sea floors populated by bivalves, brachiopods, arthropods, corals, and fish.
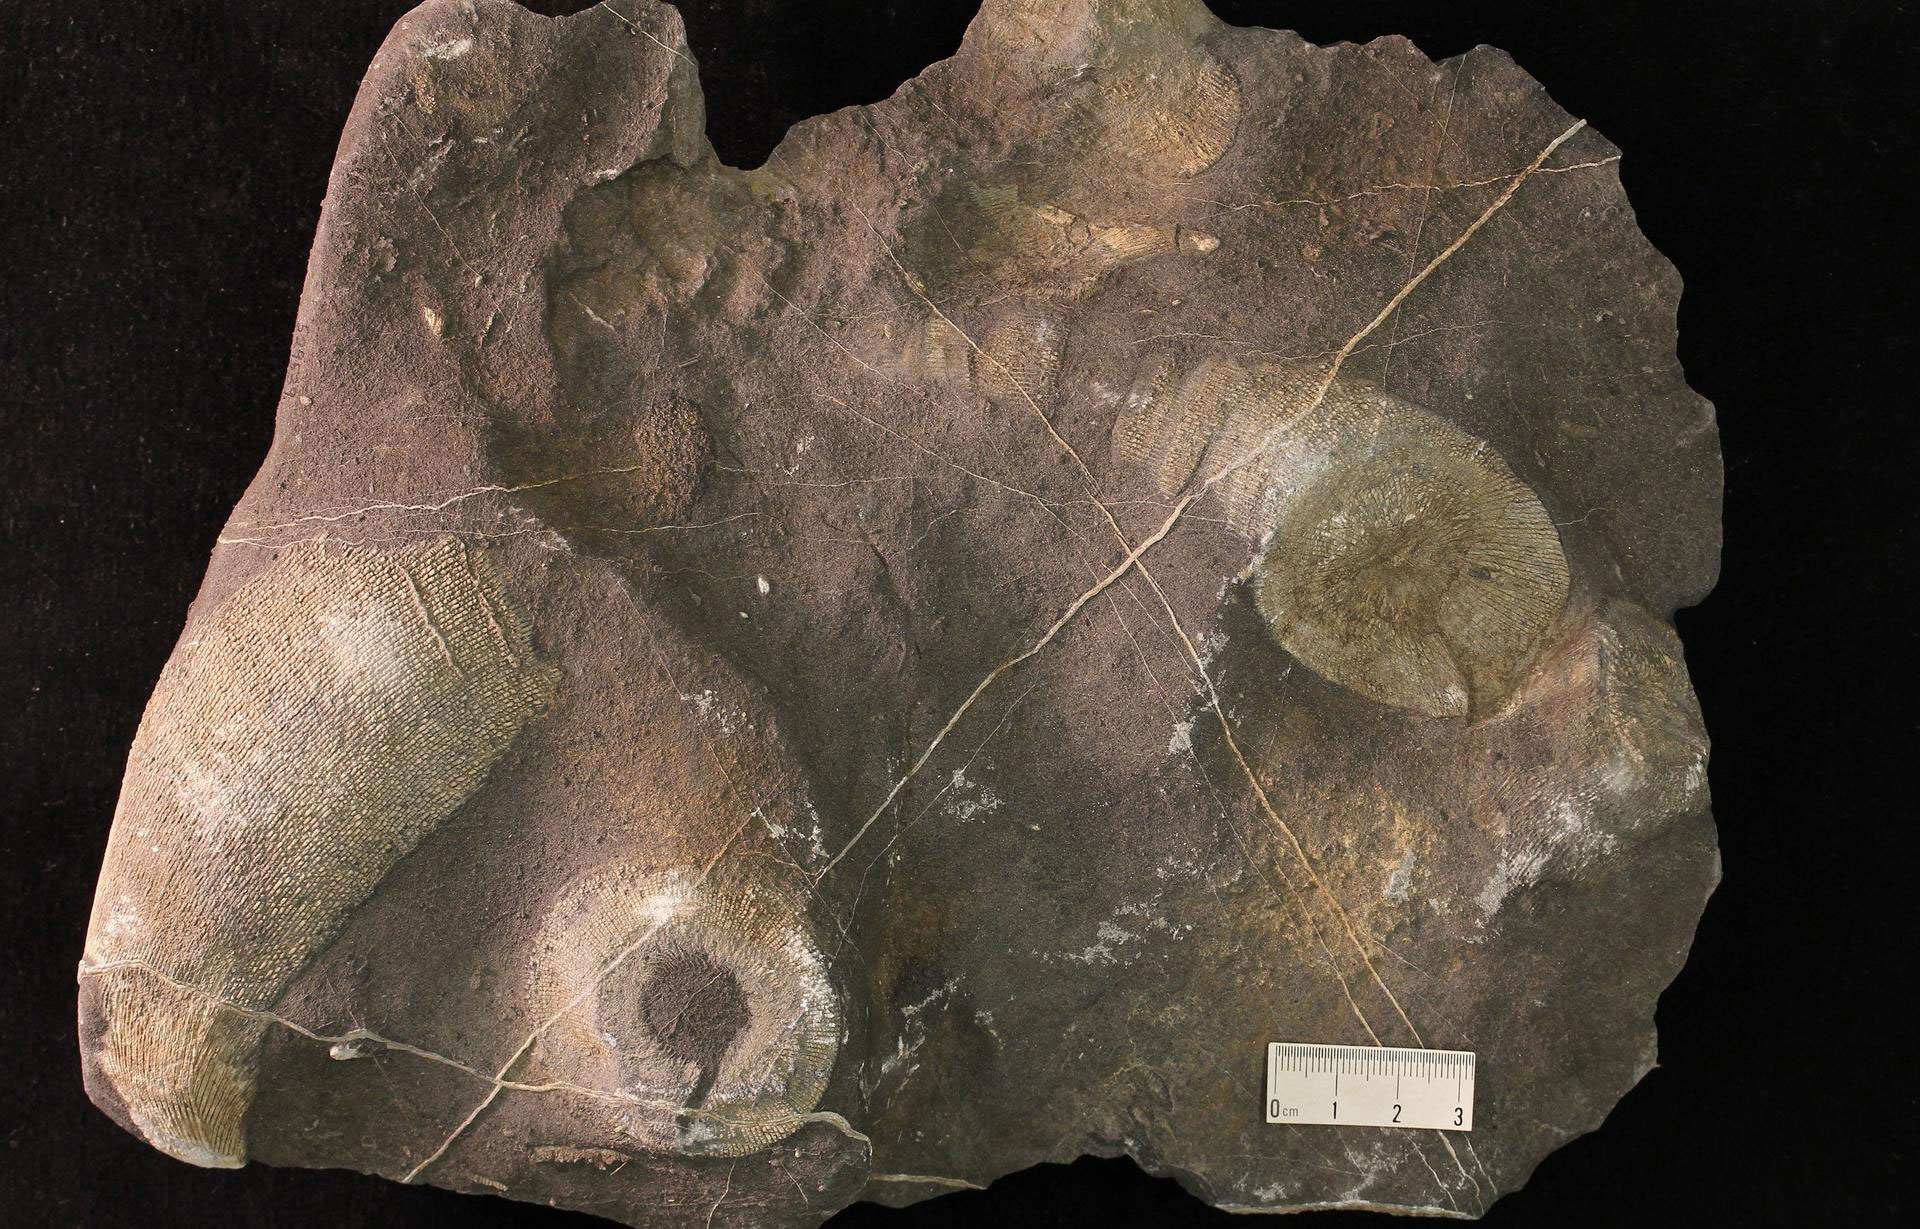
Rugose corals or horn corals (Turbophyllum) from the Mississippian Great Blue Limestone, Cache Canyon, northern Utah, near the border between the Basin and Range and Rocky Mountain physiographic provinces. Photos of YPM IP 529539 by Jessica Utrup, 2015 (Yale Peabody Museum of Natural History/YPM, CC0 1.0 Universal/Public Domain Dedication, via GBIF.org).
By the late Carboniferous, North America had collided with Gondwana, leading to the formation of Pangaea—a supercontinent composed of nearly all the landmass on Earth. Although the mountain building that occurred during this event was mostly far to the east, the Southwest was influenced by both fluctuating sea levels and a few significant tectonic changes.
The climate remained warm, despite large southern ice sheets, but it had grown much drier. Thick salt deposits accumulated in the northwestern Four Corners area as the seas evaporated. Where the land was exposed, deposits of dust (loess) accumulated and were blown across much of the Southwest. In southern New Mexico and Arizona, shallow marine deposits, laid down when the ice in Gondwana retreated and sea level rose, alternate with layers of dust blown in when the ice in Gondwana advanced and sea level fell. Loess is often, though not exclusively, associated with dry areas around glaciers. One controversial hypothesis proposes that an area of western Colorado—one of the islands that dotted the early Carboniferous sea—was, in fact, glaciated.
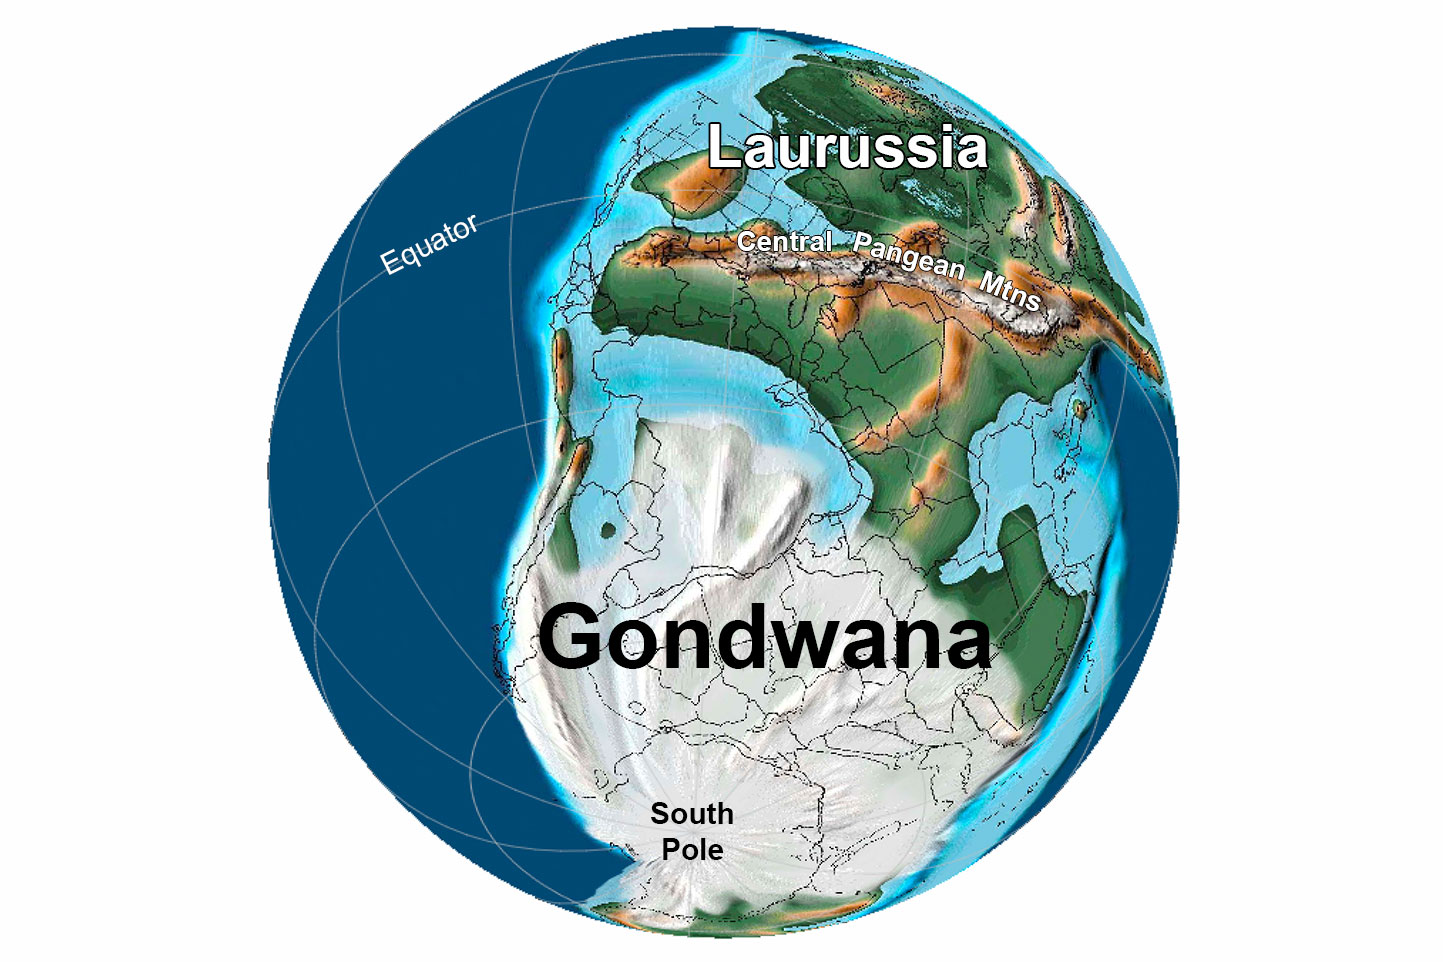
Earth 300 million years ago, during the end of the Carboniferous Period (Pennsylvanian). Pangaea was completed when North America finally collided with Gondwana. Reconstruction created using basemap from the PALEOMAP PaleoAtlas for GPlates and the PaleoData Plotter Program, PALEOMAP Project by C. R. Scotese (2016); map annotations by Jonathan R. Hendricks & Elizabeth J. Hermsen for PRI's Earth@Home project (CC BY-NC-SA 4.0 license).
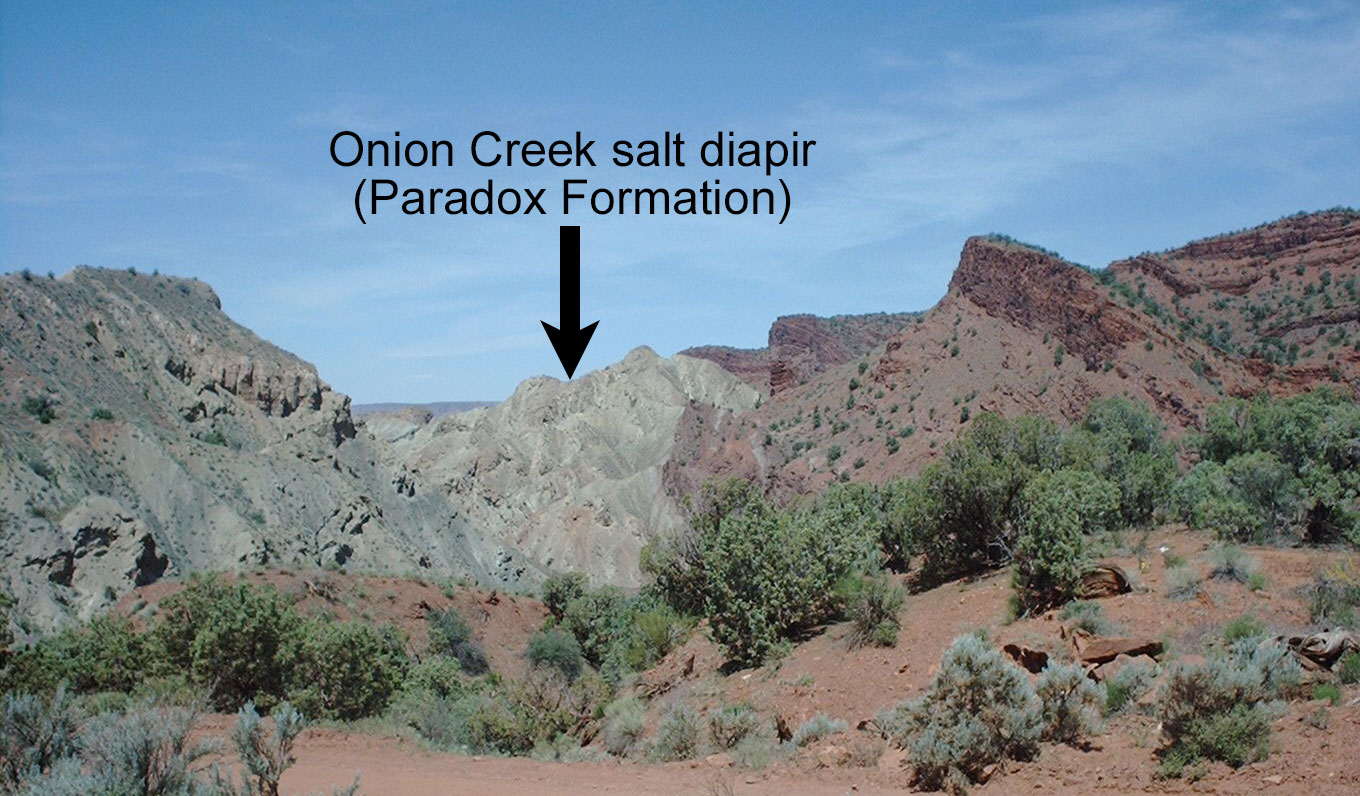
Onion Creek salt diapir, a salt dome exposed at the surface at Fisher Towers, Utah. This salt is part of the Late Carboniferous (Pennsylvanian) Paradox Formation. Photo by Archaeopoda (Wikimedia Commons, Creative Commons Attribution-ShareAlike 3.0 Unported license, image cropped, resized, and labeled).
Permian (299 to 252 million years agoo)
During the Permian, shallow marine waters gave way to lowland coastal areas across portions of the Southwest. Extensive Permian deposits throughout the Southwest are home to a host of fossils, including terrestrial amphibians, reptiles, and synapsids. The climate was drier than that of the Carboniferous, and mudflats with salt and gypsum formed across the Southwestern states. Sand dunes started to become widespread.
A shift in plant type to those better adapted to drier conditions further suggests a change in climate during the Permian. A large, low-latitude desert formed along Pangaea's western margin, generating extensive dune deposits. By the end of the Permian, the southern ice sheets had disappeared.
Layers of gypsum, an evaporate, from the Permian Castile Formation, Eddy County, New Mexico. Photo by James St. John (flickr, Creative Commons Attribution 2.0 Generic license).
Branches and leaves of an ancient conifer (Walchia dawsonii), Permian Hermit Shale, Arizona. Photo of USNM P 38052 by Frederic Cochard (Smithsonian National Museum of Natural History, public domain).
Mesozoic (252 to 66 million years ago)
Triassic to Jurassic (252 to 145 million years ago)
As the Triassic period began, the Southwest moved north from the equator. The world warmed, and would stay warm through the Mesozoic. The continued growth of Pangaea created an intense monsoonal climate, similar to that of Asia today, that affected large parts of the continent.
As Pangaea reached its greatest size during the early Triassic, the monsoon’s intensity increased, and the vast dune deserts of the late Permian were replaced by rivers and floodplains. Soils associated with these floodplains testify to the extreme seasonality of rainfall during that time. The monsoon's intensity waned by the early Jurassic, and the rivers and floodplains were replaced by even larger deserts.
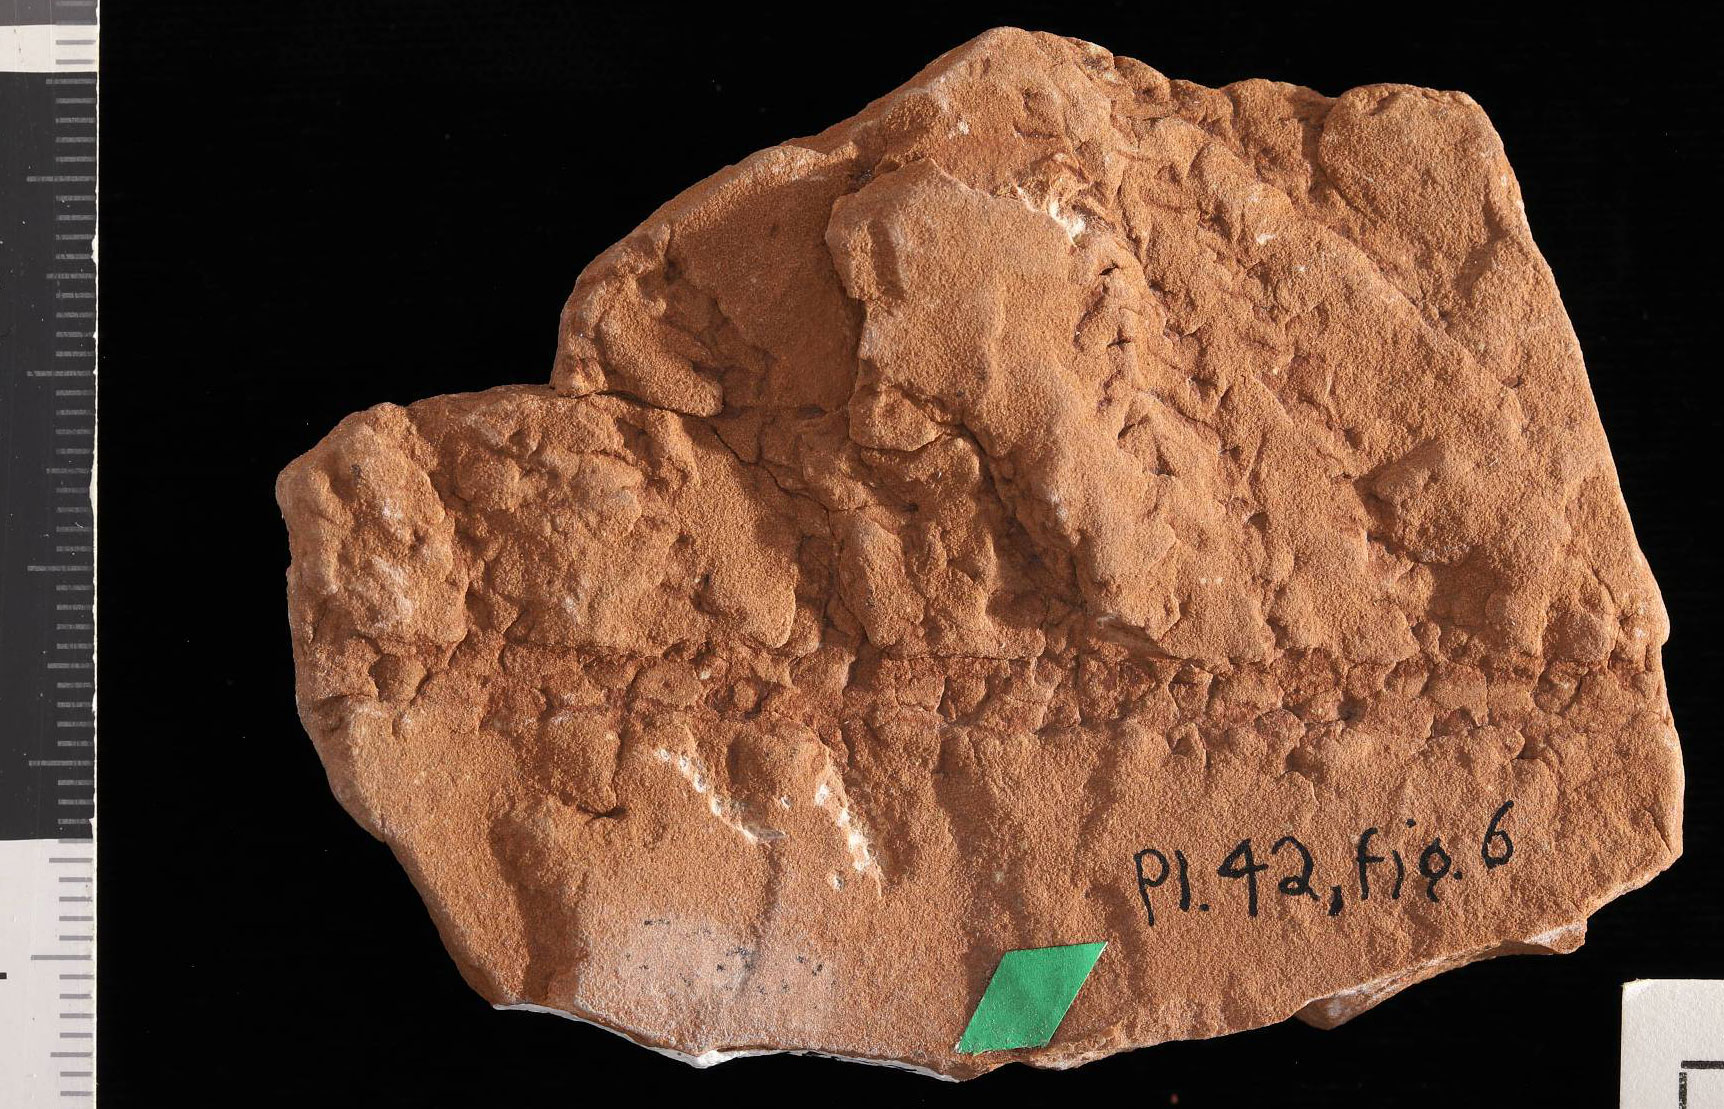
The Southwest's Triassic to Jurassic dune deposits are some of the most extensive in the world, and the dune field that existed during the Jurassic may be the largest in Earth history. These deposits, including the Navajo Sandstone, are responsible for spectacular scenery in the national parks and recreation areas of northernmost Arizona and southern Utah. Despite the area’s arid climate, the dunes were surprisingly full of life, particularly in southeastern Utah. Here, oases with large trees, large colonies of burrowing animals, and reptile trackways punctuated the otherwise dry and sandy landscape. These oases were fed by groundwater that originated in the higher country of what is now western Colorado.
Pangaea began to break up during the Jurassic, rifting apart into continents that would drift toward their modern-day positions. The supercontinent was split by spreading along the mid-Atlantic ridge, initiating the formation of the Atlantic Ocean. Later in the Jurassic, the climate became more moderate; dune fields were replaced by rivers and floodplains populated by a rich dinosaur fauna (exemplified by the Morrison Formation) and large trees along rivers, streams, and grasslands.
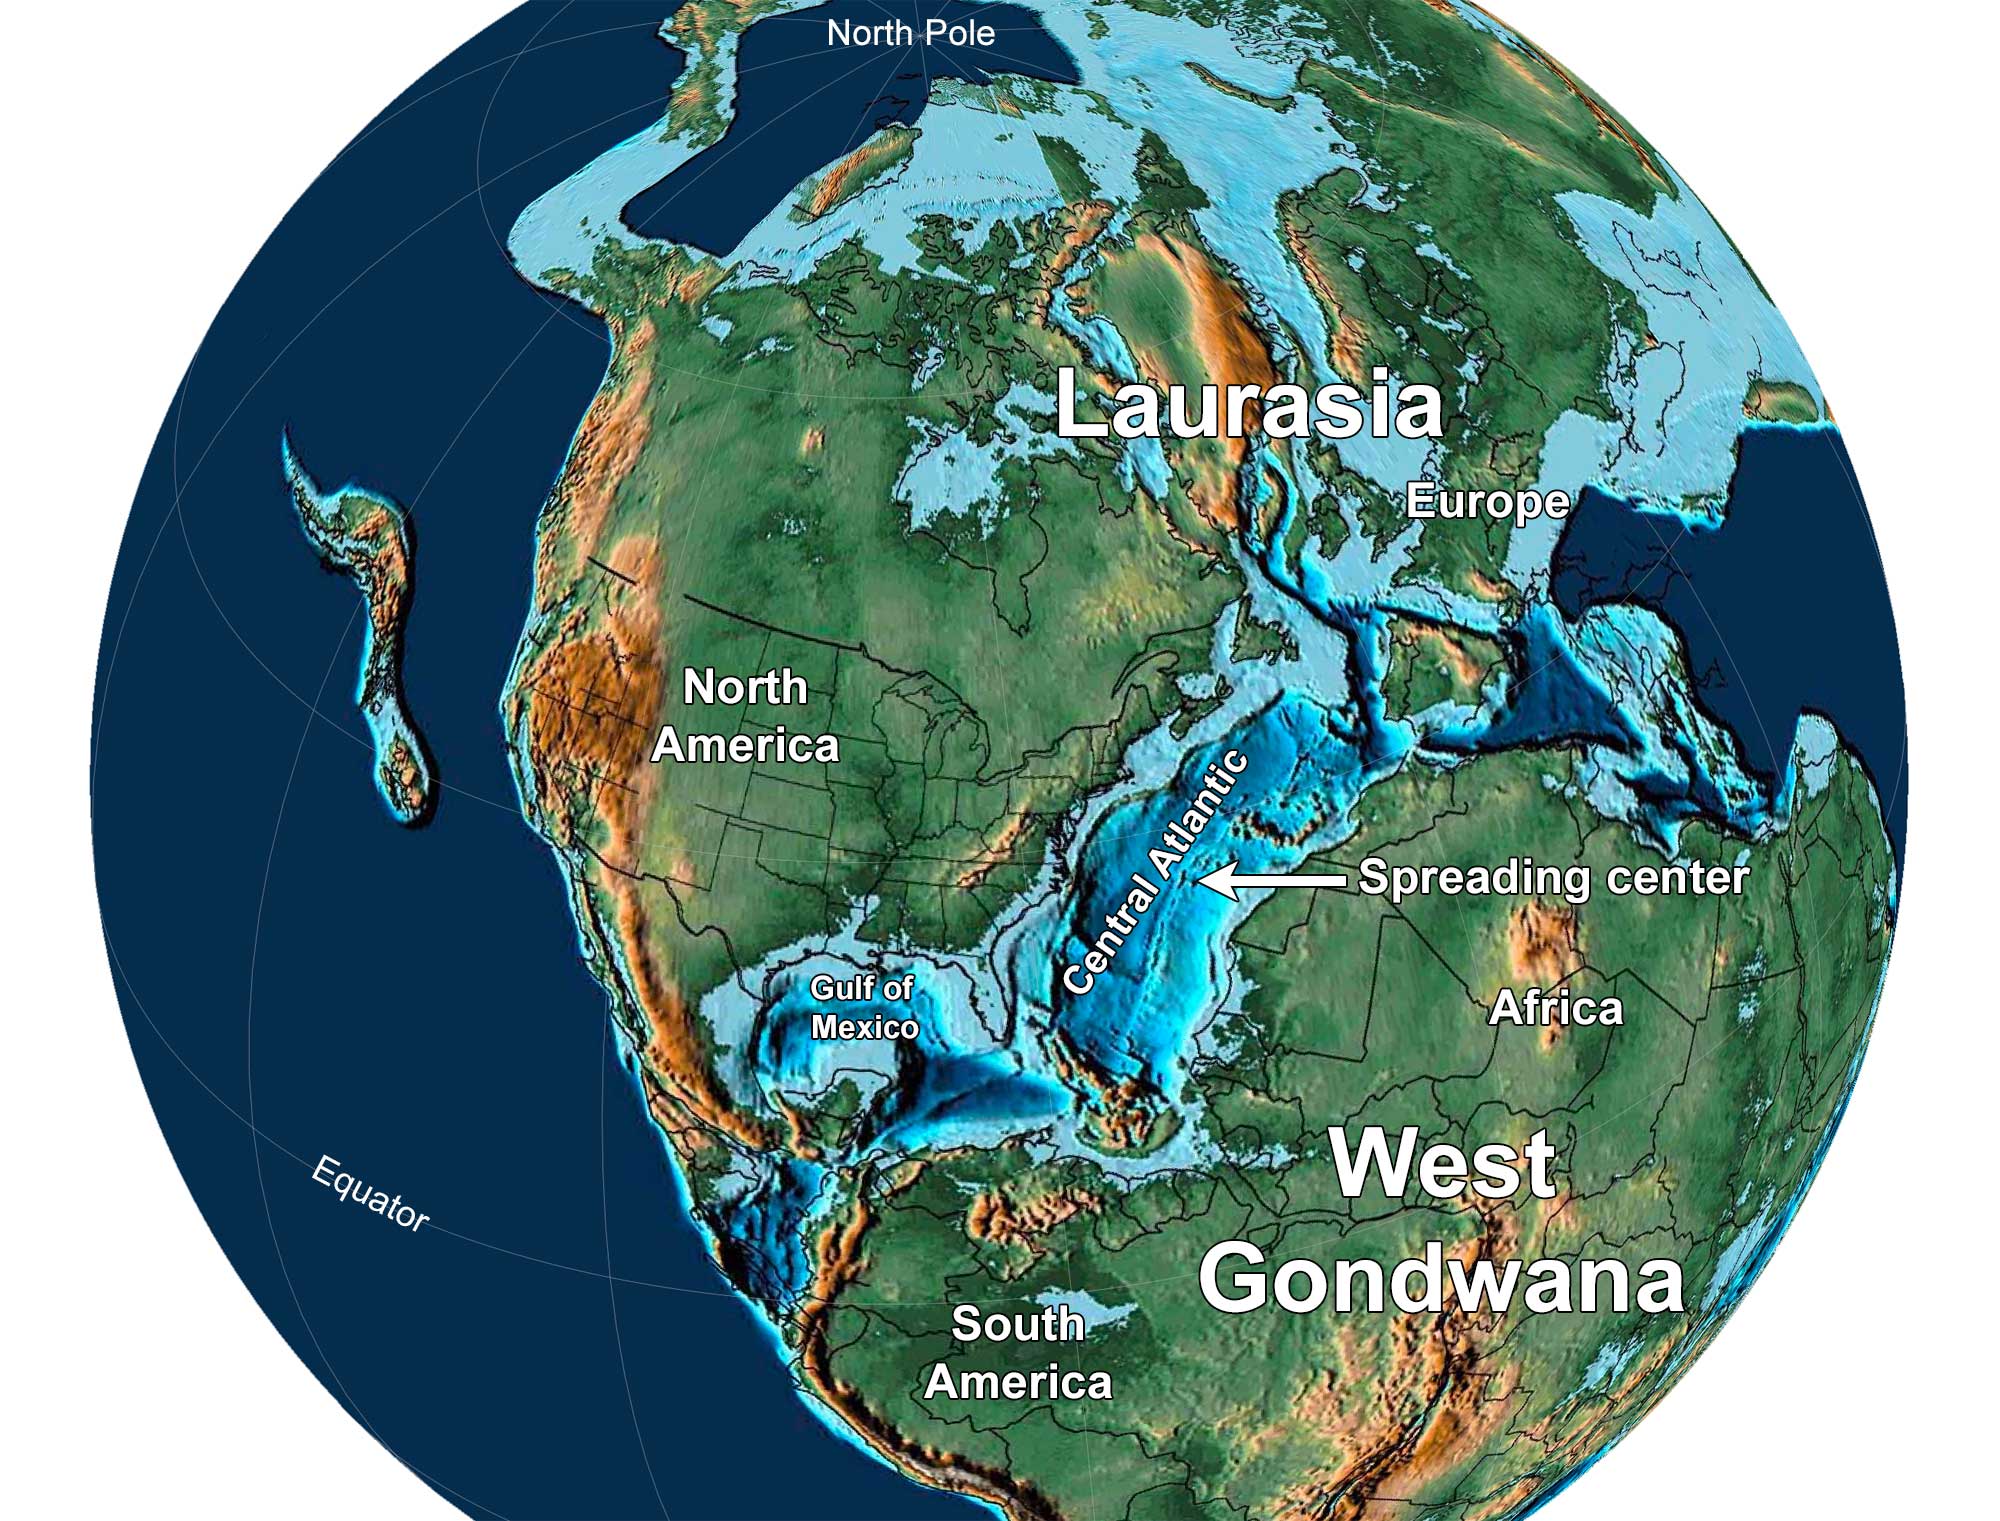
Earth 150 million years ago, near the end of the Jurassic Period. North America and Europe are part of Laurasia, and South America and Africa are part of Gondwana. Notice that North America has separated from Africa and there is a spreading center in the Central Atlantic Ocean. Reconstruction created using Paleomap (by C. Scotese) for GPlates. Reconstruction created using basemap from the PALEOMAP PaleoAtlas for GPlates and the PaleoData Plotter Program, PALEOMAP Project by C. R. Scotese (2016); map annotations by Jonathan R. Hendricks and Elizabeth J. Hermsen for PRI's Earth@Home project (CC BY-NC-SA 4.0 license).
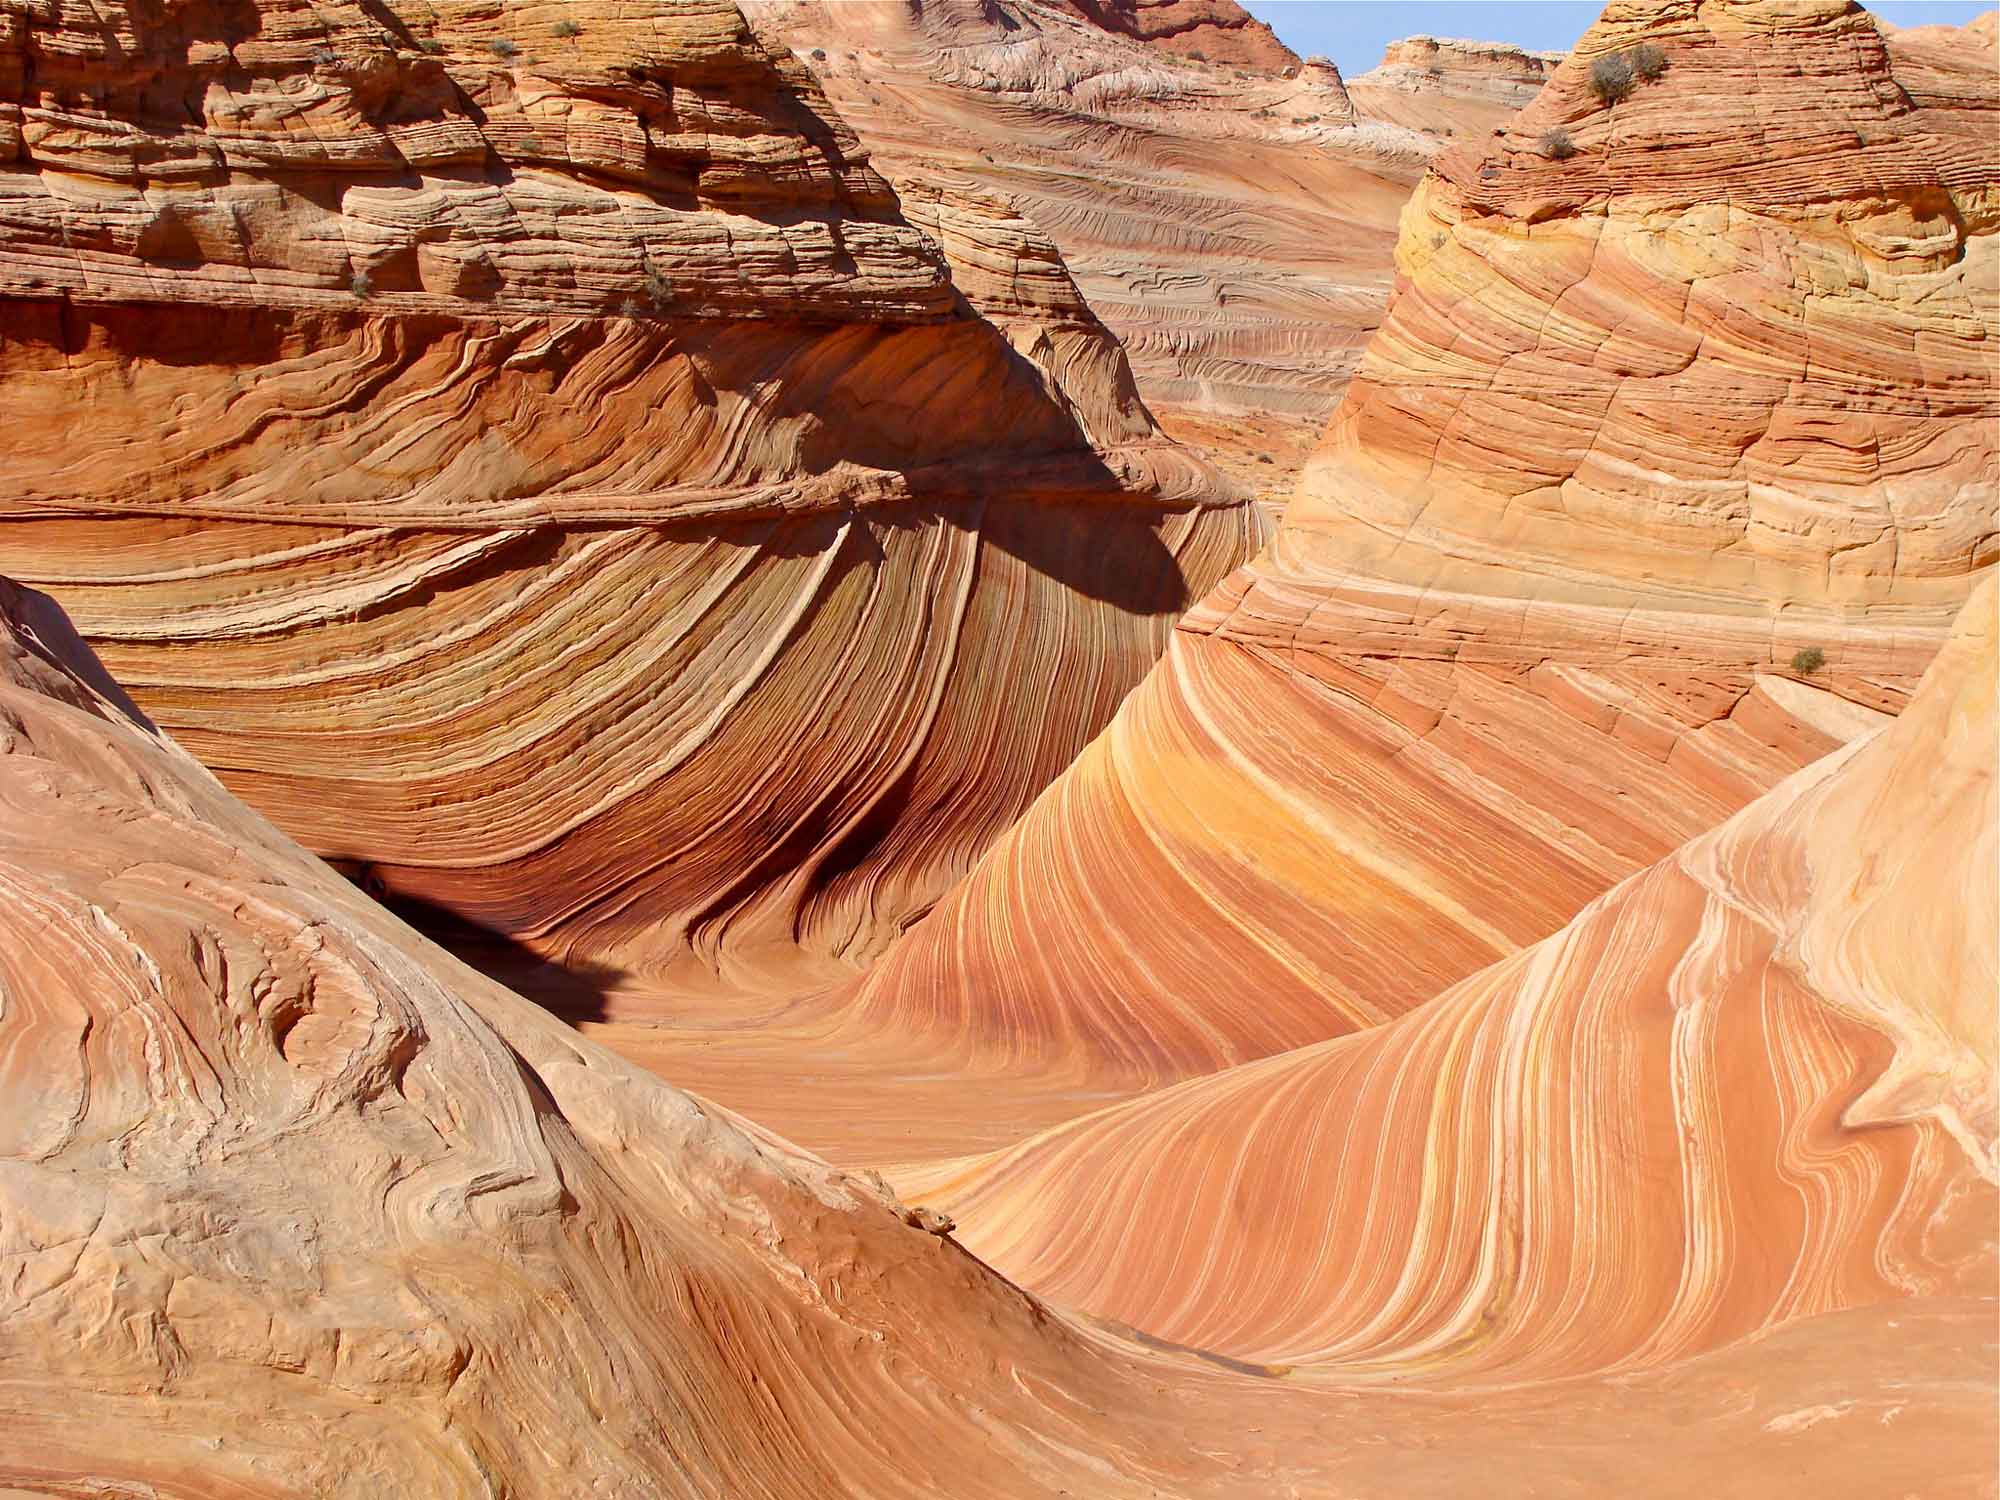
The Wave, a series of intersecting U-shaped troughs eroded into Jurassic Navajo Sandstone within the Paria Canyon-Vermilion Cliffs Wilderness, Arizona. The cycling layers in the sandstone represent changes in the direction of prevailing winds as large sand dunes migrated across the desert. Photograph by Julia Manzerova (Flickr; Creative Commons Attribution-NonCommercial-ShareAlike 2.0 Generic license; image resized).
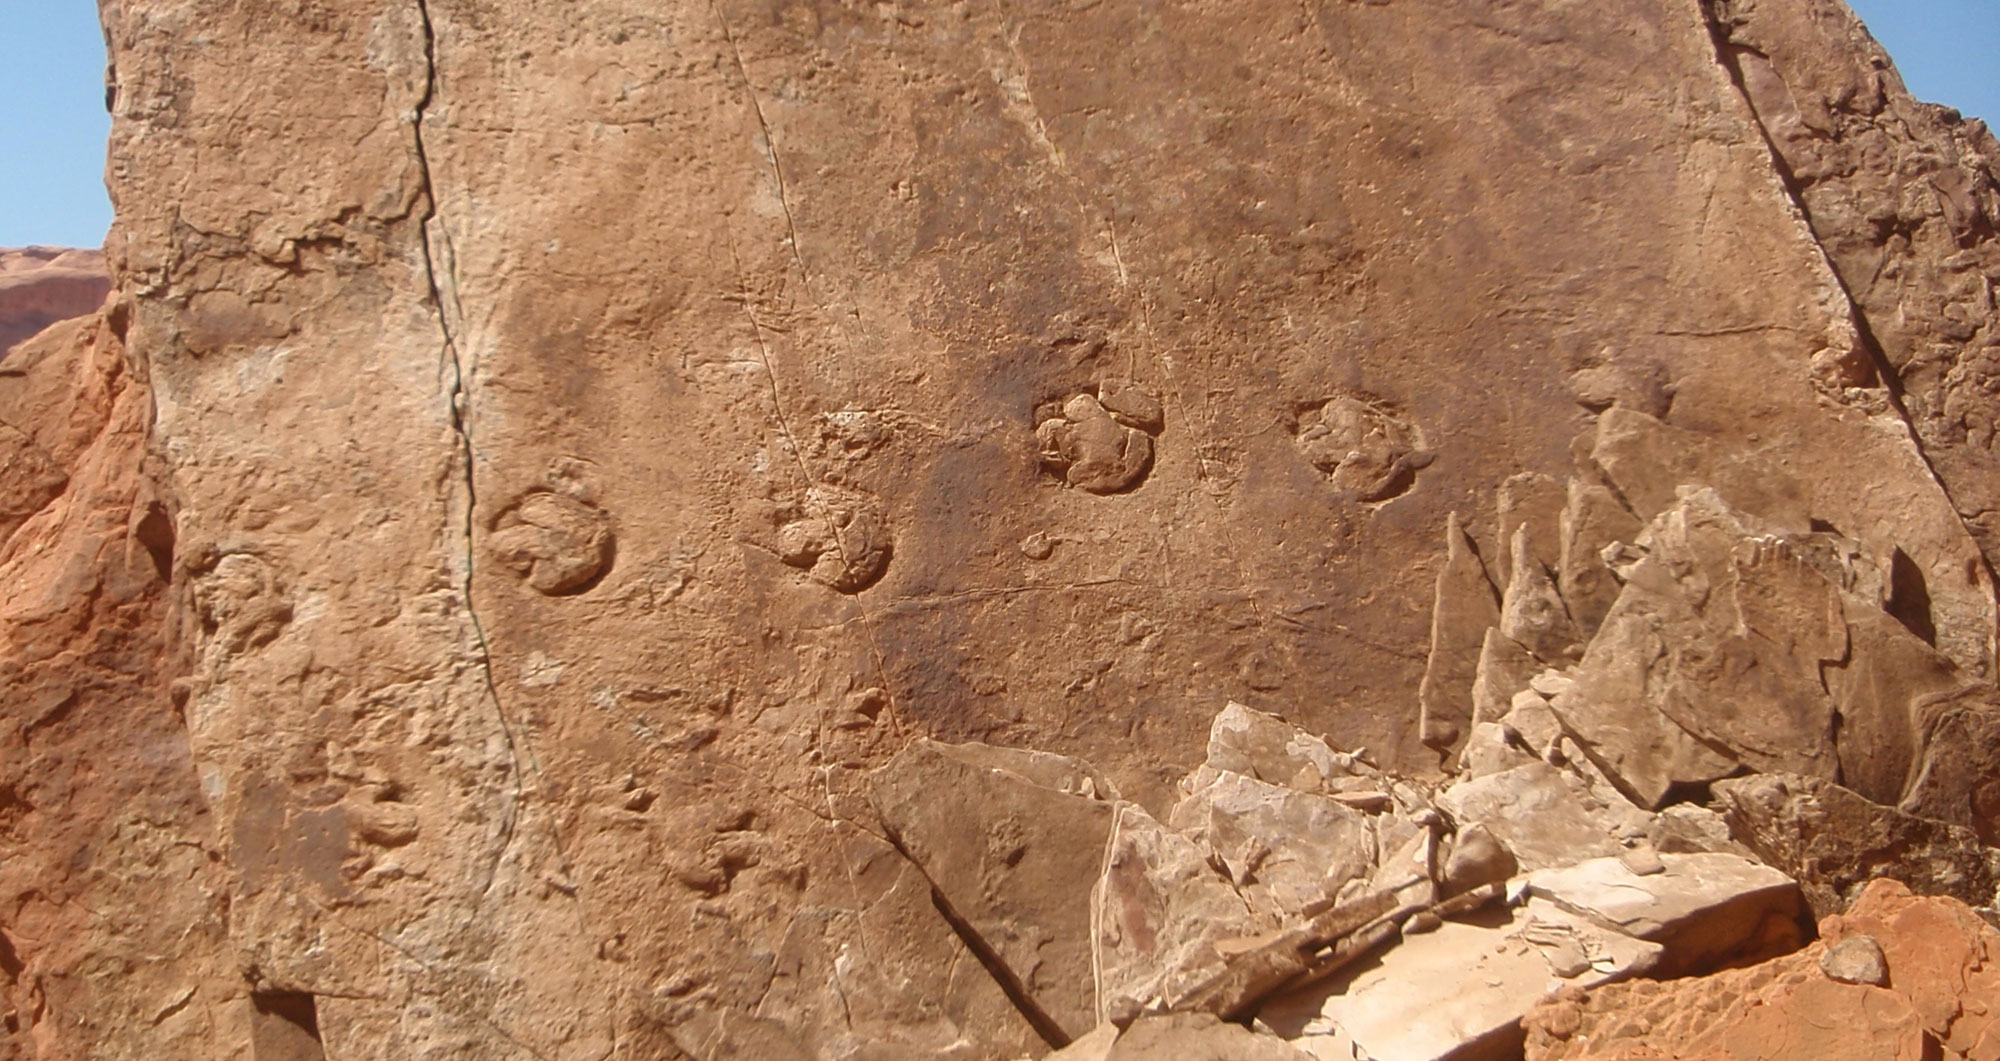
Ornithopod-type tracks, Powell Fossil Track Block Tracksite, Jurassic Navajo Sandstone, Glen Canyon National Recreation Area, Arizona and Utah. Photo source: National Park Service (public domain).
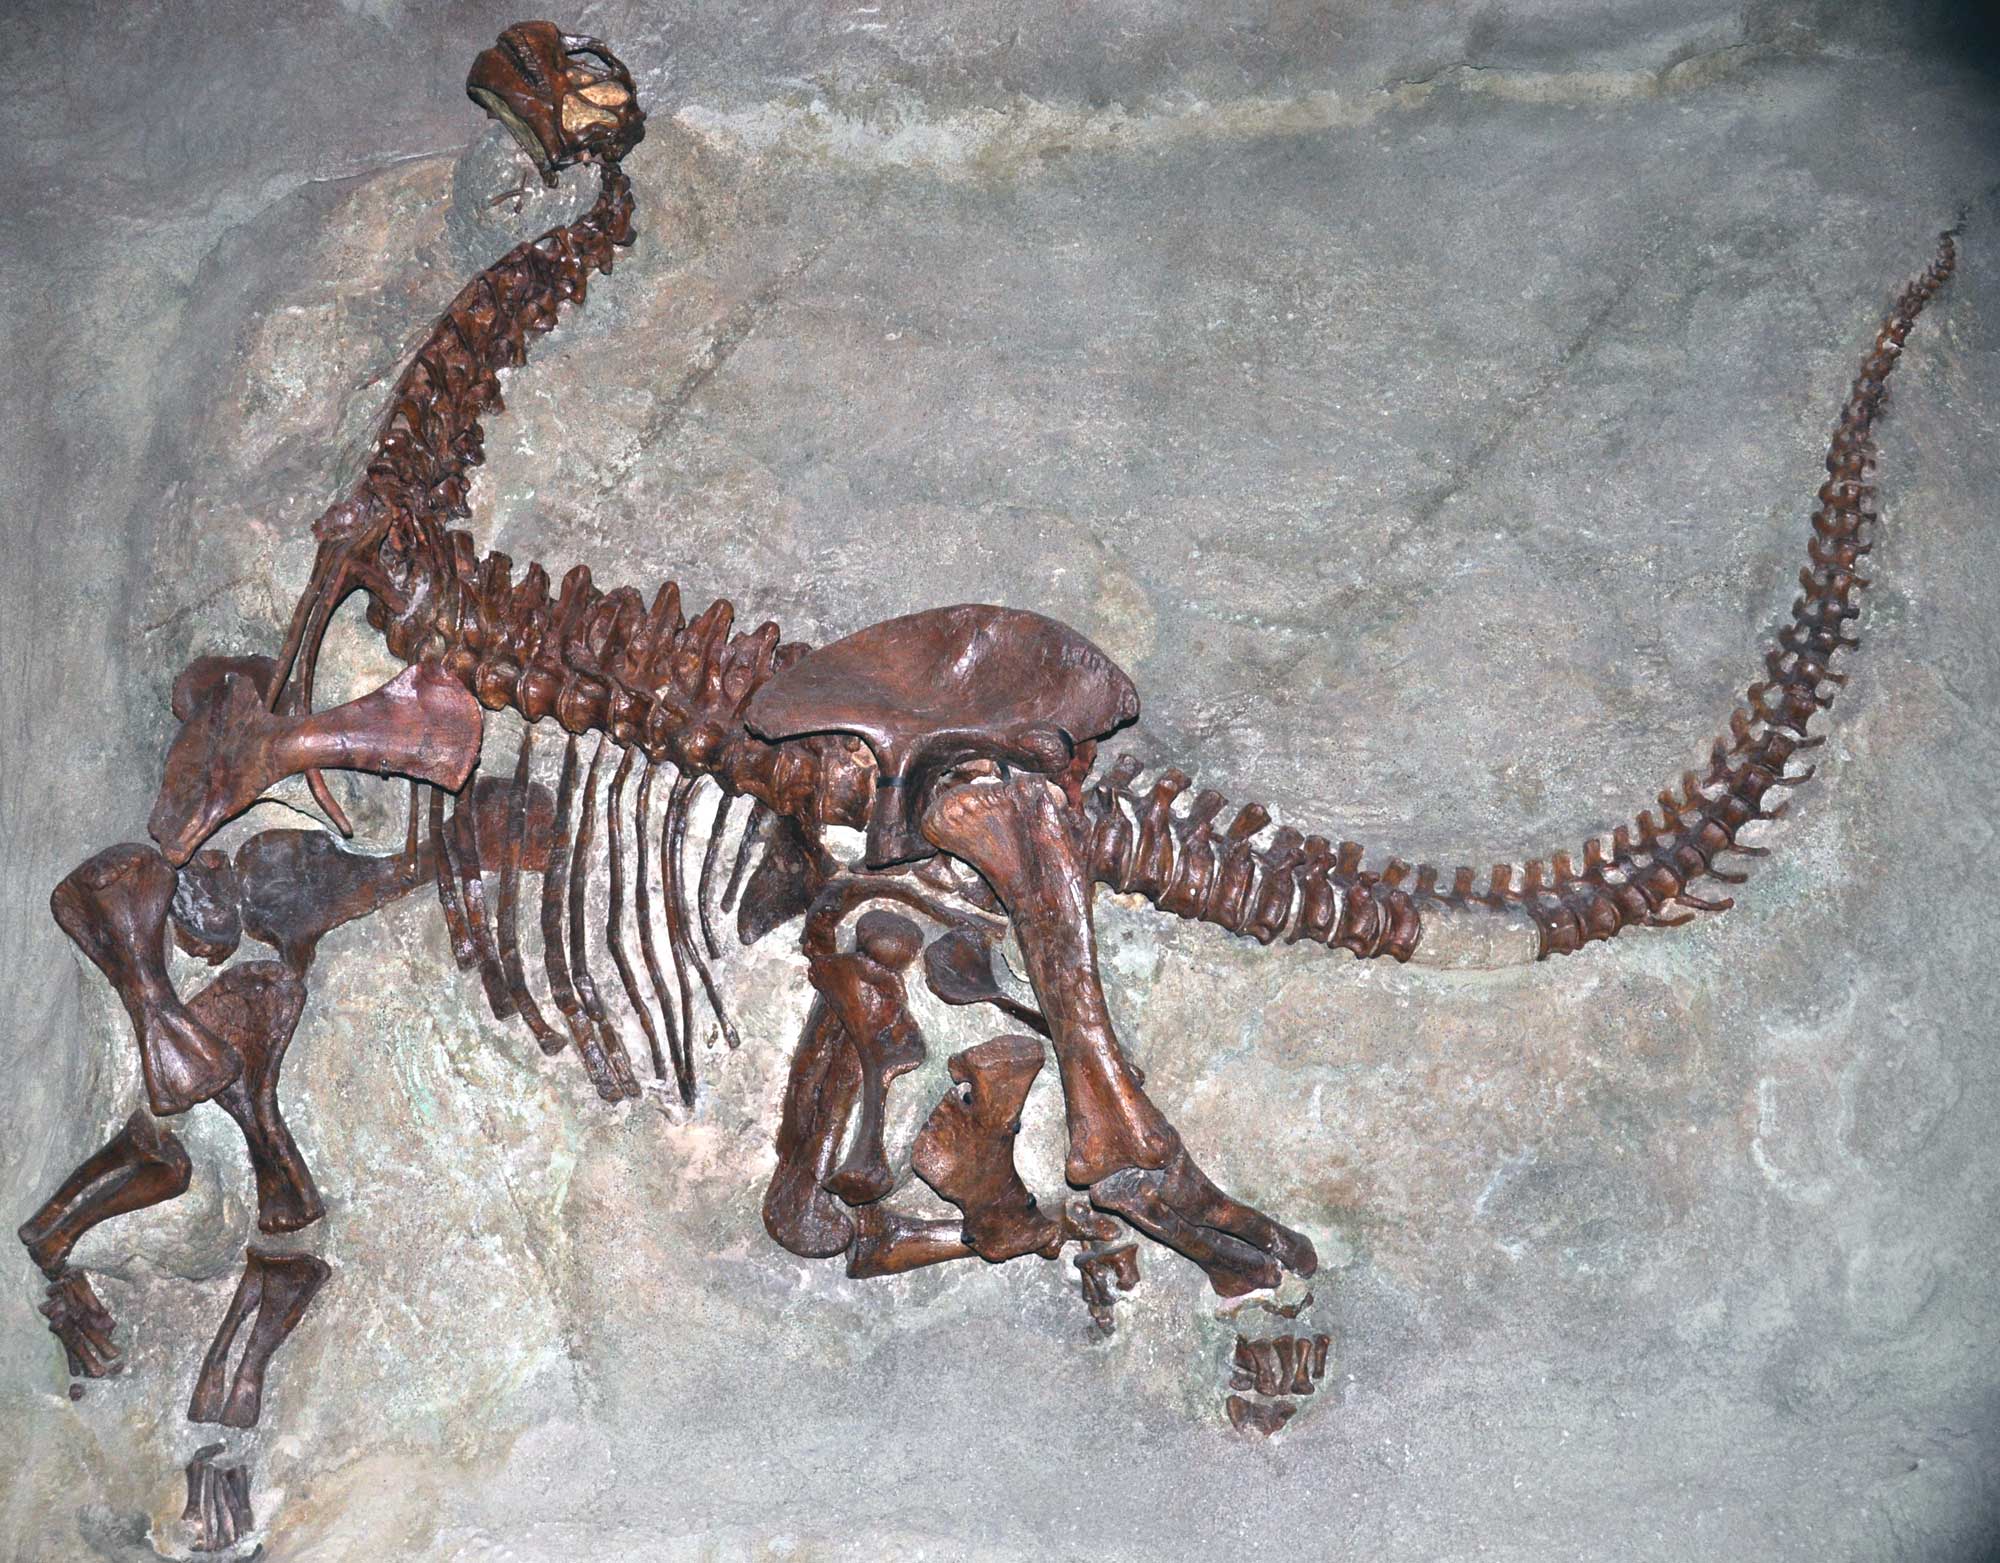
Skeleton of a juvenile Camarosaurs lentus, a type of sauropod, from the Carnegie Quarry, Jurassic Morrison Formation, Dinosaur National Monument, Utah and Colorado. Photo by James St. John (flickr, Creative Commons Attribution 2.0 Generic license, image cropped and resized).
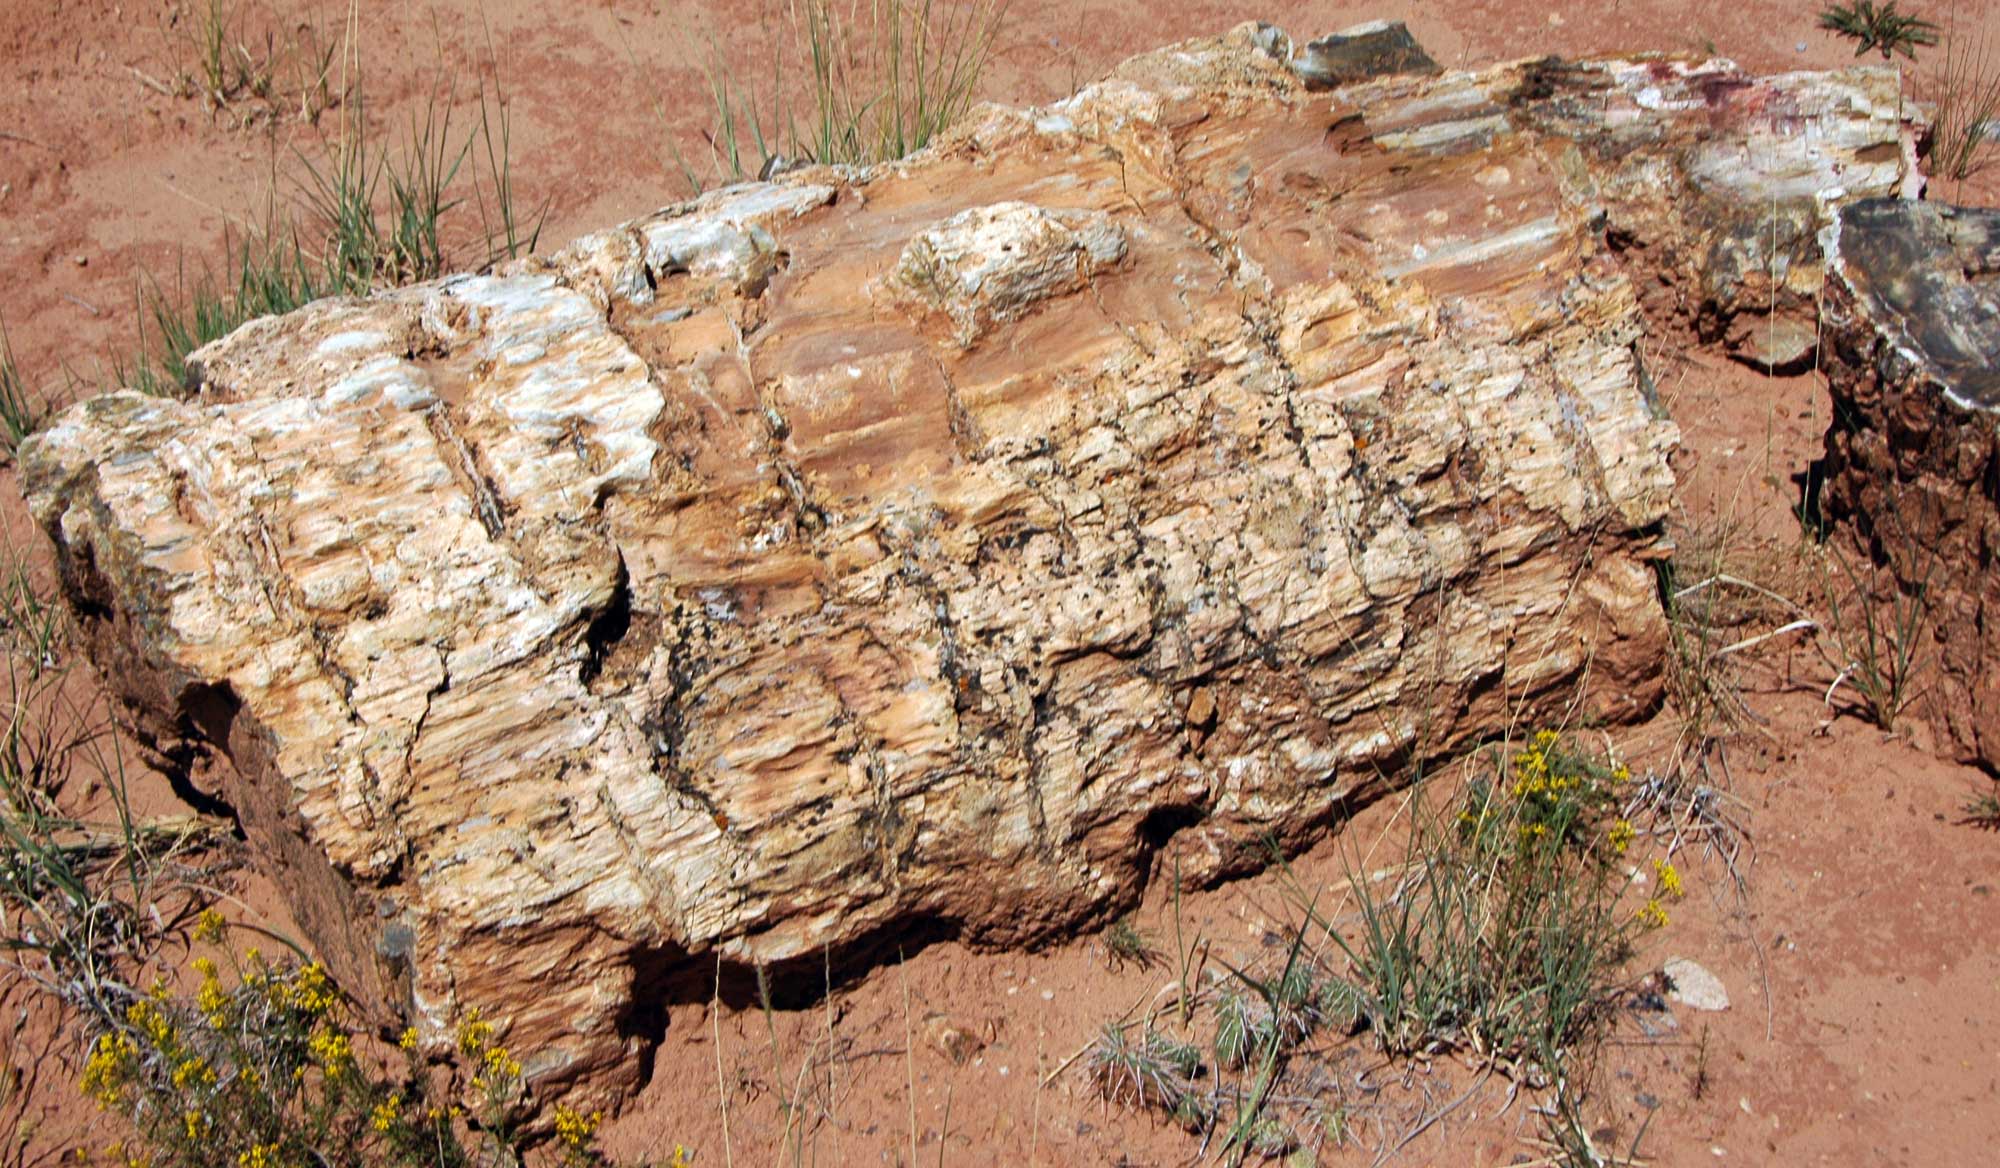
Petrified log at Escalante Petrified Forest State Park, Jurassic Morrison Formation, Garfield County, Utah. Photo by James St. John (flickr, Creative Commons Attribution 2.0 Generic license, image cropped and resized).
Cretaceous (145 to 66 million years ago)
As a result of displacement due to continental rifting and seafloor spreading, sea level throughout the Cretaceous was much higher than it is today. Global temperatures during the Cretaceous were very warm, as much as 10°C (18°F) above those at present. There was likely little or no glacial ice anywhere on Earth, and temperatures were highest in lower latitudes.
Shallow seaways spread over many of the continents, including South America, Africa, Eurasia, and North America. In the middle Cretaceous, oceans covered most of the Southwest, with the exception of parts of Arizona and New Mexico. By the start of the Late Cretaceous, this inland sea, called the Western Interior Seaway, divided North America in two; the water was rich with mosasaurs, giant clams, and other marine life.
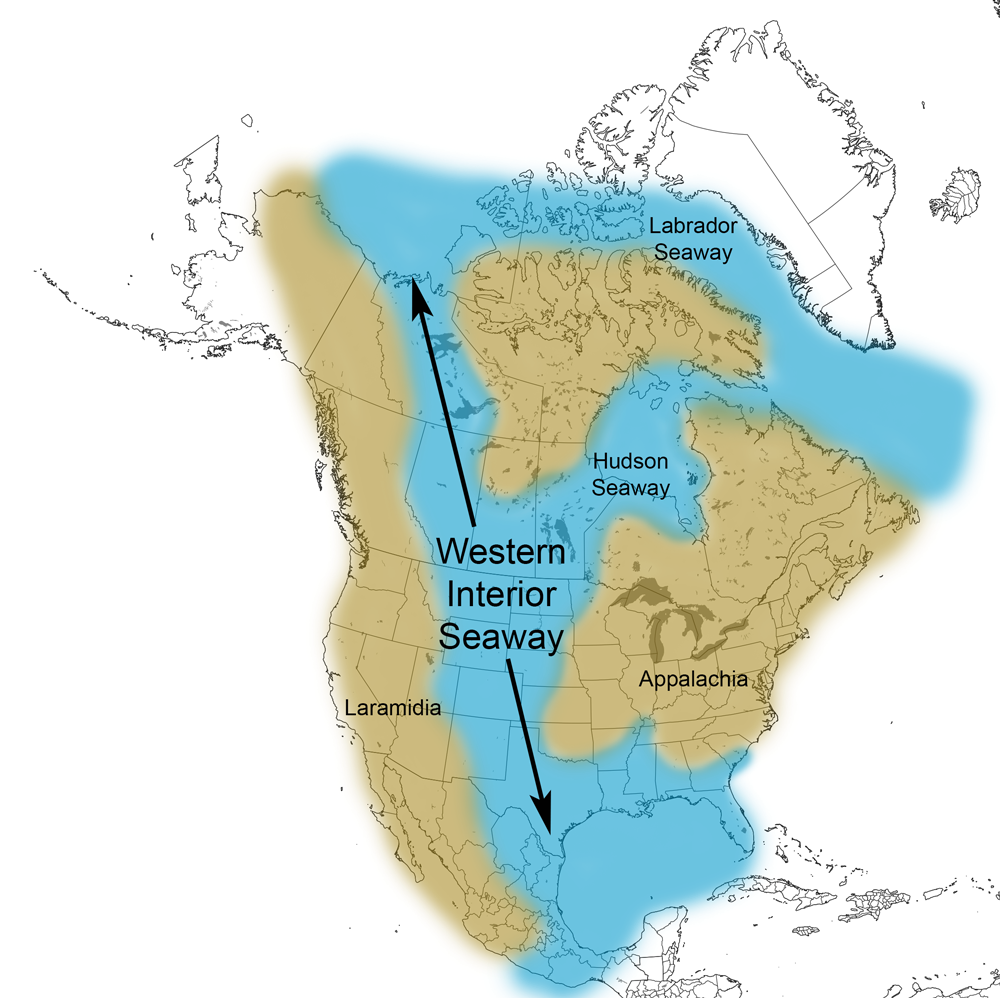
Extent of the Western Interior Seaway during the Cretaceous Period. Image from Cretaceous Atlas of Ancient Life: Western Interior Seaway (Creative Commons Attribution-NonCommercial-ShareAlike 4.0 International license).
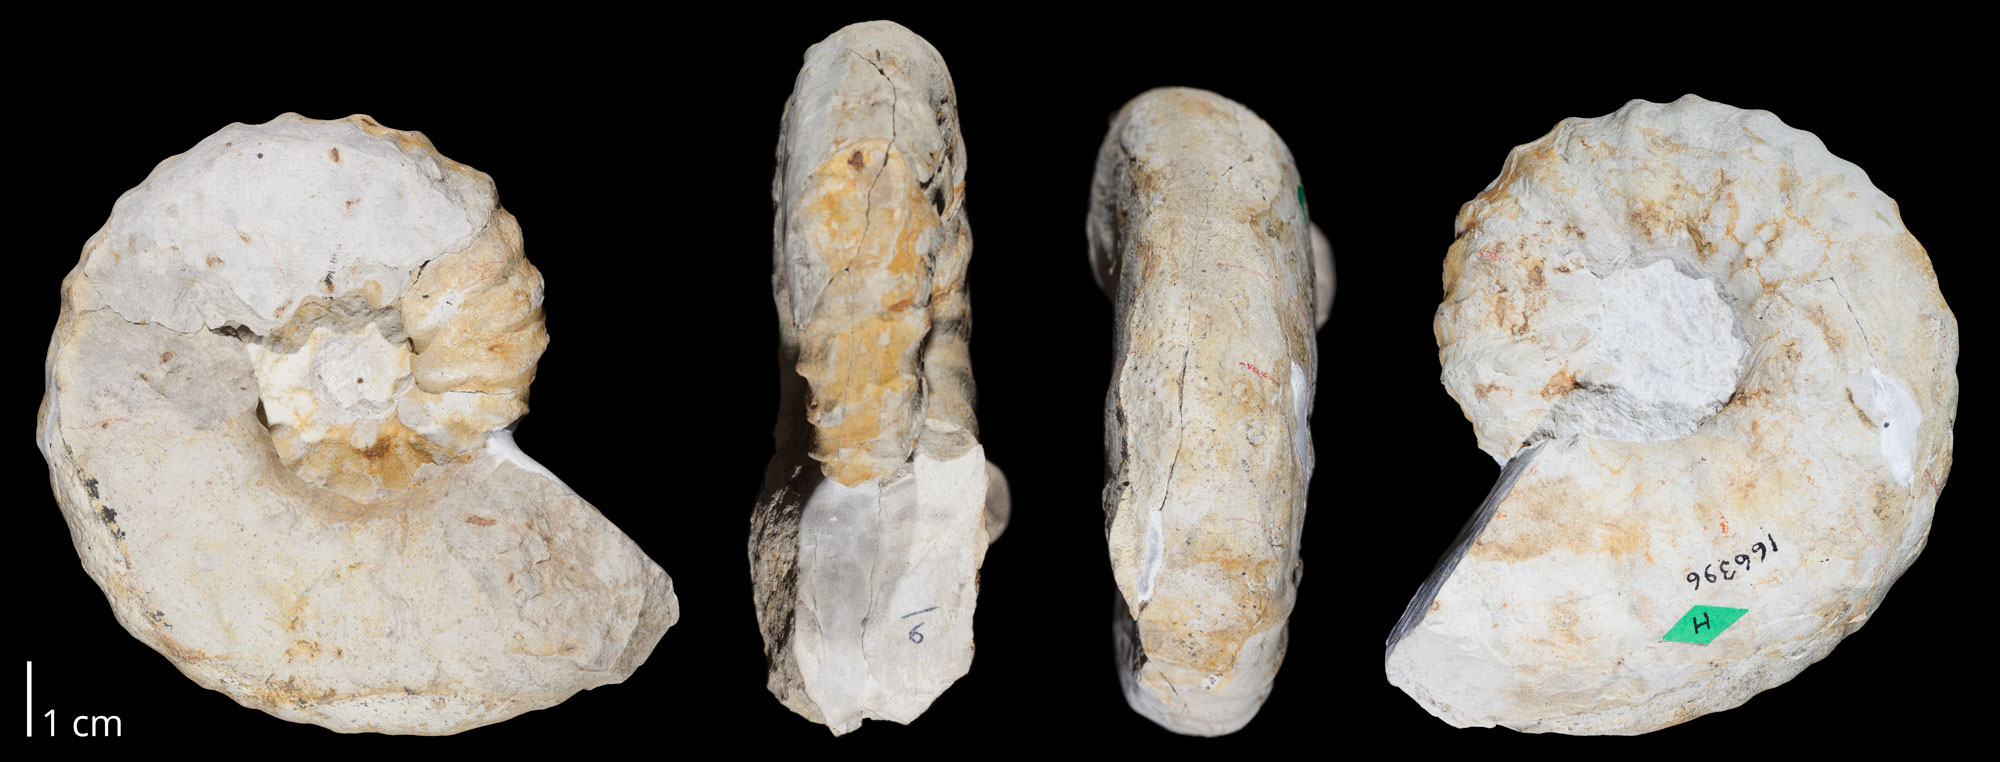
Fossil ammonoid (Nigericeras scotti) from the Late Cretaceous Greenhorn Limestone, Baca County, Colorado. Photo of USNM 166396 from the Cretaceous Atlas of Ancient Life (Creative Commons Attribution-NonCommercial-ShareAlike 4.0 International license, image cropped).
In the latest Cretaceous, sea level dropped again and the western Southwest became a broad coastal plain that hosted lush forests, abundant dinosaurs, and large swamps. By the end of the Cretaceous, uplift to the west was great enough that the resulting hills shed large amounts of sand and gravel in an easterly direction, pushing the shoreline eastward until sediment (combined with a worldwide drop in sea level) filled the area formerly occupied by the Western Interior Seaway. As the continents moved closer to their modern positions, the Southwest experienced a hot and humid tropical climate. At the close of the Mesozoic, global climate—although warmer than today—was cooler than at the start of the era.
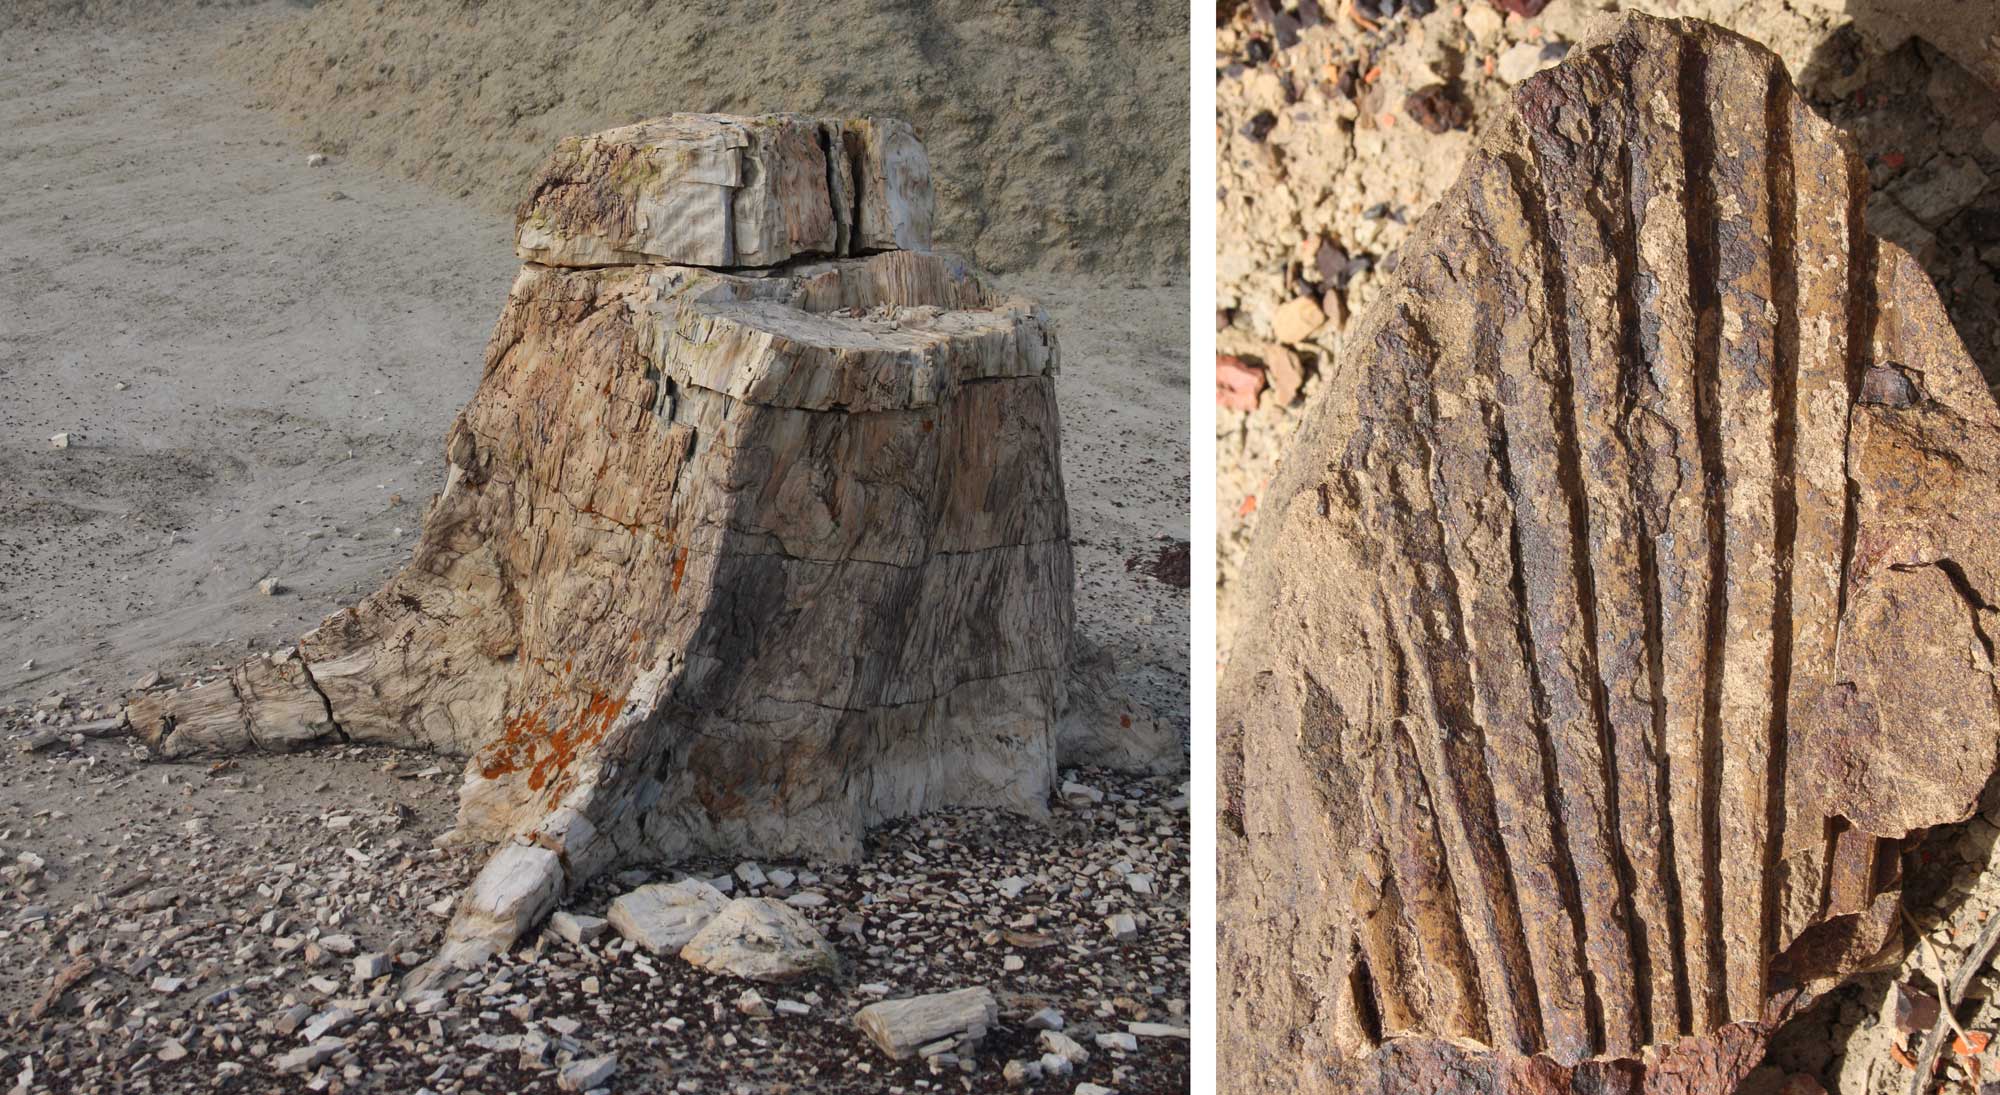
Fossil plants, Late Cretaceous Fruitland Formation, San Juan Basin, New Mexico. Left: A petrified stump. Right: Sabalites, a palm leaf. Left image and right image by NickLongrich (Wikimedia Commons, Creative Commons Attribution-ShareAlike 4.0 International license, images cropped and resized).
At the very end of the Cretaceous, the Gulf Coast experienced an enormous disruption when a large asteroid or bolide collided with Earth in what is now the northern Yucatán Peninsula in Mexico. The impact vaporized both water and rock, blocking out sunlight for weeks to years, which led to a collapse of photosynthesis and food webs on land and in the oceans. The event devastated the Southwest, shifting a densely forested landscape to one primarily covered with fast-growing herbs and ferns.
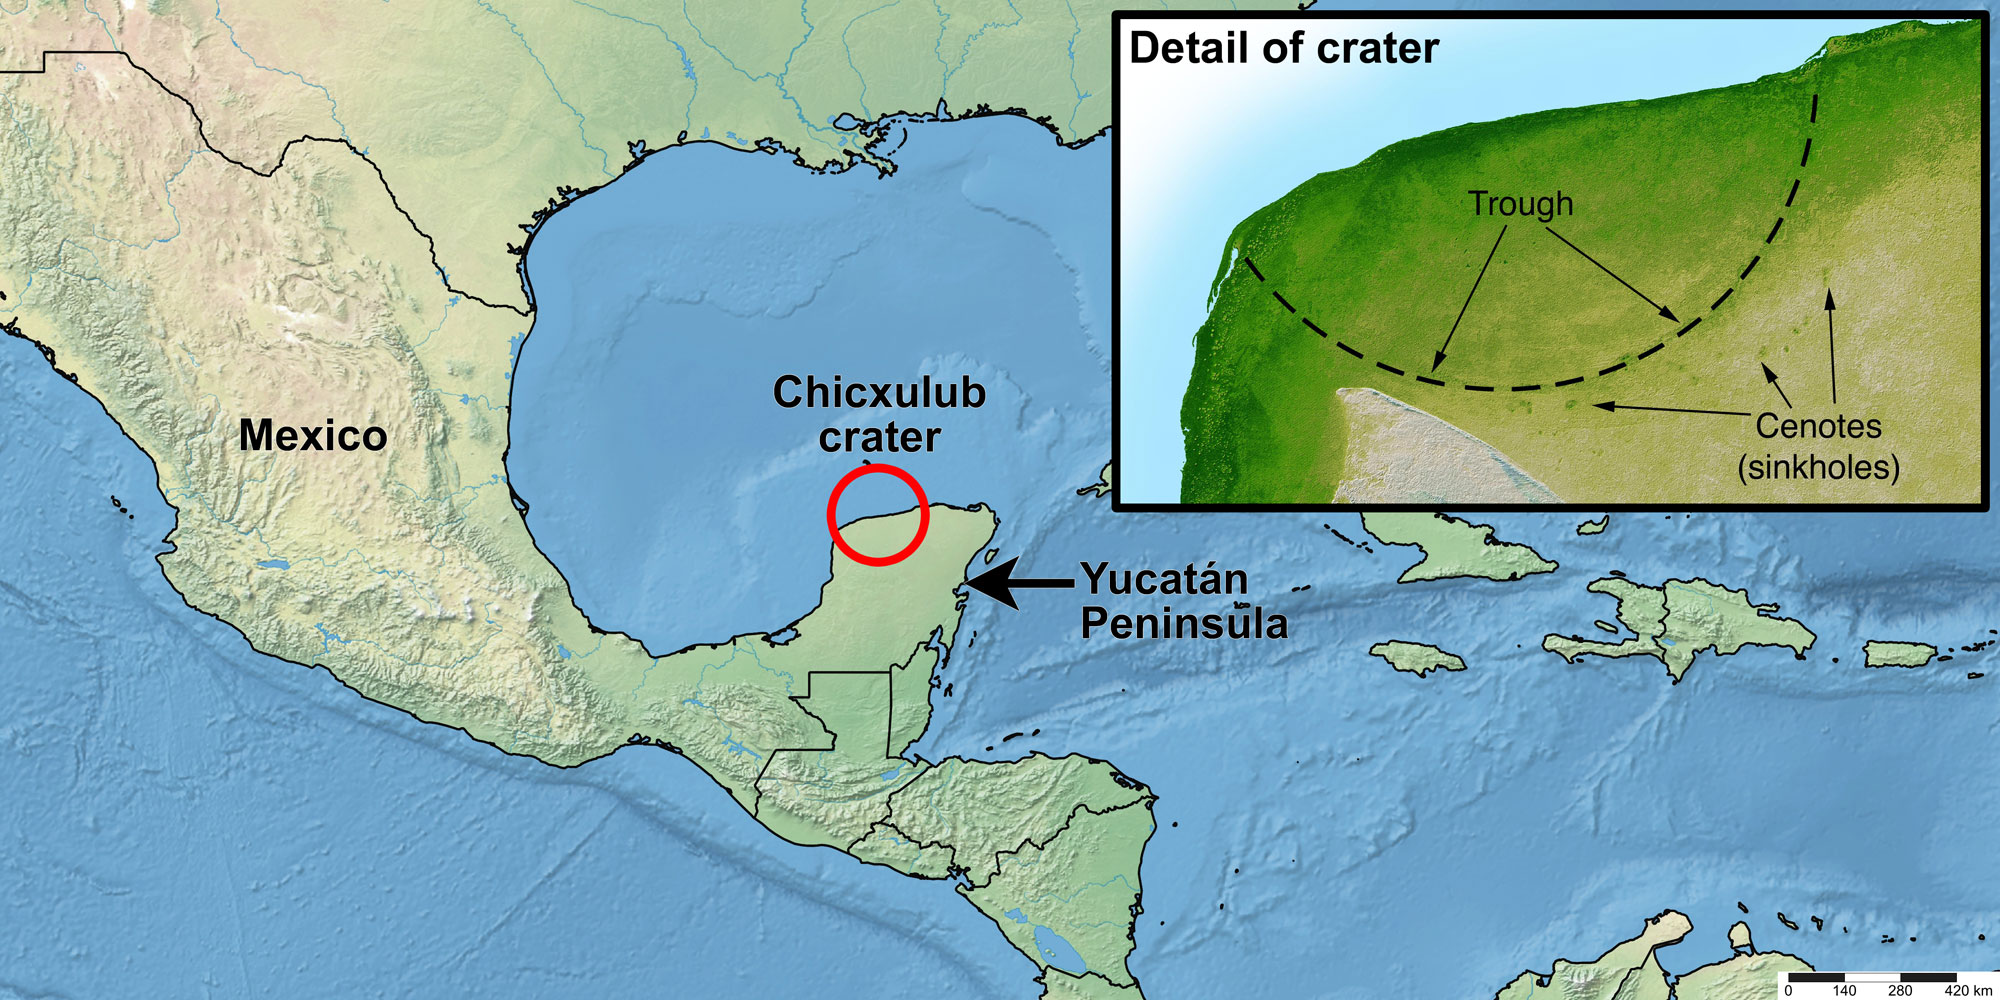
Map of the modern Yucatán Peninsula region showing the location of the Chicxulub impact crater. The inset image is a shaded relief image that shows the edge of the crater on the Yucatán Peninsula with sinkholes in the rock surrounding it. Map made by Elizabeth J. Hermsen using Simplemappr and modified in Photoshop. Inset image from the NASA Jet Propulsion Laboratory (PIA03397).
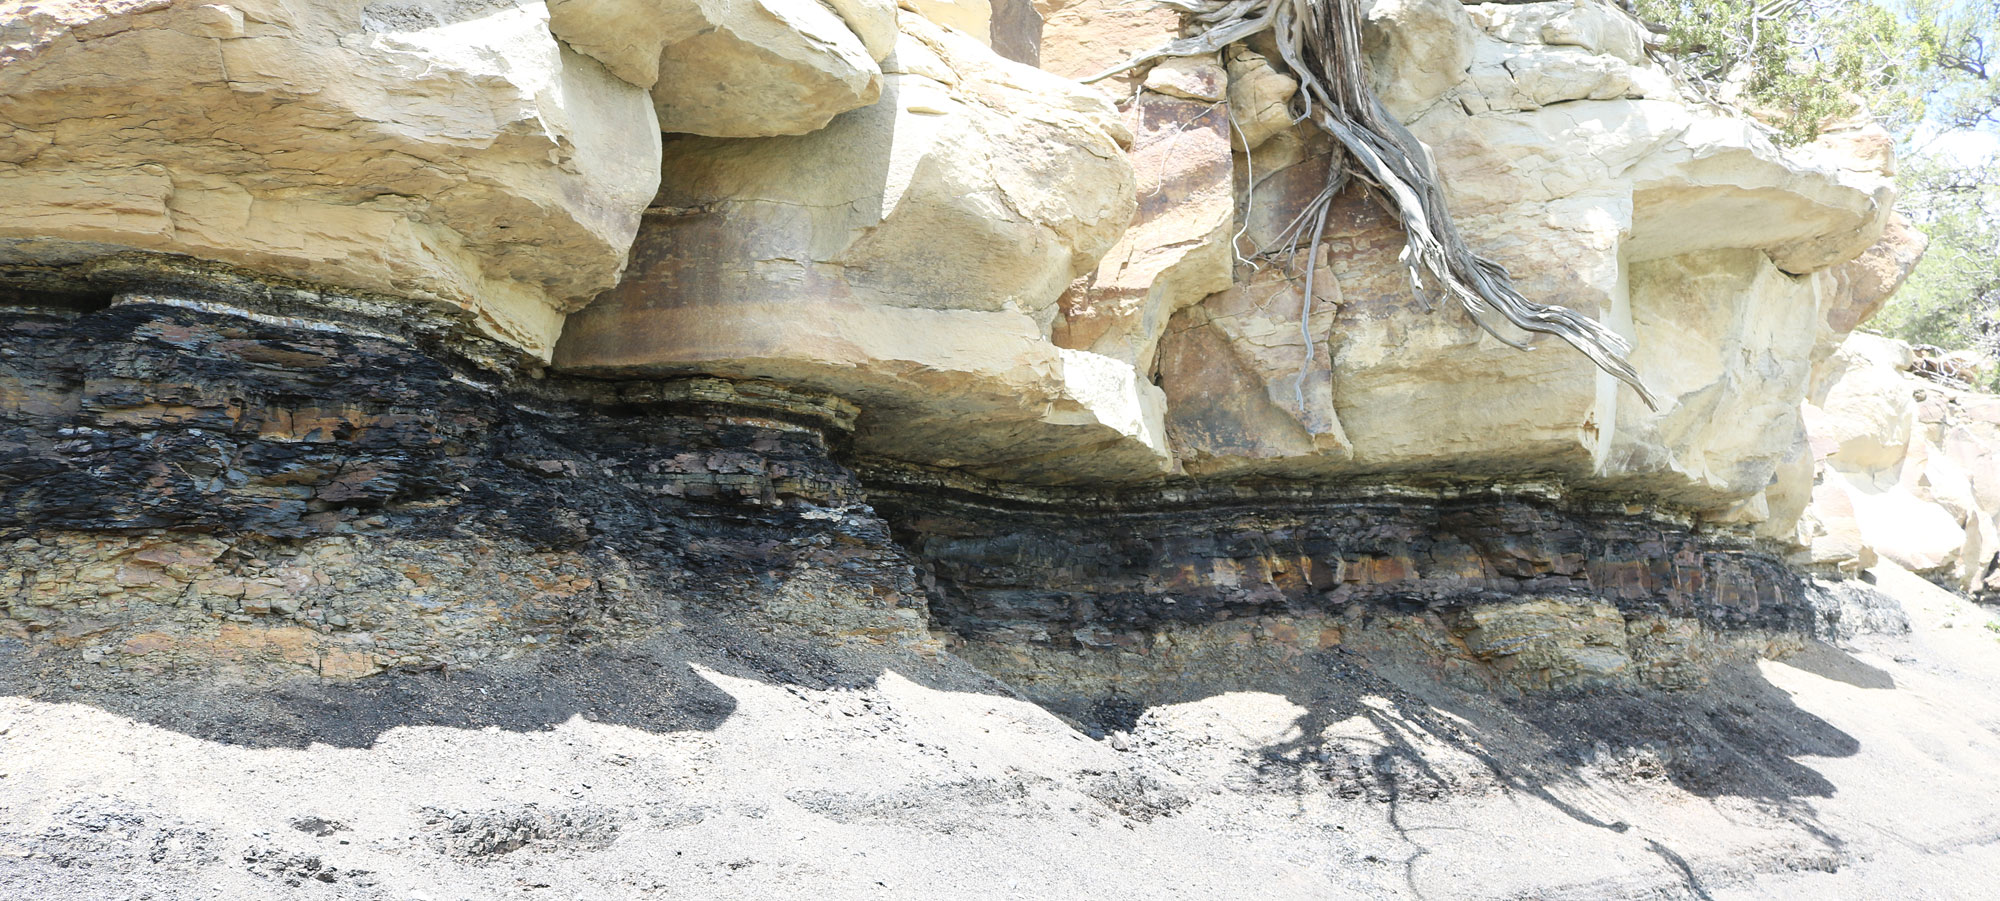
The Cretaceous-Paleogene boundary at Trinidad Lake State Park, Las Animas County, Colorado. Photo by Jeffrey Beall (Wikimedia Commons, Creative Commons Attribution 4.0 International license, image resized).
Cenozoic (66 million years ago to present)
Paleogene to Neogene (66 to 2.6 million years ago)
After the end-Cretaceous bolide impact, the climate may have cooled briefly, but it soon rebounded to a warmer state. During the Paleocene to Eocene, the Southwest’s climate was warm and wet, and large mammals roamed the forested landscape. Large lakes covered parts of northern Utah and Colorado. Volcanic activity was strong.
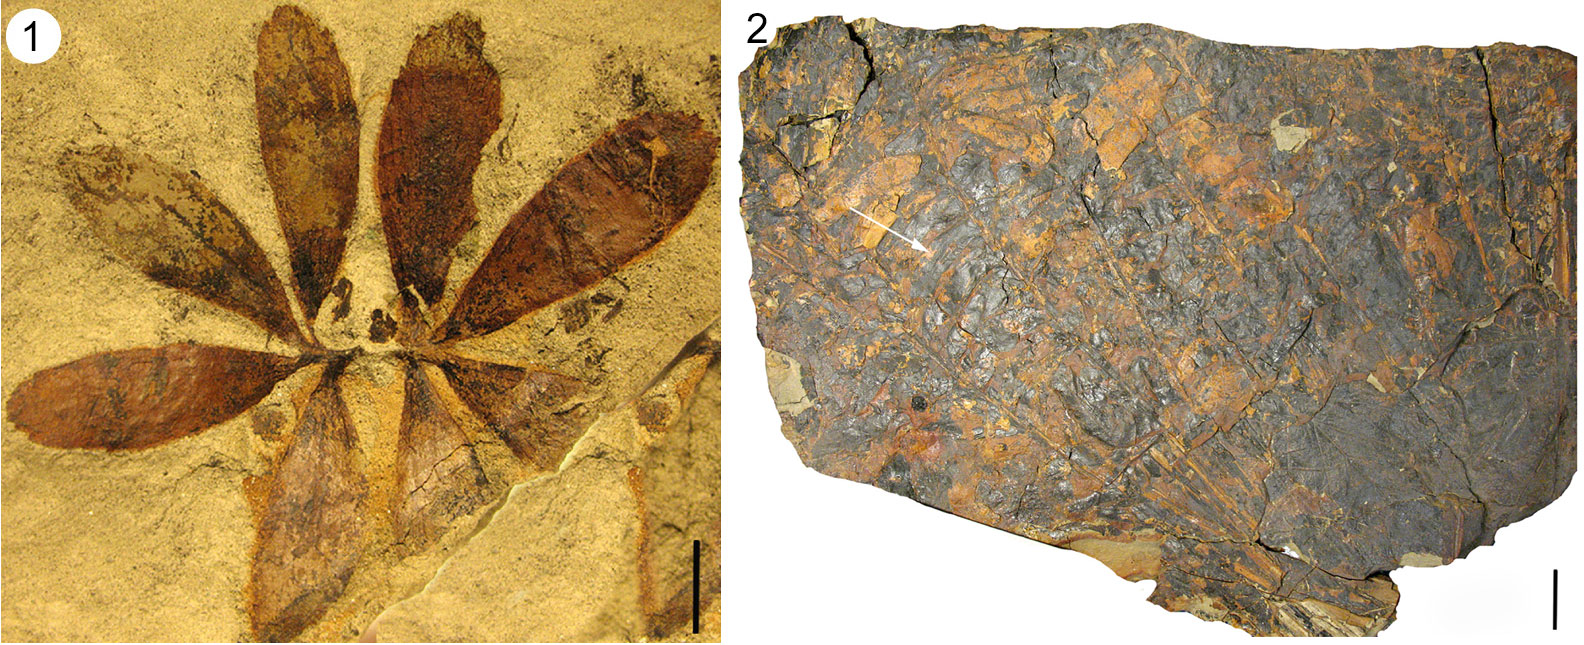
Fossils of a cycad (Dioonopsis praespinulosa) from the Paleocene Castle Rock Flora, Colorado. Cycads are a group of seed plants that look superficially similar to palms, but are not closely related to them and do not produce flowers. Left (1): Leaves of a seedling. Scale bar = 1 centimeter (about 0.4 inches). Right (2): Crown of leaves from a mature plant. The white arrow is pointing to one of the leaflets of a compound leaf. Scale bar = 5 centimeters (about 2 inches). Source: Figure 1 from Erdei et al. (2019) Biology Letters 15: 20190114 (Creative Commons Attribution 4.0 International license, images cropped, reconfigured, resized, and relabeled).
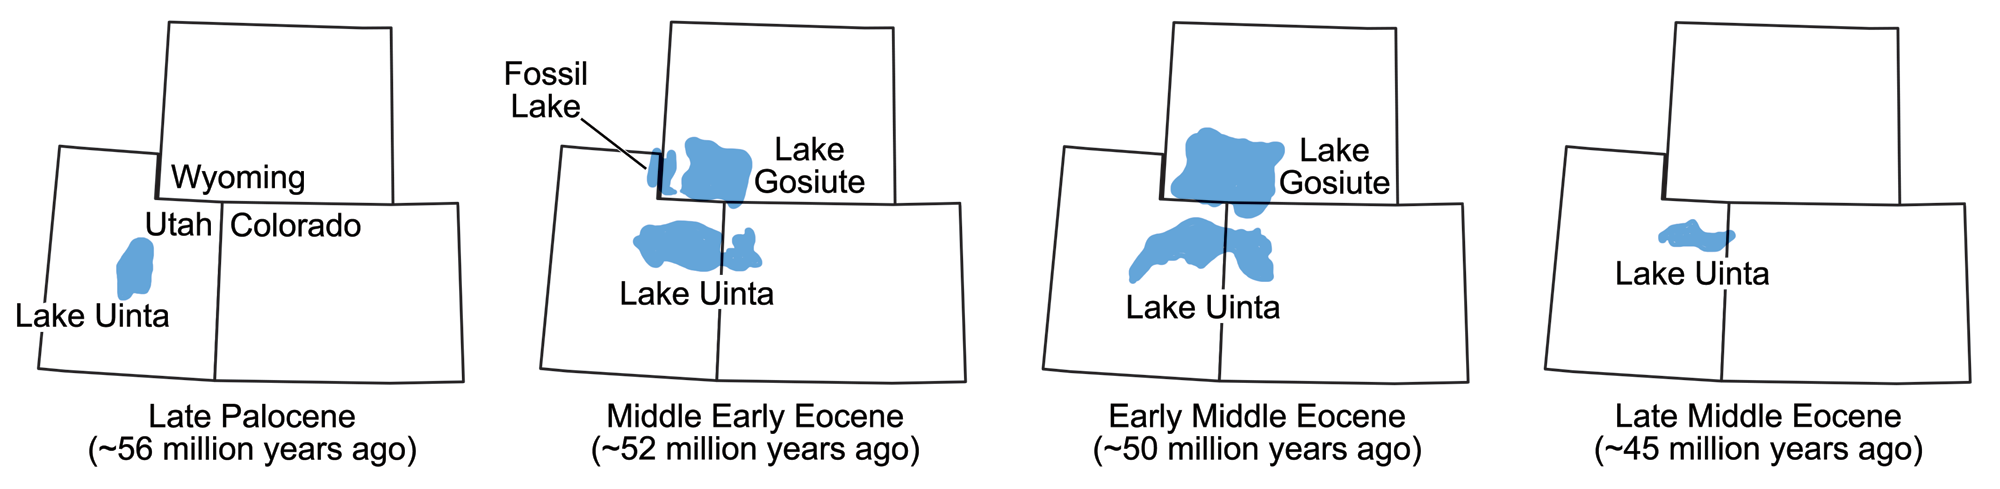
The size and location of various lakes in which the Green River Formation sediments were deposited during the Eocene epoch. Maps modified from maps by Wade Greenberg-Brand, originally published in The Teacher-Friendly Guide to the Earth Science of the Southwestern US, after figure 3 in L. Grande (2013) The Lost World of Fossil Lake.
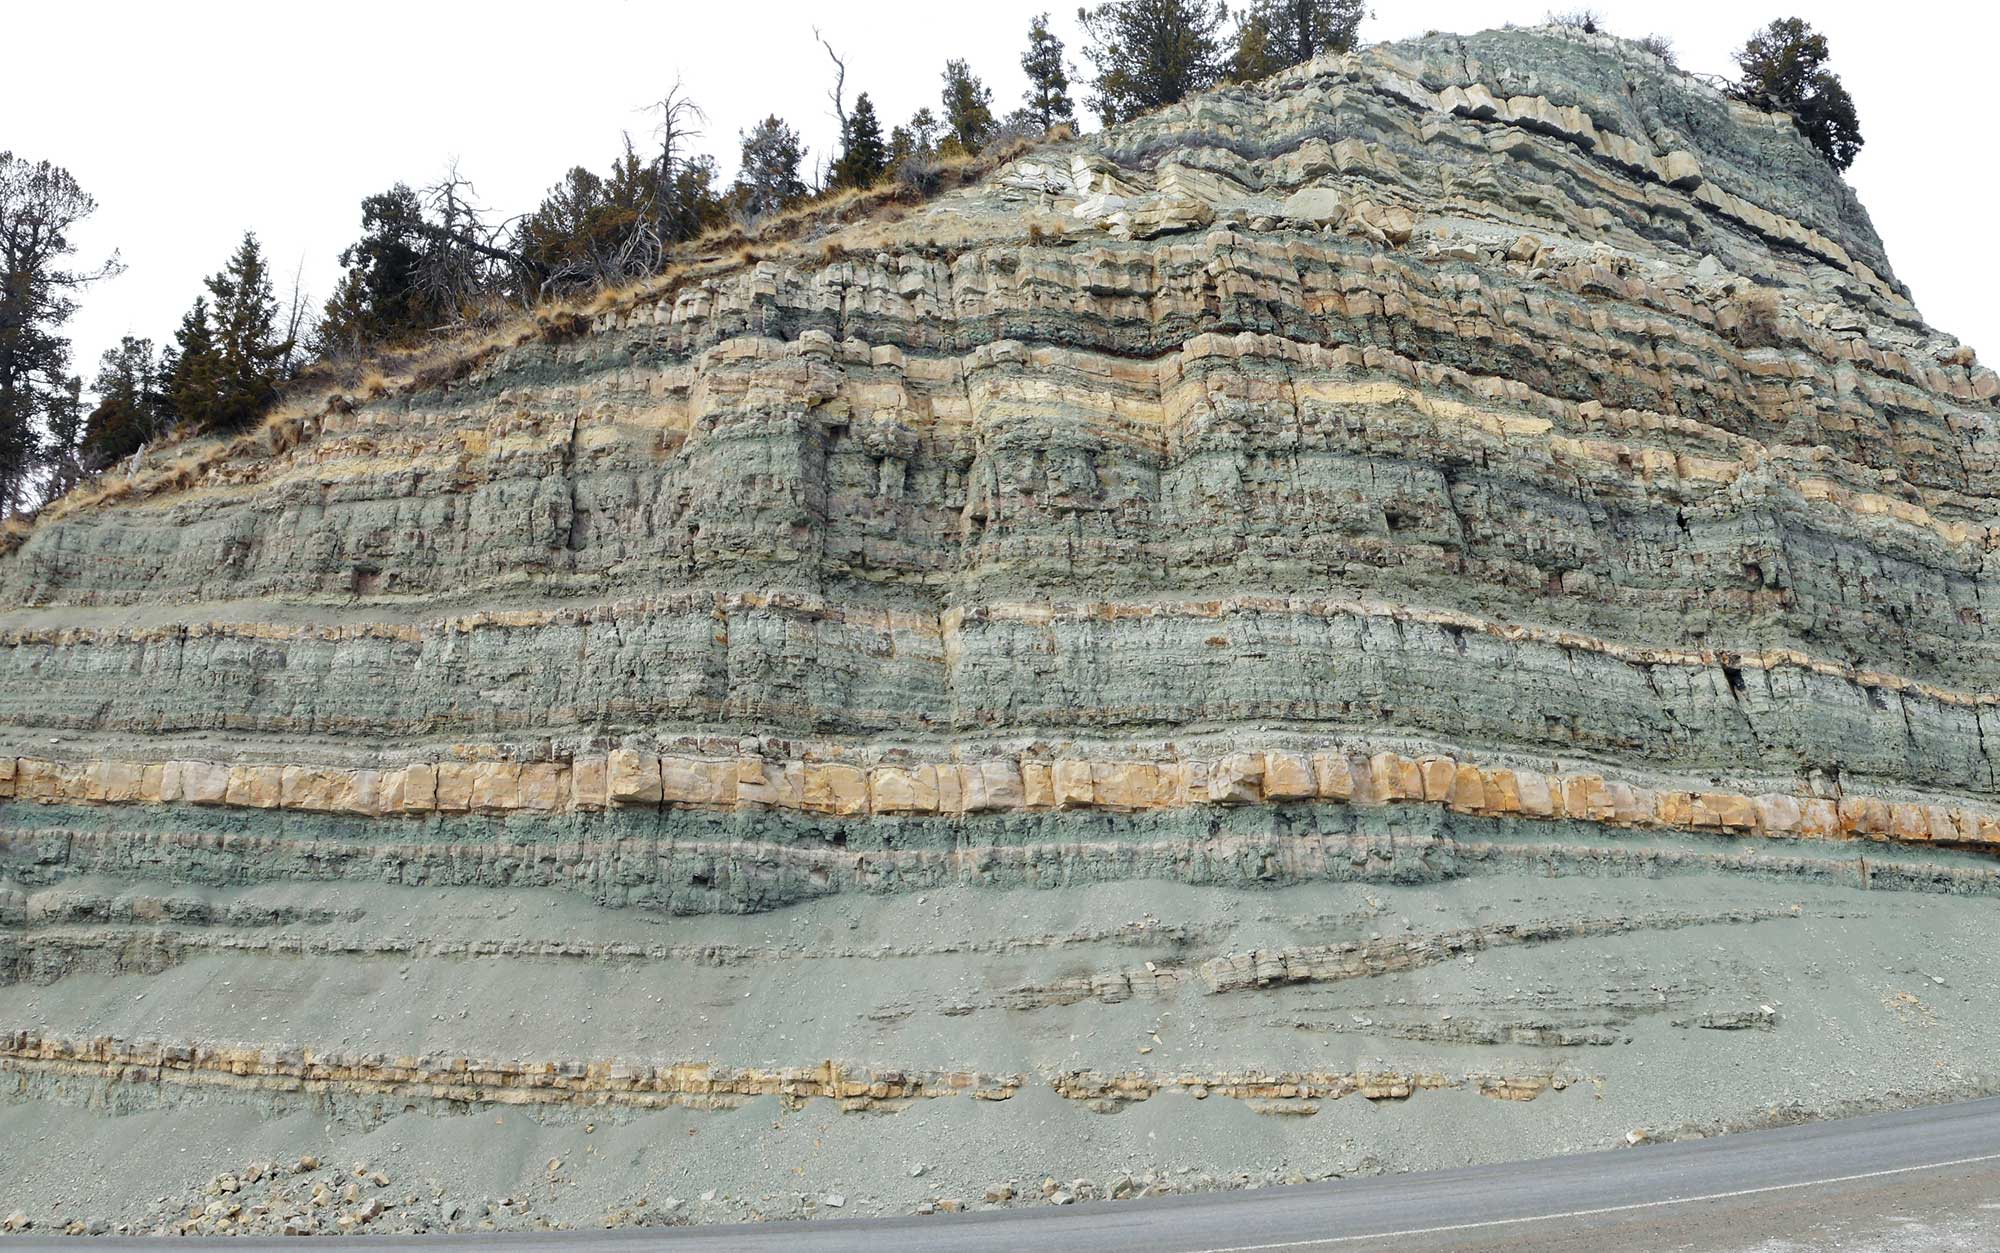
Roadcut exposing lake sediments of the Eocene Green River Formation, Duchesne County, Utah. Photo by Kenneth Carpenter (Wikimedia Commons, Creative Commons Attribution-ShareAlike 4.0 International license, image cropped and resized).
In the late Eocene, the Earth began to cool, and global temperatures fell sharply at the boundary between the Eocene and Oligocene epochs (approximately 35 million years ago), due in part to the separation of South America’s southern tip from Antarctica. Global temperatures fell further in the late Miocene thanks to the formation of the Himalayas.
Volcanic activity intensified in the Southwest, and the Basin and Range region began to form, leading to the topography that is seen in those areas today (i.e., low valleys alternating with high mountain ranges). While most of the evidence for cooling at the Eocene-Oligocene boundary comes from the deep sea, fossil mammals in the Rocky Mountains show clear evidence of a change from forests to grasslands, which is associated with global cooling.
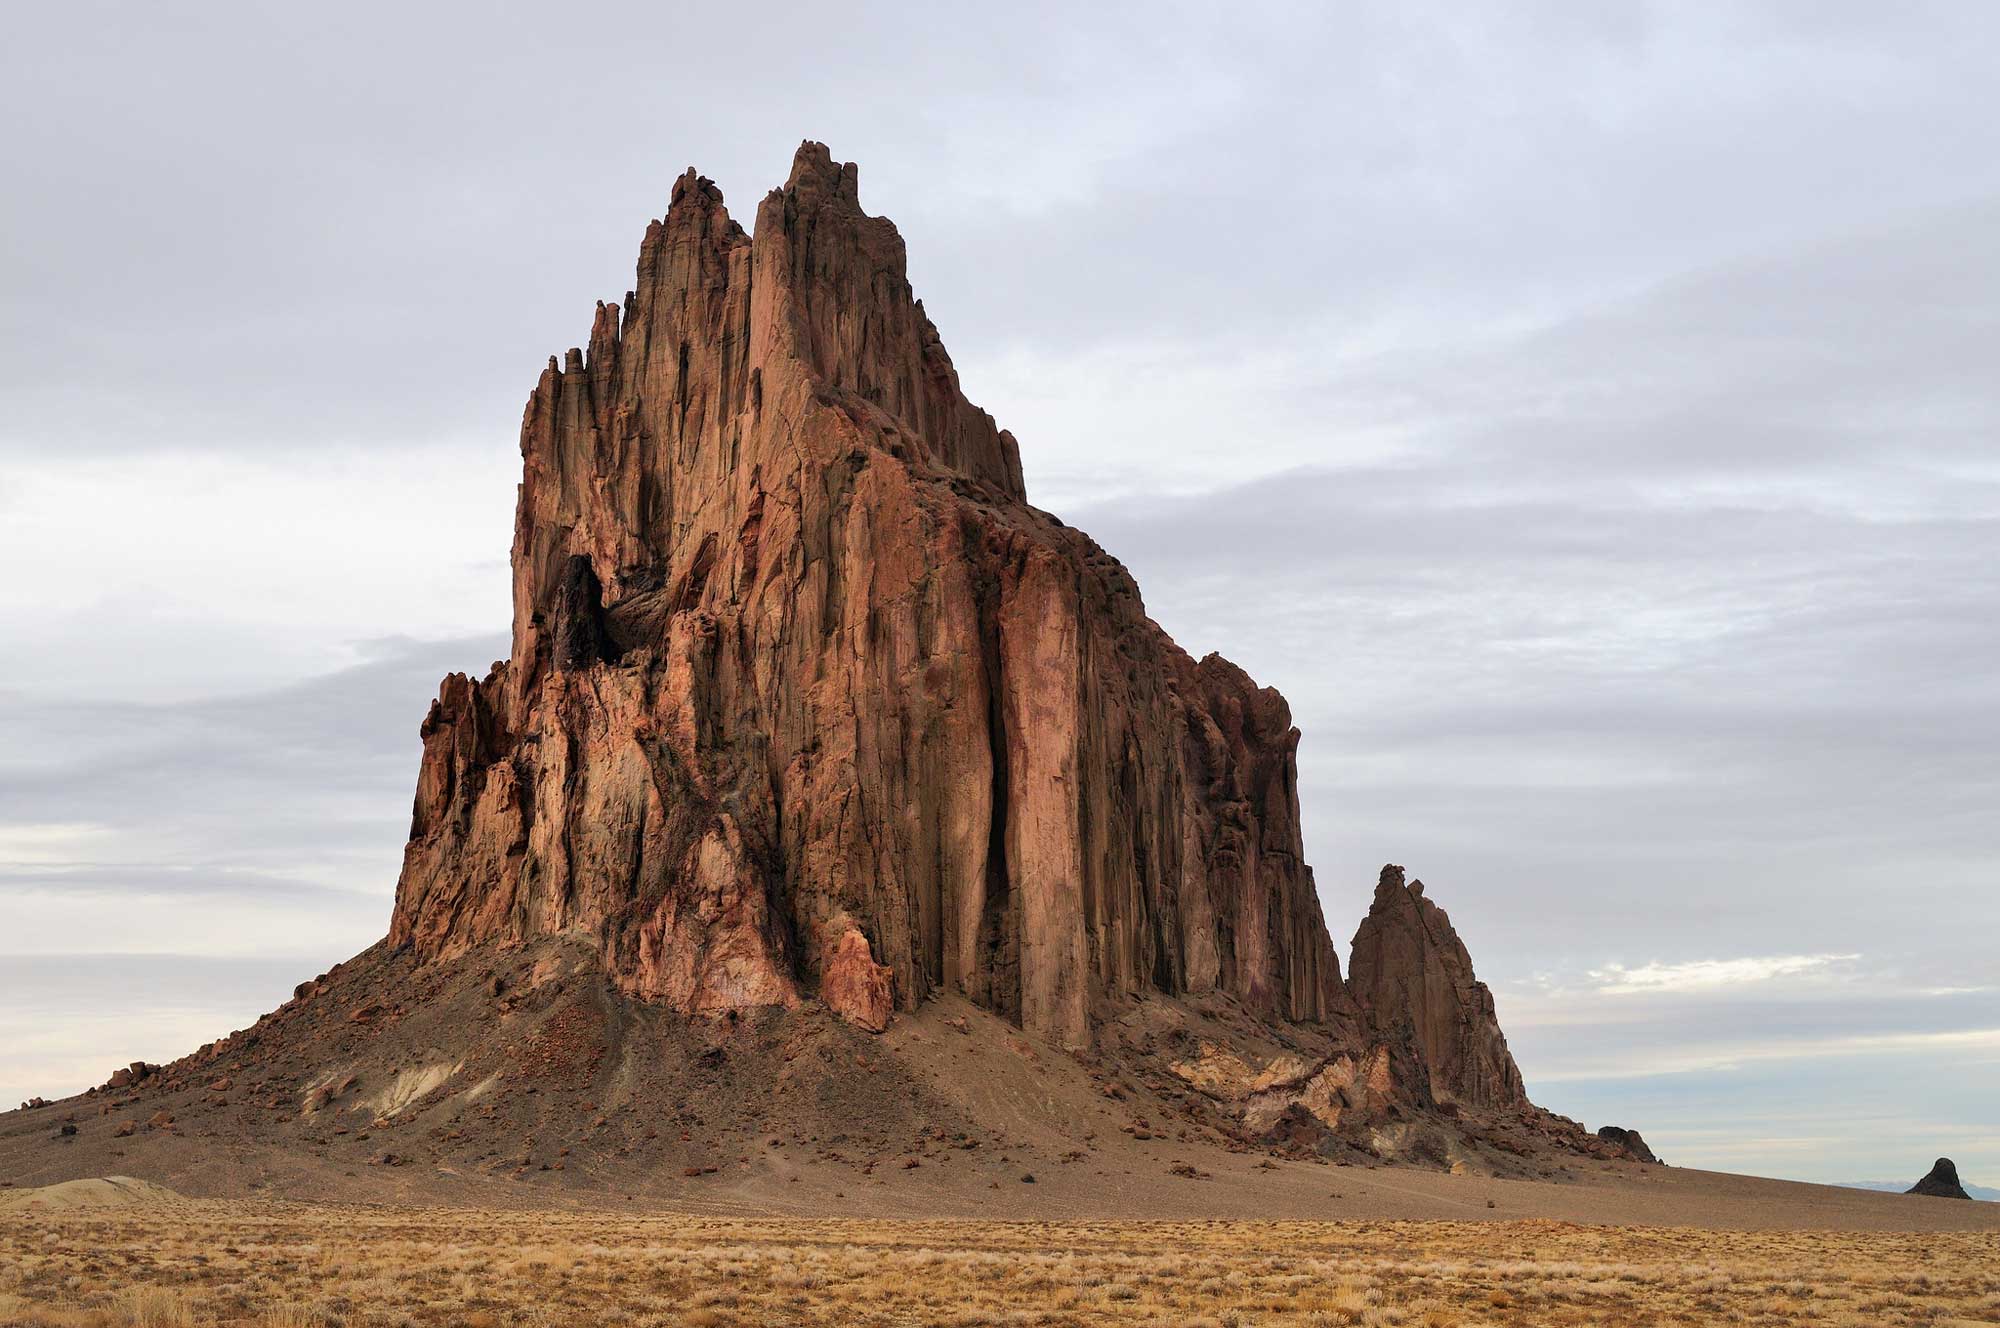
Shiprock, a volcanic monadnock in San Juan County, New Mexico, rises roughly 483 meters (1583 feet) above the desert plain. Shiprock is part of the San Juan volcanic field and dates to the Oligocene (about 27 million years ago). Photograph by "Cathy" (Flickr; Creative Commons Attribution-NonCommerical 2.0 Generic license).
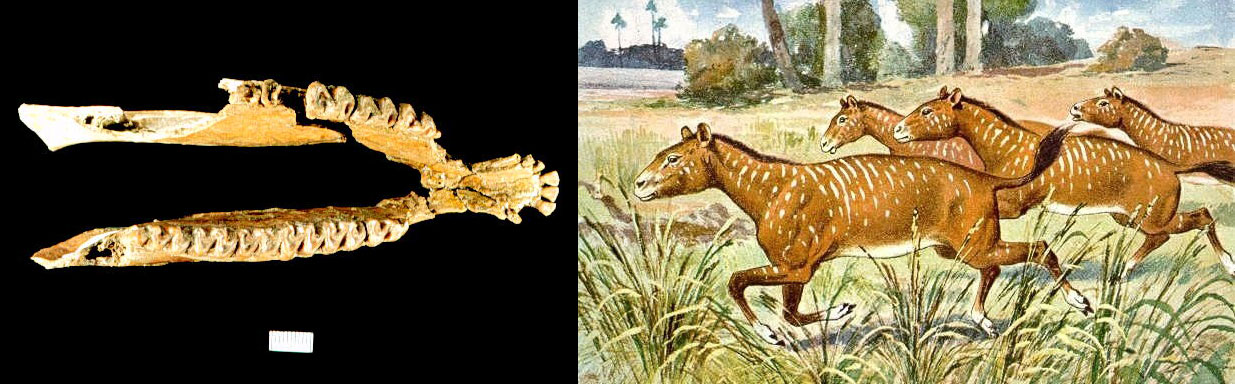
An ancient horse (Mesohippus), Eocene Florissant Fossil Beds, Teller County, Colorado. Mesohippus measured up to 70 centimeters (2 feet) at shoulder height. Left: Jaw with teeth. Right: Reconstruction of living animals. Photo and reconstruction by National Park Service/NPS (public domain).
Approximately 3.5 million years ago, glacial ice began to form over the Arctic Ocean and on the northern parts of North America and Eurasia. A major contributing factor to this event was a geological change that occurred far to the south. The Central American Isthmus, which today makes up most of Panama and Costa Rica, rose out of the ocean at approximately this time, formed by undersea volcanoes. The new dry-land isthmus blocked the warm ocean currents that had been flowing east-to-west from the Atlantic to the Pacific for more than 100 million years, diverting them into the Gulf of Mexico and ultimately into the western Atlantic Gulf Stream. The strengthened Gulf Stream carried more warm, moist air with it into the northern Atlantic, which caused increased snowfall in high latitudes, leading to accelerating cooling.
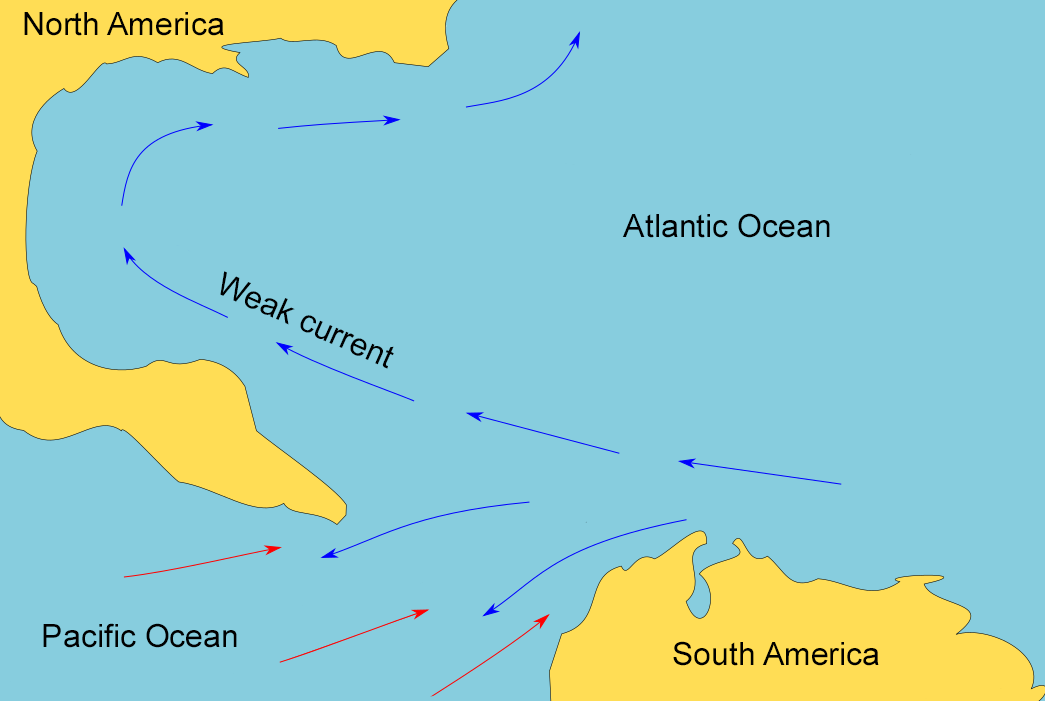
Map of the Gulf of Mexico region before the closure of the Isthmus of Panama. Before the Isthmus closed, the Atlantic and Pacific oceans were connected. Map modified from a map by Chiche Ojeda (Wikimedia Commons, Creative Commons Attribution-ShareAlike 4.0 International license, image cropped and modified).
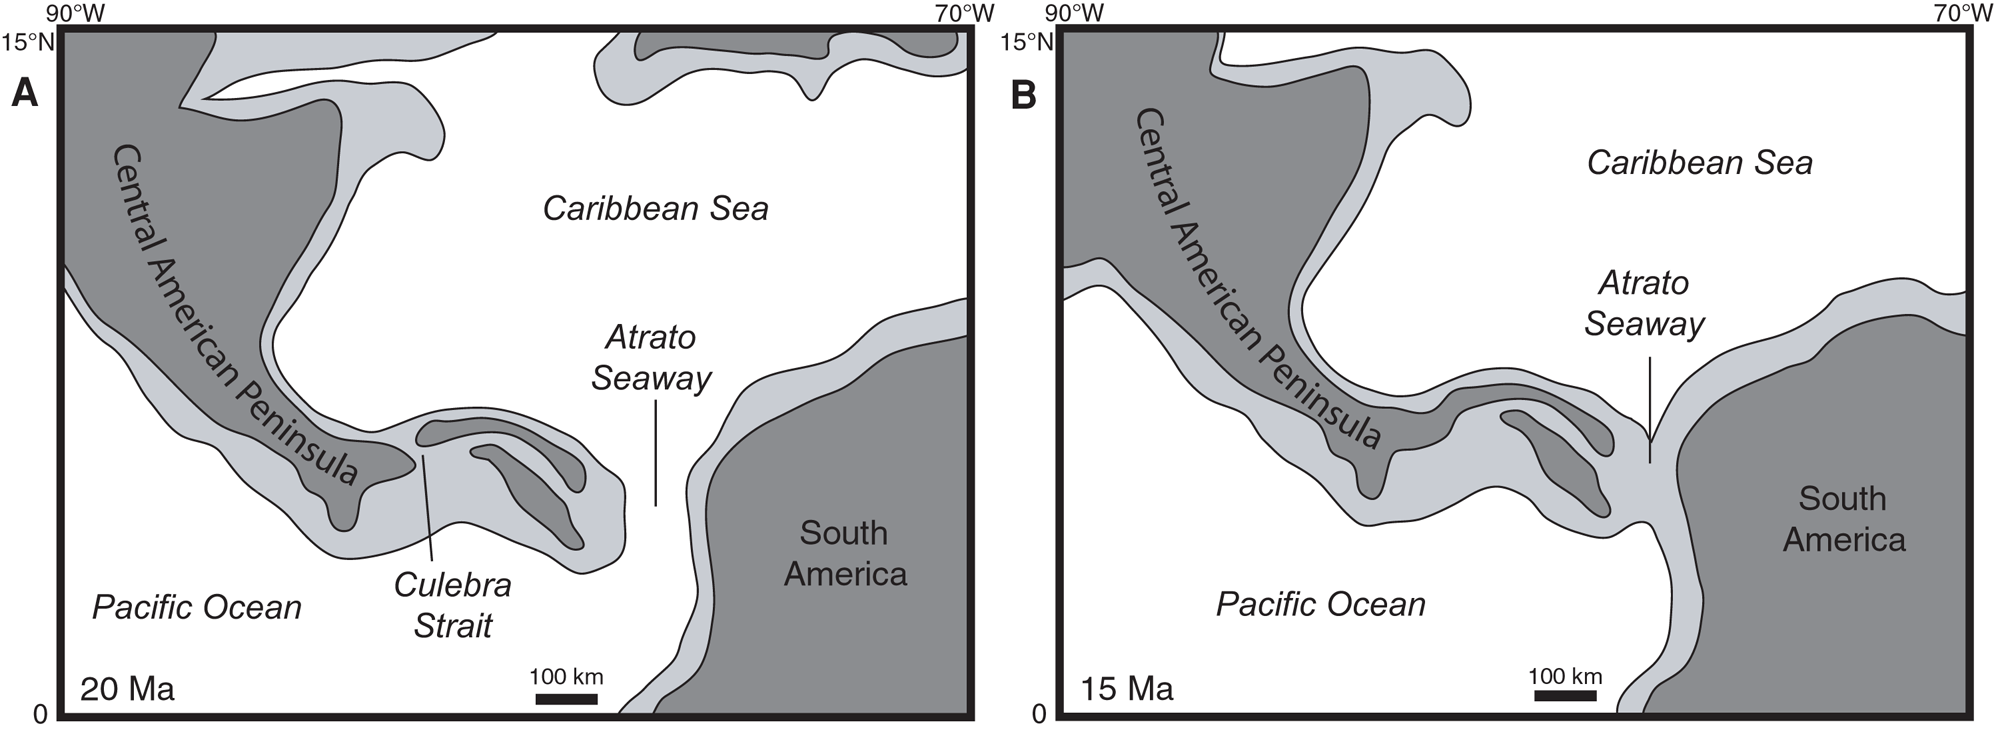
Maps showing the progressive closure of the Isthmus of Panama at 20 million years ago (A) and 15 million years ago (B). Dark gray is land, white and light gray are submerged areas. Modified from Figure 11 in Kirby et al. (2011) PLoS ONE 3(7): e2791 (Creative Commons Attribution license, image reorganized and resized).
Quaternary (2.6 million years ago to present)
Eventually, a sheet of sea ice formed over the Arctic, and ice sheets spread over northern Asia, Europe, and North America, signaling the start of the most recent ice age. Since 800,000 years ago, an equilibrium has been reached between warming and cooling, with the ice caps growing and retreating primarily due to the influence of astronomical forces (i.e., the combined gravitational effects of the Earth, Sun, moon, and planets).
The large ice sheets in the Northern Hemisphere did not extend into the Southwest, even at their maximum area. Large glaciers were found at higher elevations, and temperatures were cool. Fossil mammals adapted to colder temperatures are found in the Pleistocene of Colorado. In southern New Mexico, Pleistocene fossil mammals are found that now live at higher elevations in the mountains of northern New Mexico, indicating cooler temperatures and more available moisture in the area during the late Pleistocene.
Large lakes formed in low areas, and the Southwest’s most striking ice age feature was Lake Bonneville, a massive pluvial lake that covered much of Utah. Its remnant exists today as the Great Salt Lake. The last glacial advance of the modern ice age peaked some 18,000 years ago. Today nearly all the glaciers in the Southwest are gone, and the climate is in an arid state.
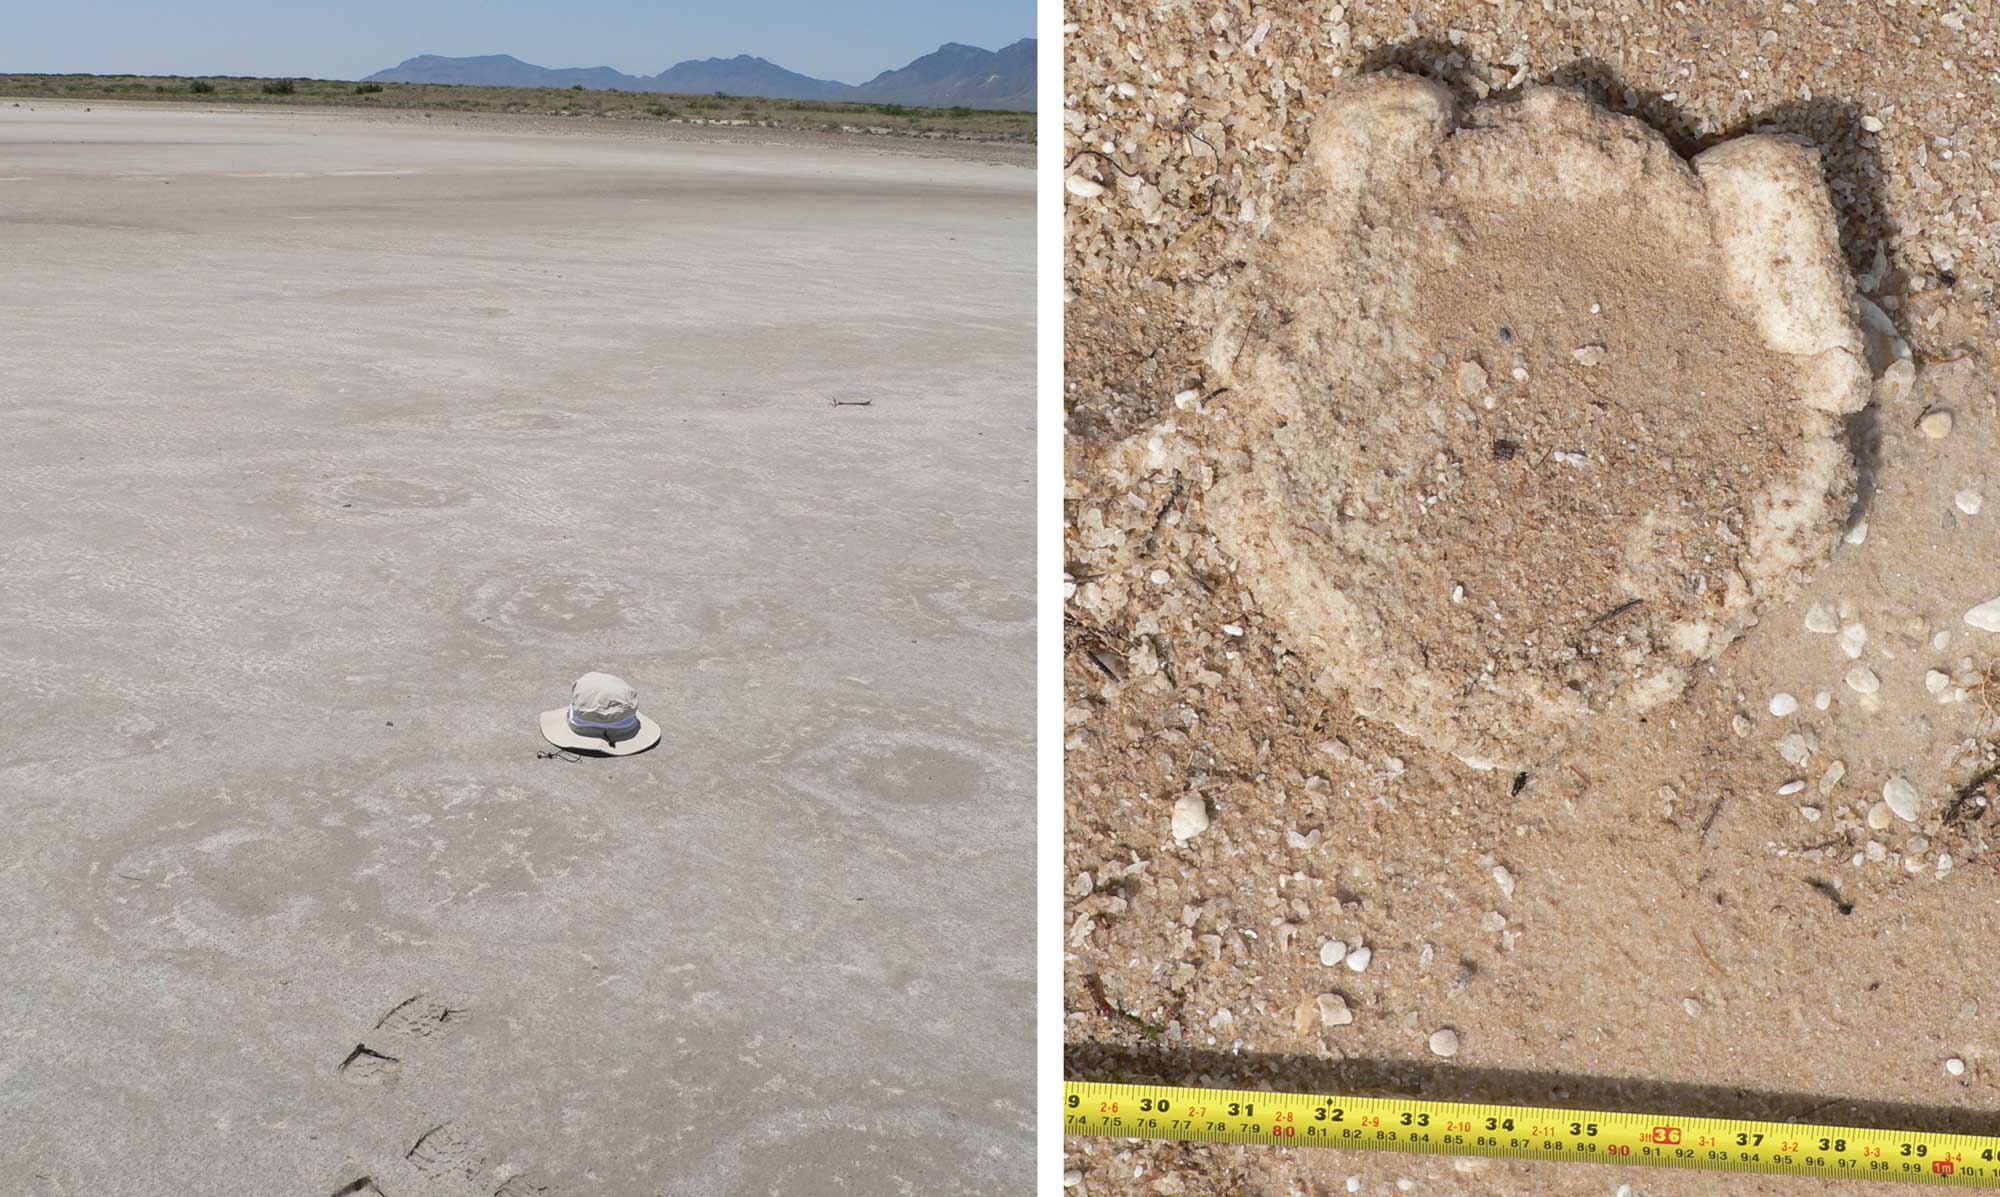
Columbian mammoth (Mammuthus columbi) tracks, Pleistocene, White Sands National Park, New Mexico. Left photo and right photo from NPS, courtesy David Bustos (public domain).
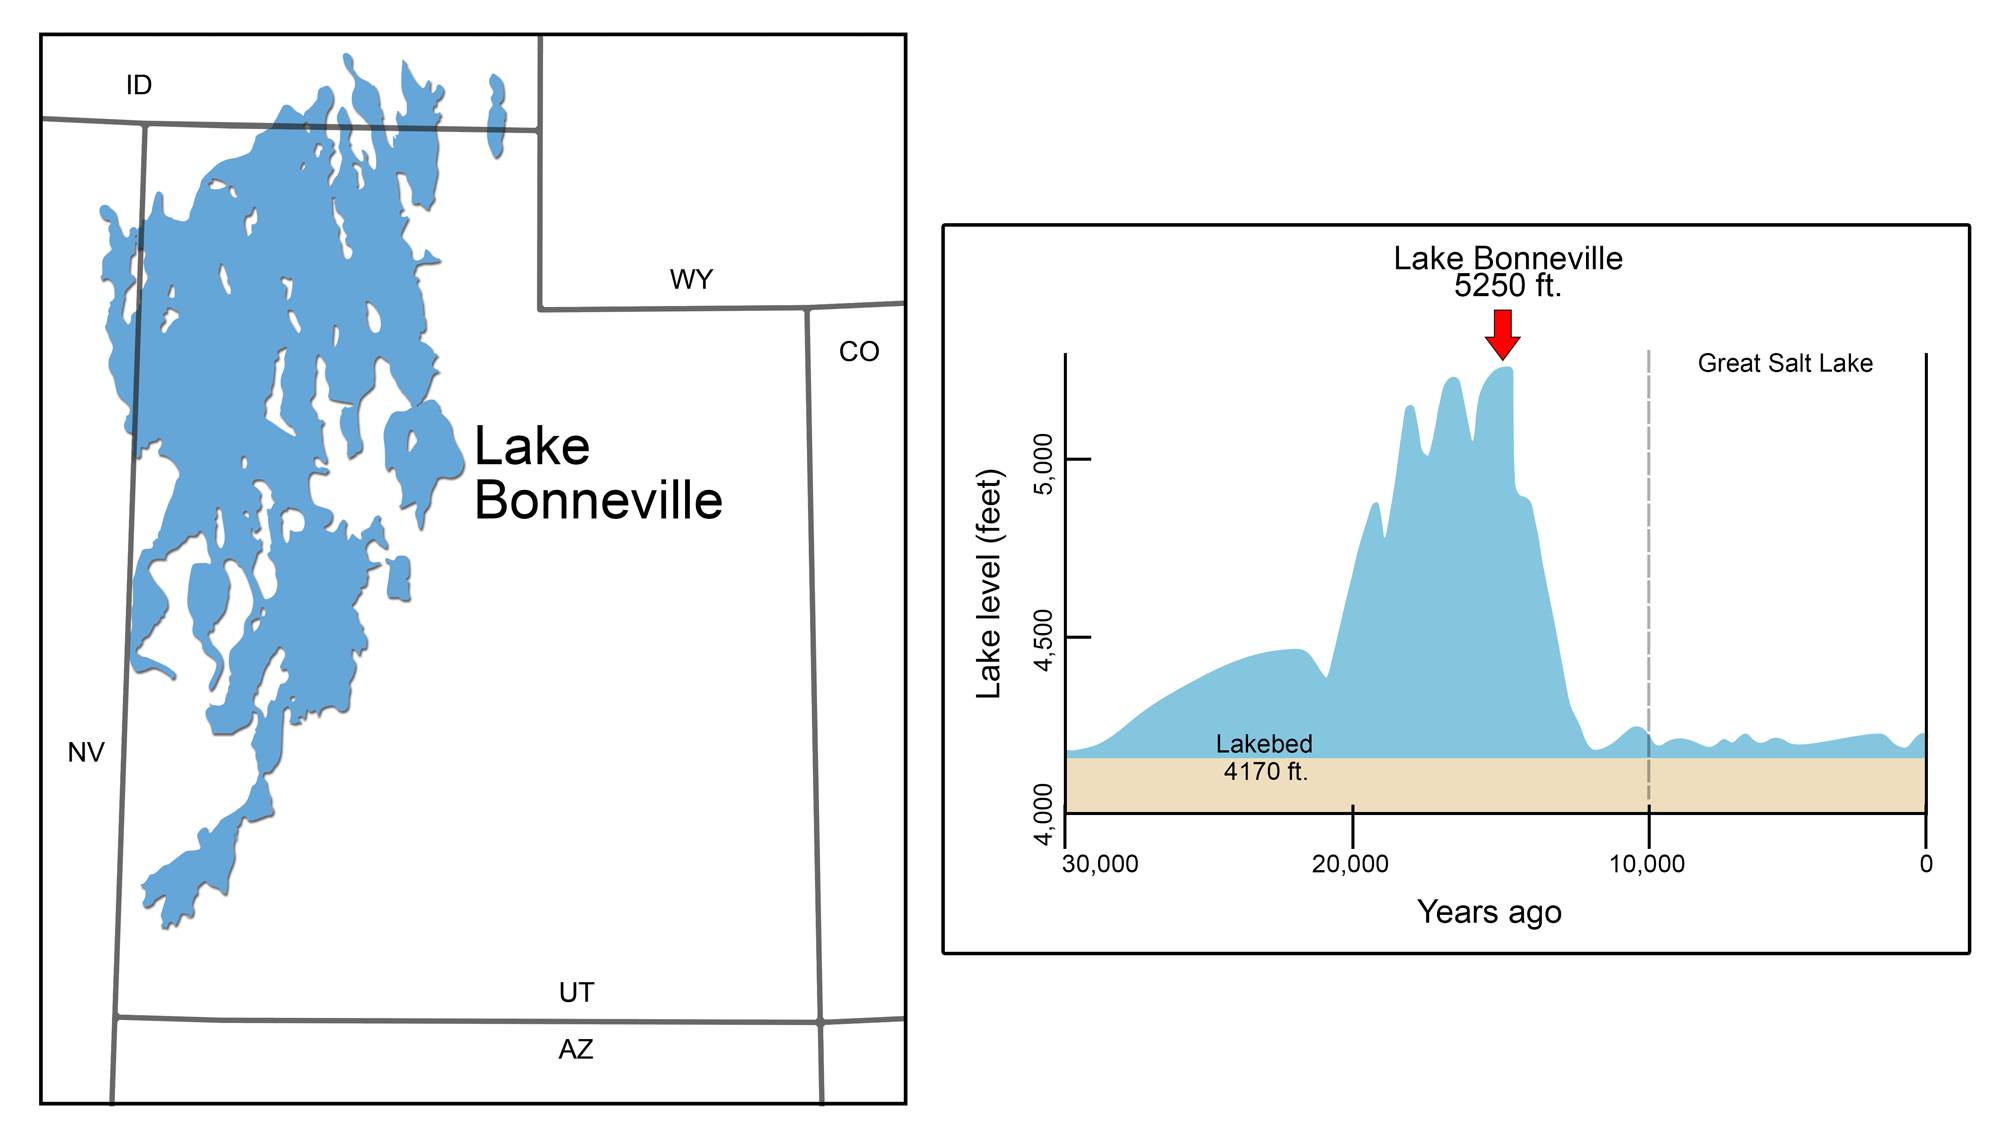
Pleistocene Lake Bonneville. Left: Lake Bonneville's maximal extent during the Pleistocene. Right: Graph of the lake's changing level over time. Modified from illustrations by Wade Greenberg-Brand originally published in The Teacher-Friendly Guide to the Earth Science of the Southwestern US.
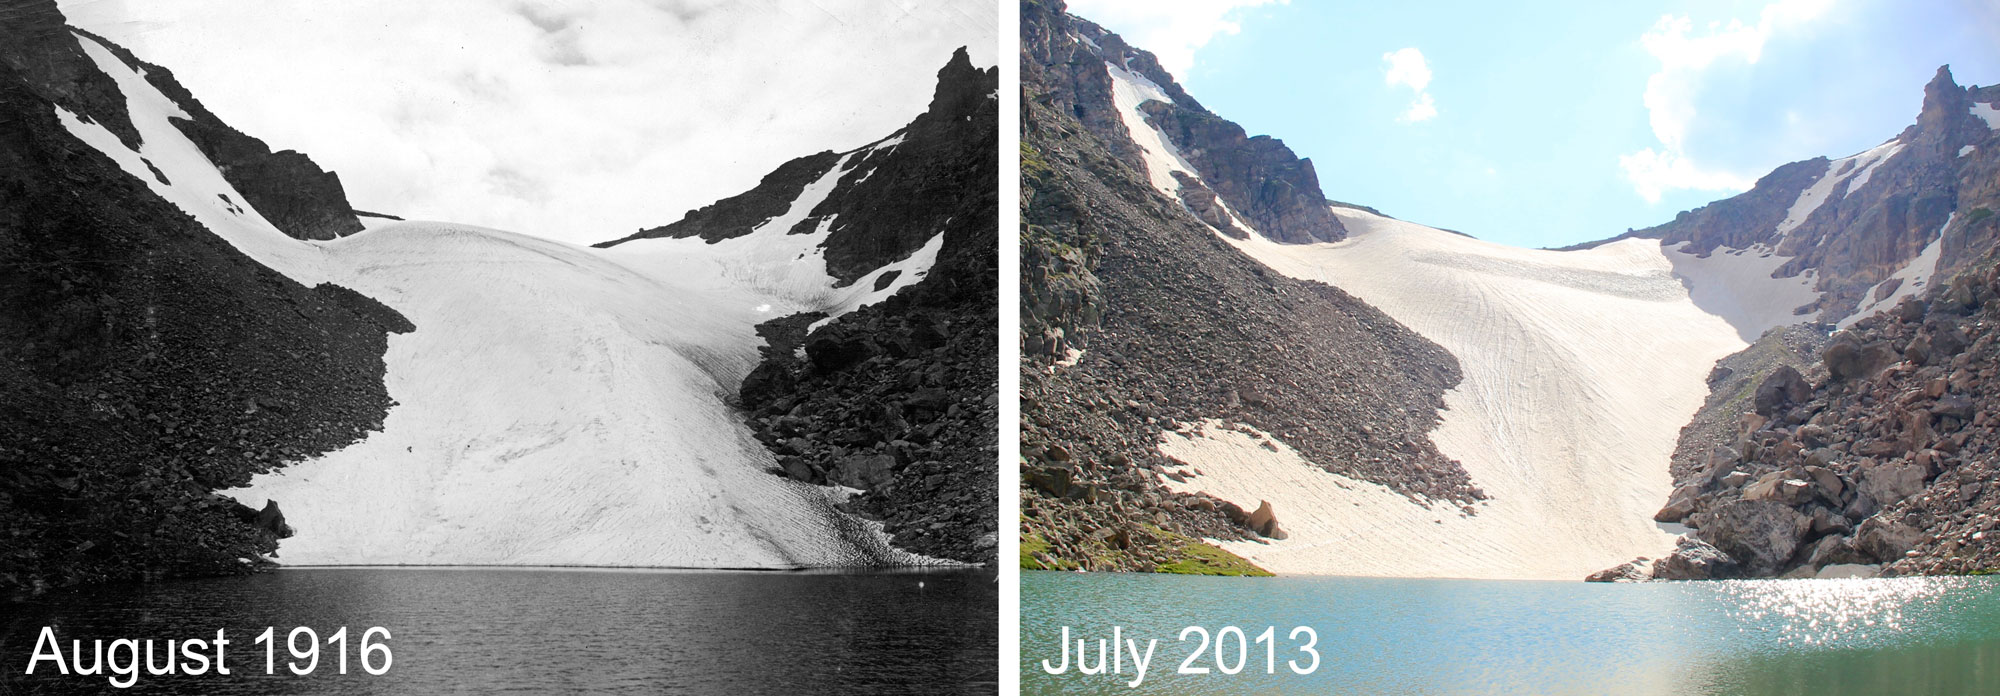
Andrews Glacier in Rocky Mountain National Park, Colorado, at two points in time. Glaciers in the Colorado Rockies are sustained largely by avalanches and wind-blown snow. In general, it is expected that high alpine glaciers in the Colorado Rockies will disappear as the climate continues to warm. Photo credits: 1916 photo from USGS (public domain), 2013 photo by daveynin (flickr, Creative Commons Attribution 2.0 Generic license, image resized).
Future climate of the southwestern U.S.
The Southwest contributes significantly to climate change. The population of any industrialized and particularly wealthy country produces pollution; the majority of these emissions come from the use of petroleum. The more than 16 million residents of the Southwest use carbon-rich fossil fuels to provide electricity for lighting, cooling, and appliances, to fuel their transportation and industry, and to make the products they use. Burning those fossil fuels releases carbon into the atmosphere, which warms the Earth.
Of the southwestern states, Arizona emits the most greenhouse gases, releasing 92.5 million metric tons of energy-related carbon dioxide (CO2) in 2019. Carbon dioxide emissions in Arizona rose through the last three decades of the 20th century and reached a peak in 2008. Since then carbon dioxide emissions have been on a downward trend. This may be due to the growth of solar energy, and voluntary commitments to reduce emissions made by large utility companies in the state.
New Mexico, Utah, and Colorado have also reduced their carbon dioxide emissions between 2008 and 2019. The cities of Aspen and Lafayette, Colorado, as well as the state of New Mexico, were early adopters of the 2030 Challenge, an effort to reduce fossil fuel use in buildings so that both new and renovated buildings would qualify as carbon neutral by the year 2030. Southwestern states are stepping up their use and production of renewable energy. In 2020, Colorado ranked 7th in the nation for solar and wind power production, and Arizona and New Mexico ranked 12th and 13th, respectively.
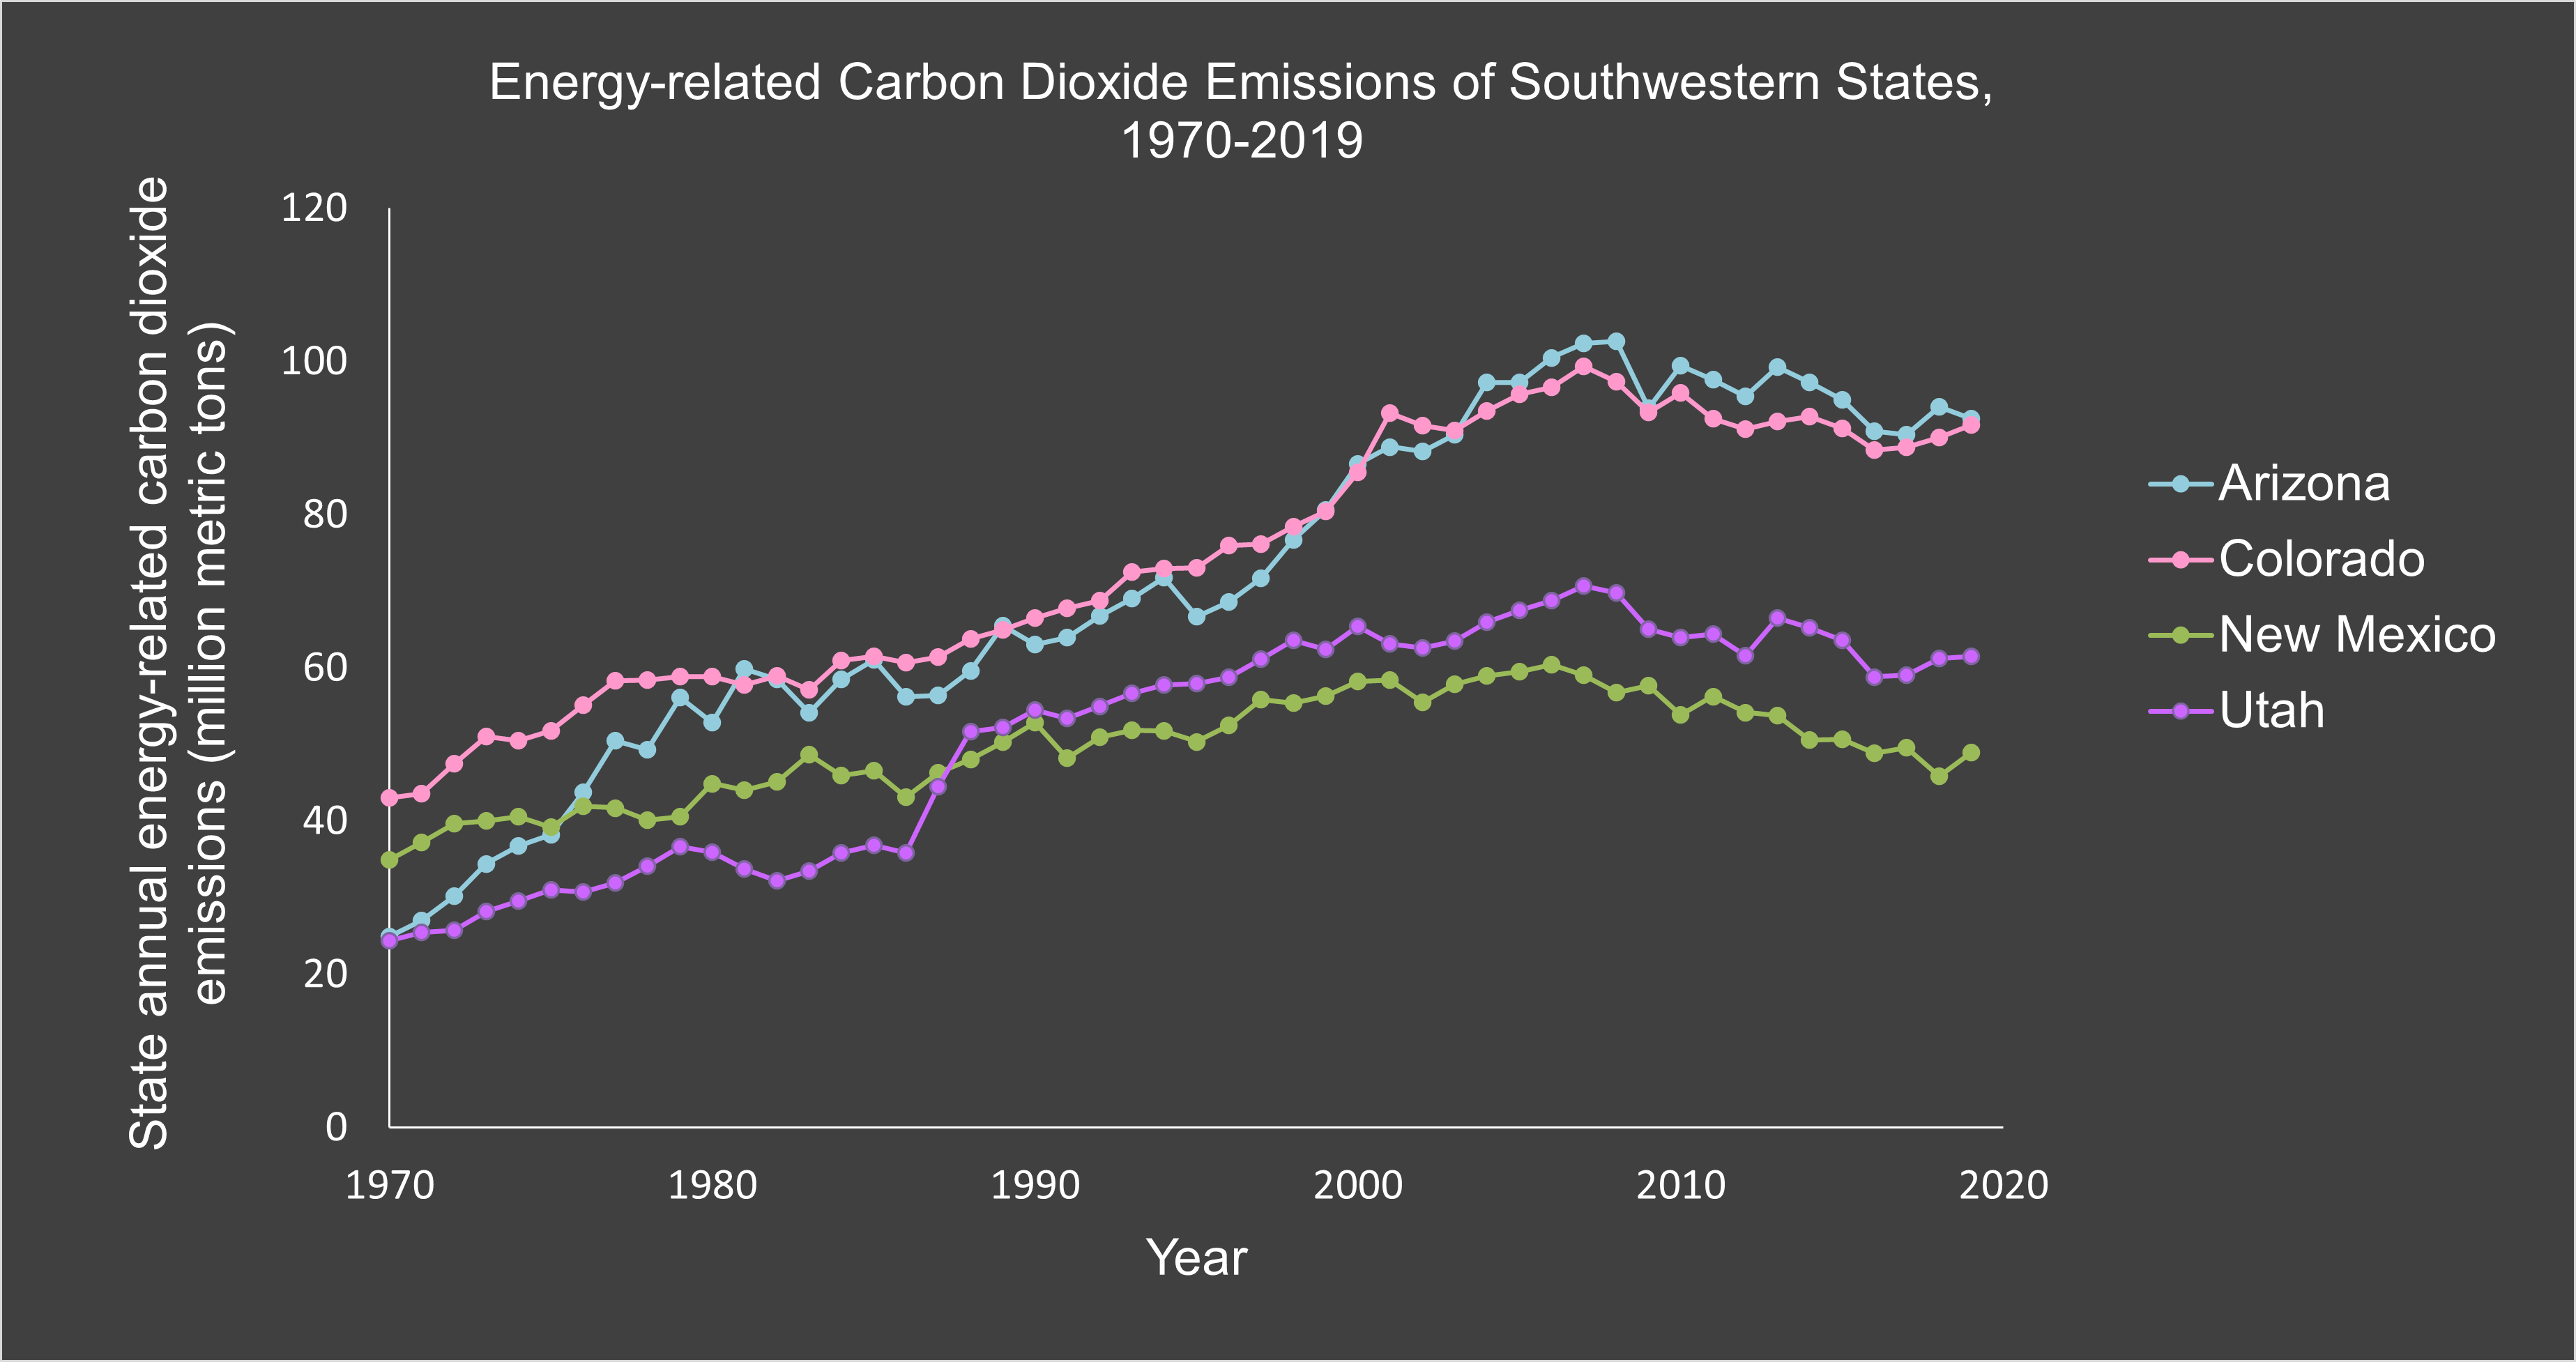
Time-series graph of energy-related carbon dioxide emissions from southwestern states, showing rising emissions from 1970 to around 2008, followed by a decreasing trend from 2008 to 2019. Data: U.S. Energy Information Administration. Figure by Ingrid Zabel for PRI's Earth@Home project (CC BY-NC-SA 4.0 license),
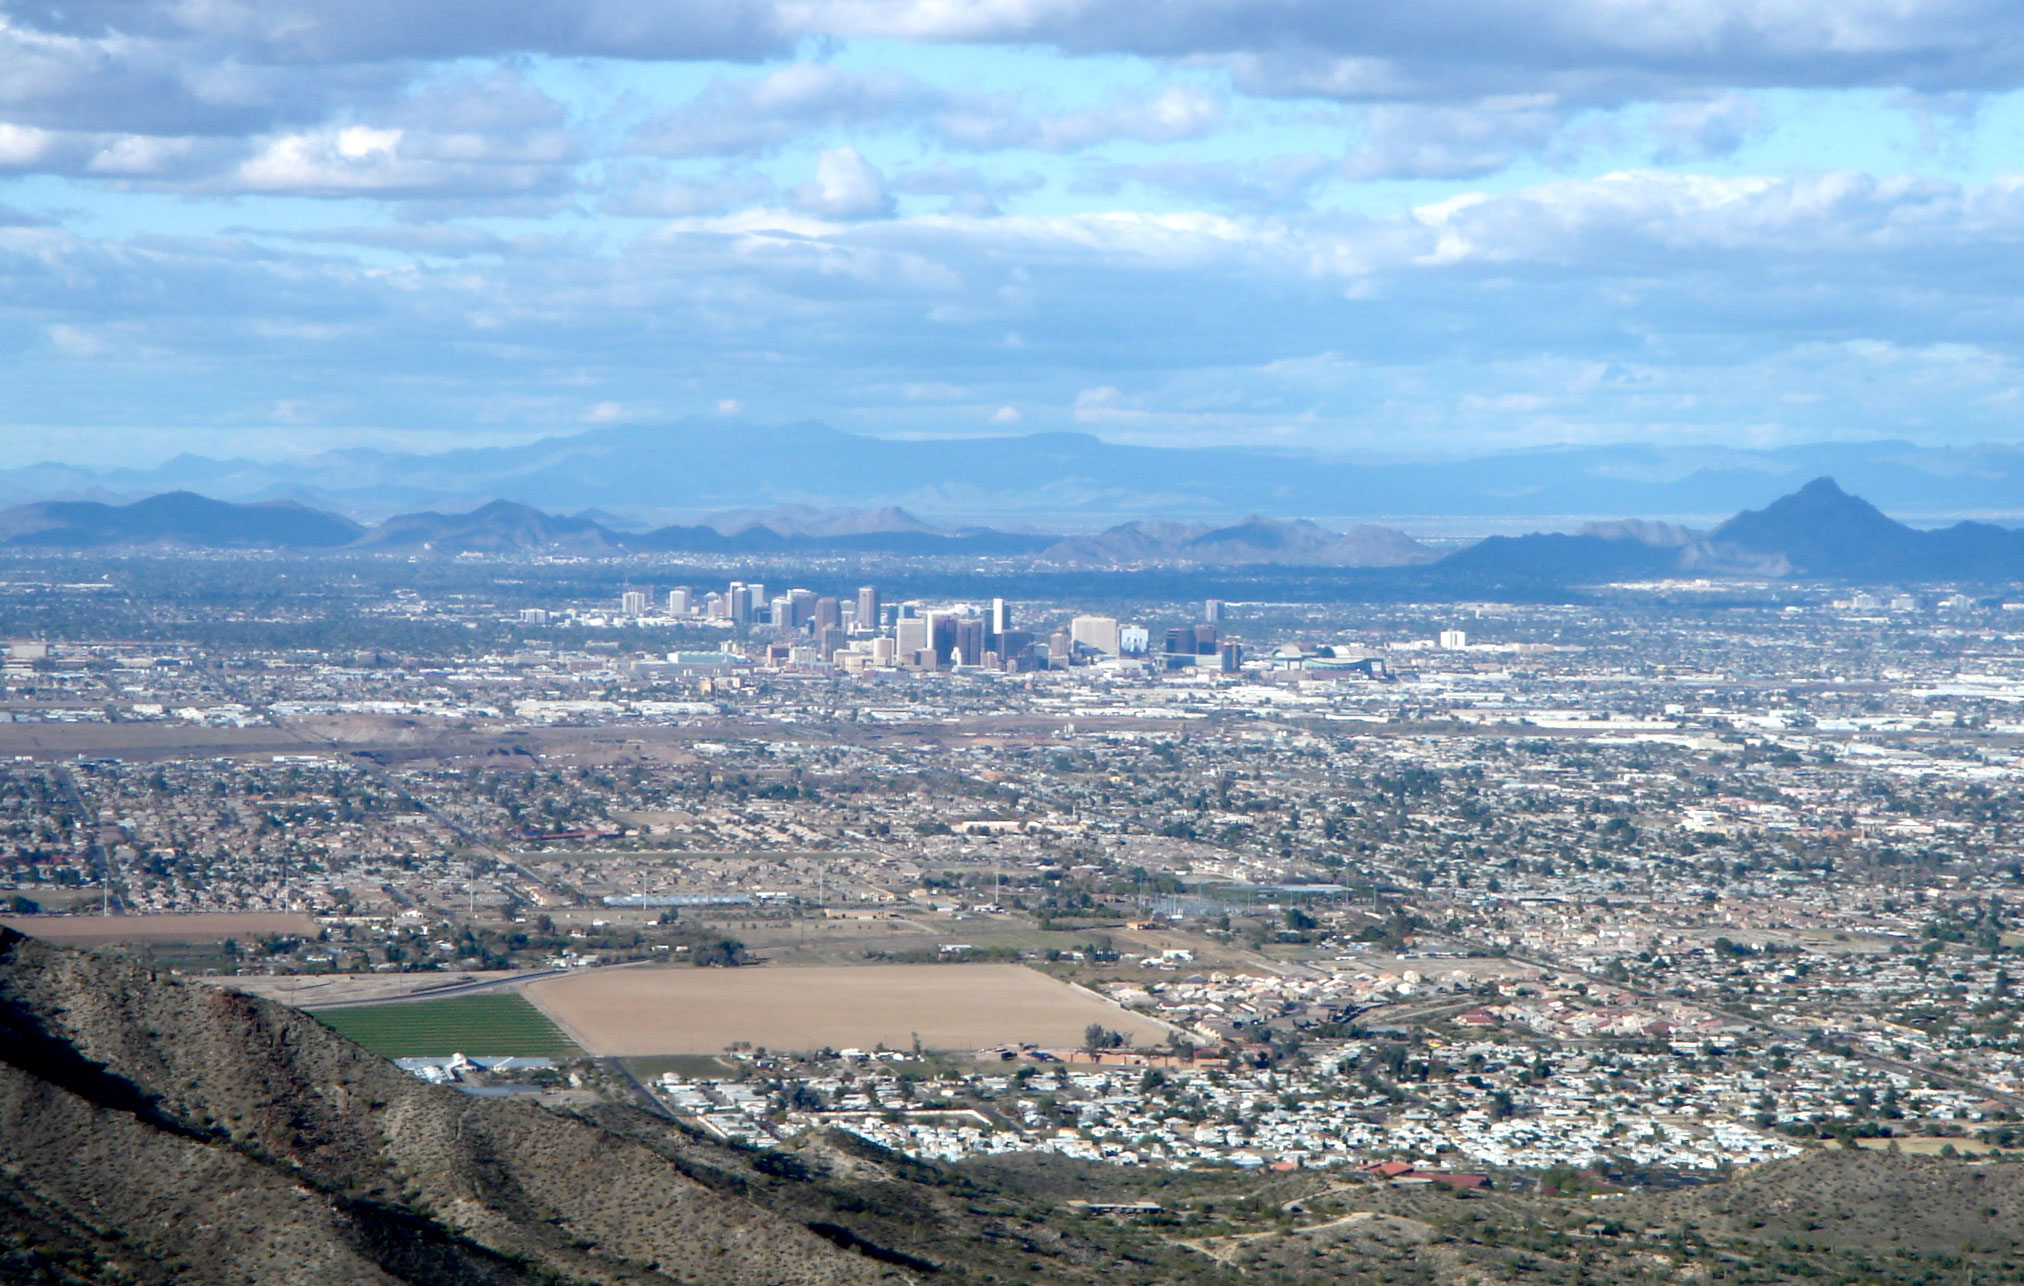
Sprawling development of Phoenix, Arizona, a city in the Sonoran Desert, 2009. Photo by Bigmikebmw (Wikimedia Commons, Creative Commons Attribution-ShareAlike 3.0 Unported license, image cropped).
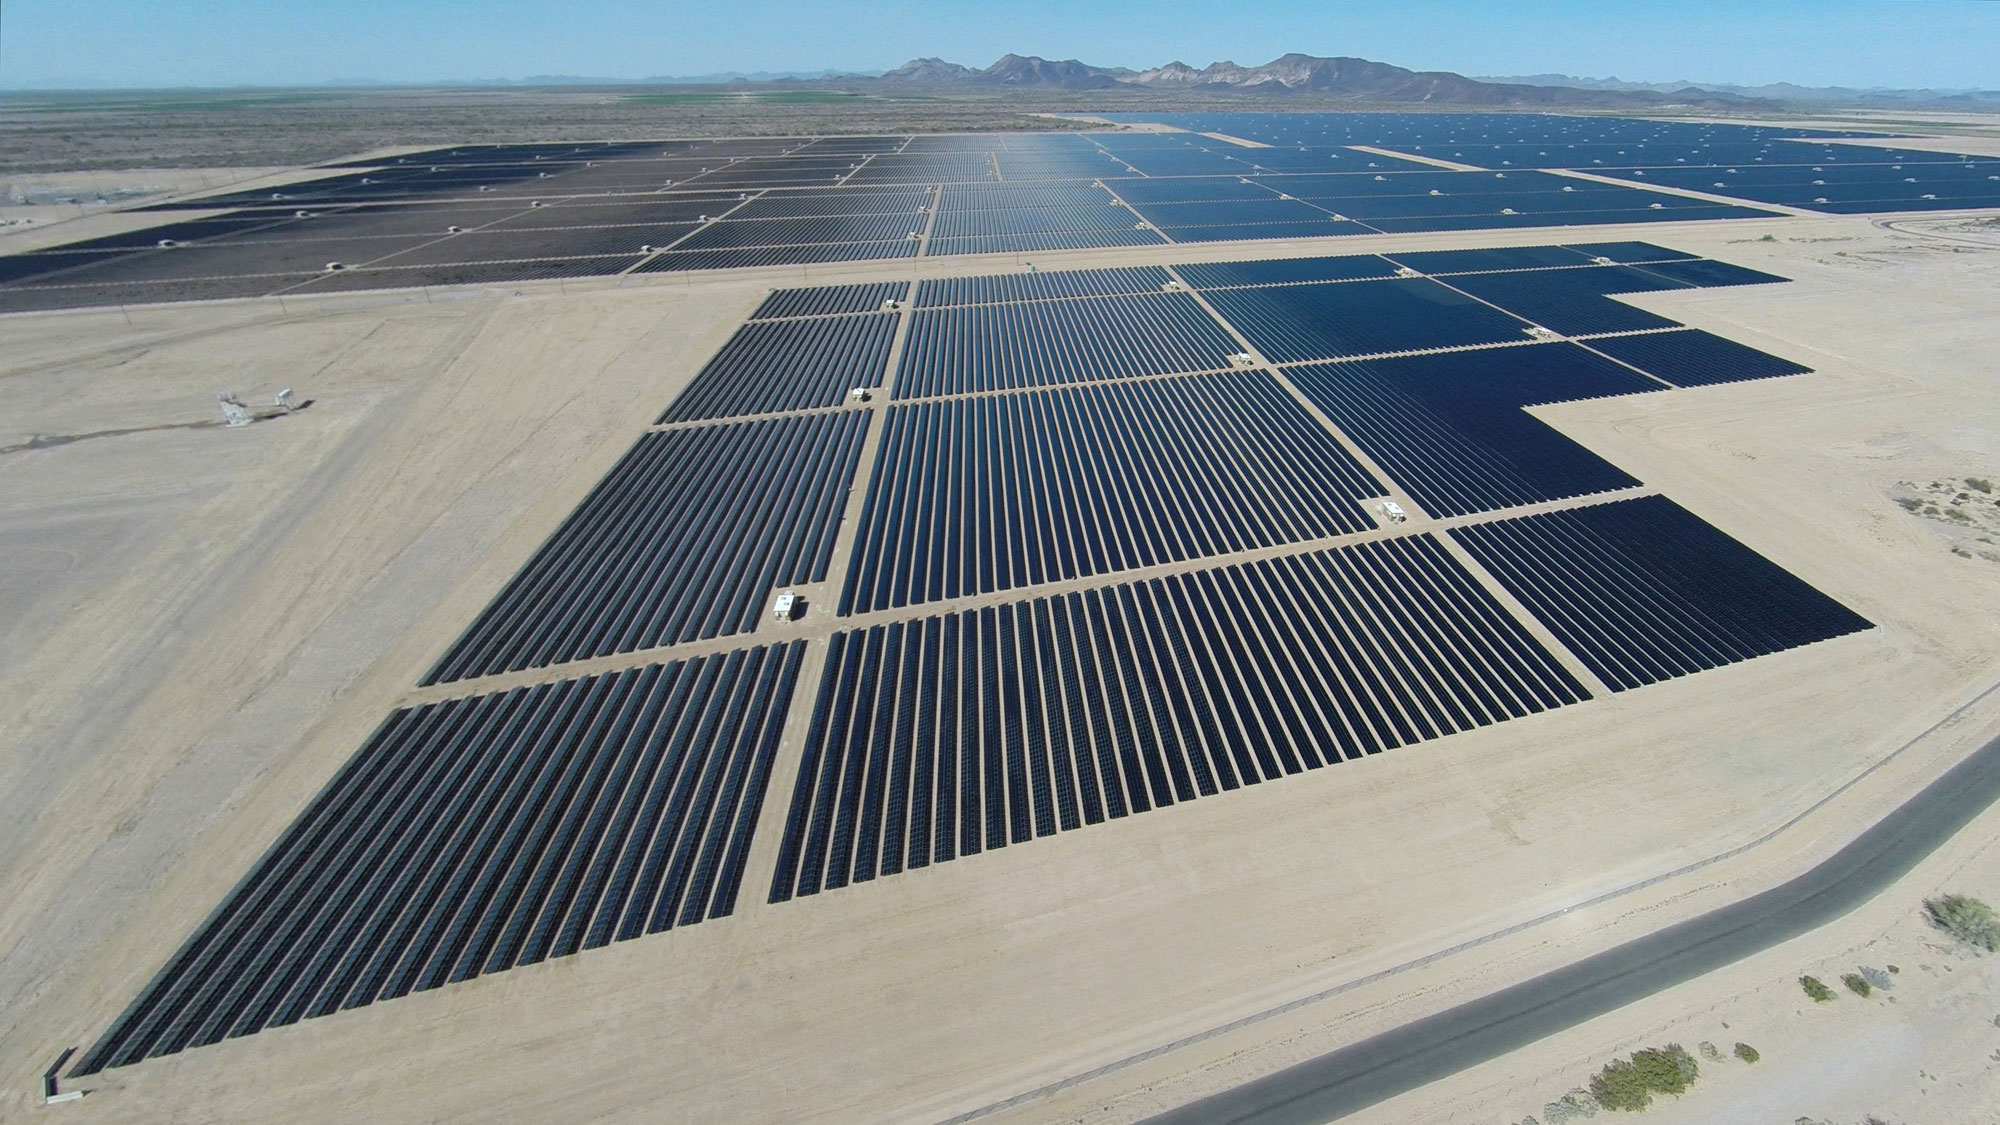
Agua Caliente solar farm, Maricopa County, Arizona. Photo by Center for Land Use Interpretation (Creative Commons Attribution-Noncommercial-ShareAlike 3.0 license, image resized).
Trends and predictions
Studies show that the southwestern states' climate is changing right now and that change has accelerated in the latter part of the 20th century. These changes include the following:
- The number of days with temperatures above 35°C (95°F) and nights above 24°C (75°F) has been steadily increasing since 1970, and the warming is projected to continue.
- The onset of stream flows from melting snow in Colorado has shifted two weeks earlier due to warming spring temperatures. Flows in late summer are correspondingly reduced, leading to extra pressure on the state’s water supplies.
- Streamflow totals for the decade of 2001-2010 in the Great Basin, Rio Grande, and Colorado River were between 5% and 37% lower than their 20th century averages.
- Since 1980, tree mortality in forests and woodlands across the Southwest has been higher and more extensive than at any time during the previous 90 years. This mortality is attributed to higher temperatures, drought, and the eruption of bark beetles that are able to survive through warmer winter weather.
- Increased heat in the Pacific Ocean has altered the weather patterns of Pacific storms, decreasing snowfall in the mountains of western Utah and Arizona.
-
The seasonality and transmission frequency of insect-borne diseases and other infectious diseases prevalent in the Southwest, including plague, valley fever, and Hanta, are influenced by warming trends.
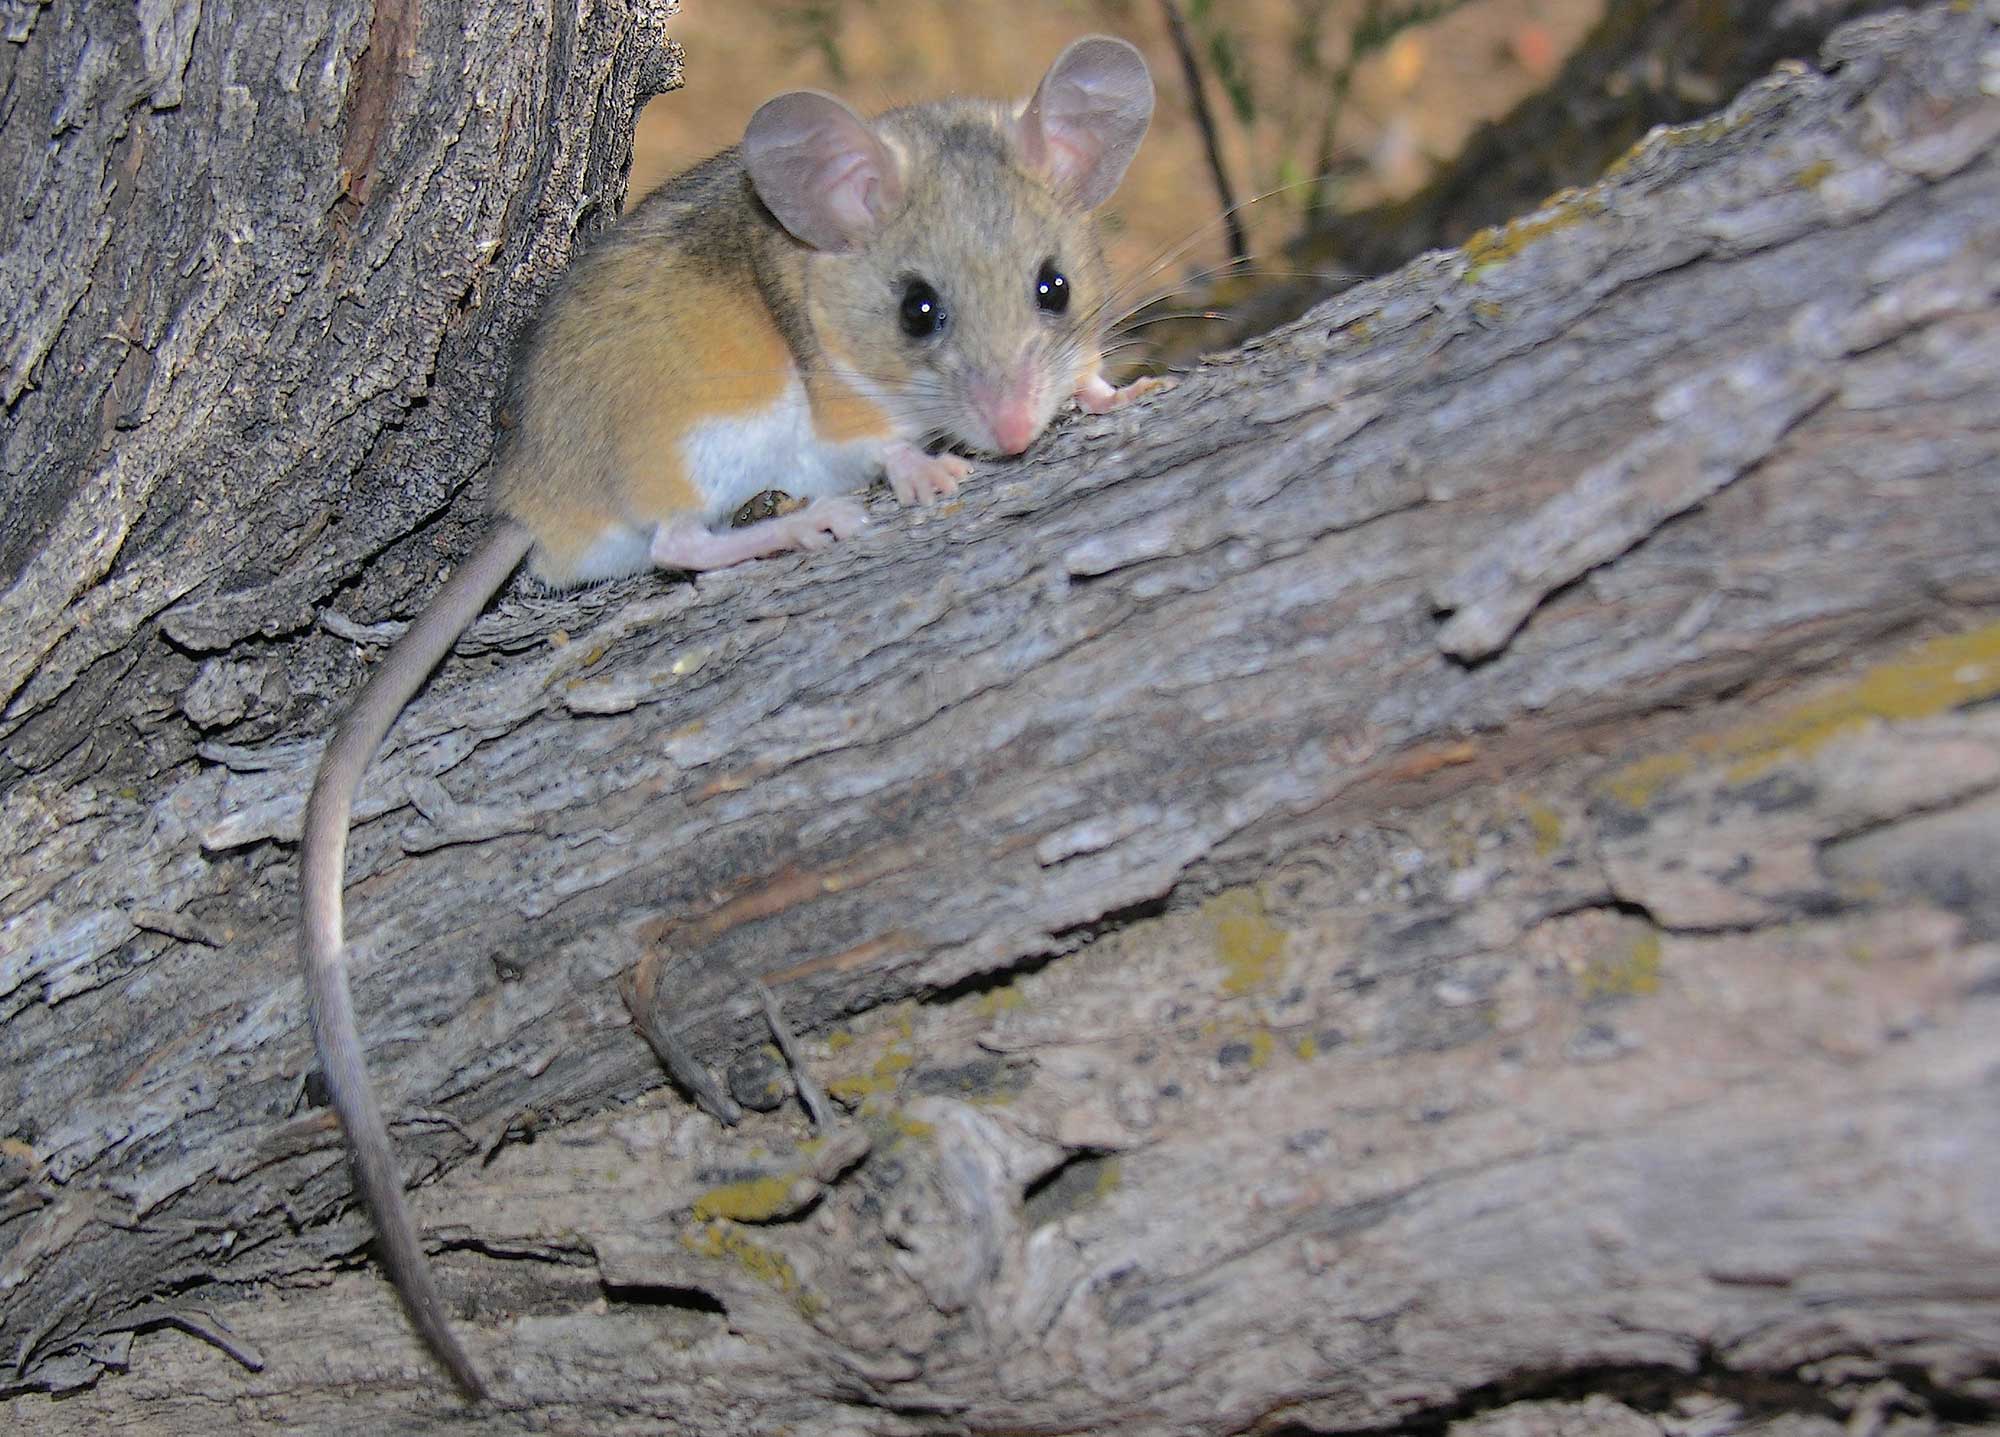
A deer mouse (Peromyscus maniculatus) in Portal, Arizona, 2004. Deer mice are the most important rodent carriers of hantavirus in the Southwest. Photo by Gregory Smith (flickr, Creative Commons Attribution-ShareAlike 2.0 Generic license, image cropped and resized).
Future temperature
Recent warming within the Southwest has been among the most rapid in the United States, and models predict that the area's climate will continue to warm. The average annual temperature in most of the Southwest is predicted to rise 2.2° to 5.5°C (4° to 10°F) by 2100. Summer heat waves will become hotter and longer, while winter cold snaps will occur less often. These increased temperatures lead to a whole host of other effects, including a decrease in snowpack, declines in river flow, drier soils from more evaporation, and the increased likelihood of drought and fires.
In winter, rising temperatures have increased the number of frost-free days. Today, most of the Southwest experiences about 17 fewer freezing days than it did over the last century. By 2070, one can expect up to 38 more days of freeze-free weather each year. These warmer temperatures and increased precipitation have helped bring on longer growing seasons. While changes in the growing season can have a positive effect on some crops (such as melons and sweet potatoes), altered flowering patterns due to more frost-free days can lead to early bud bursts, damaging perennial crops such as nuts and stone fruits.
Warmer temperatures also make it easier for insect pests to overwinter and produce more generations. Bark beetles, which normally die in cold weather, have been able to survive through the winter and reproduce, increasing tree mortality. For example, high winter temperatures between 2000 and 2003 correlated to bark beetle outbreaks that devastated pinyon pine throughout the Southwest, leading to nearly 90% mortality at some sites in Colorado and Arizona. As of 2010, bark beetles in Arizona and New Mexico have affected more than twice the forest area burned by wildfires in those states.
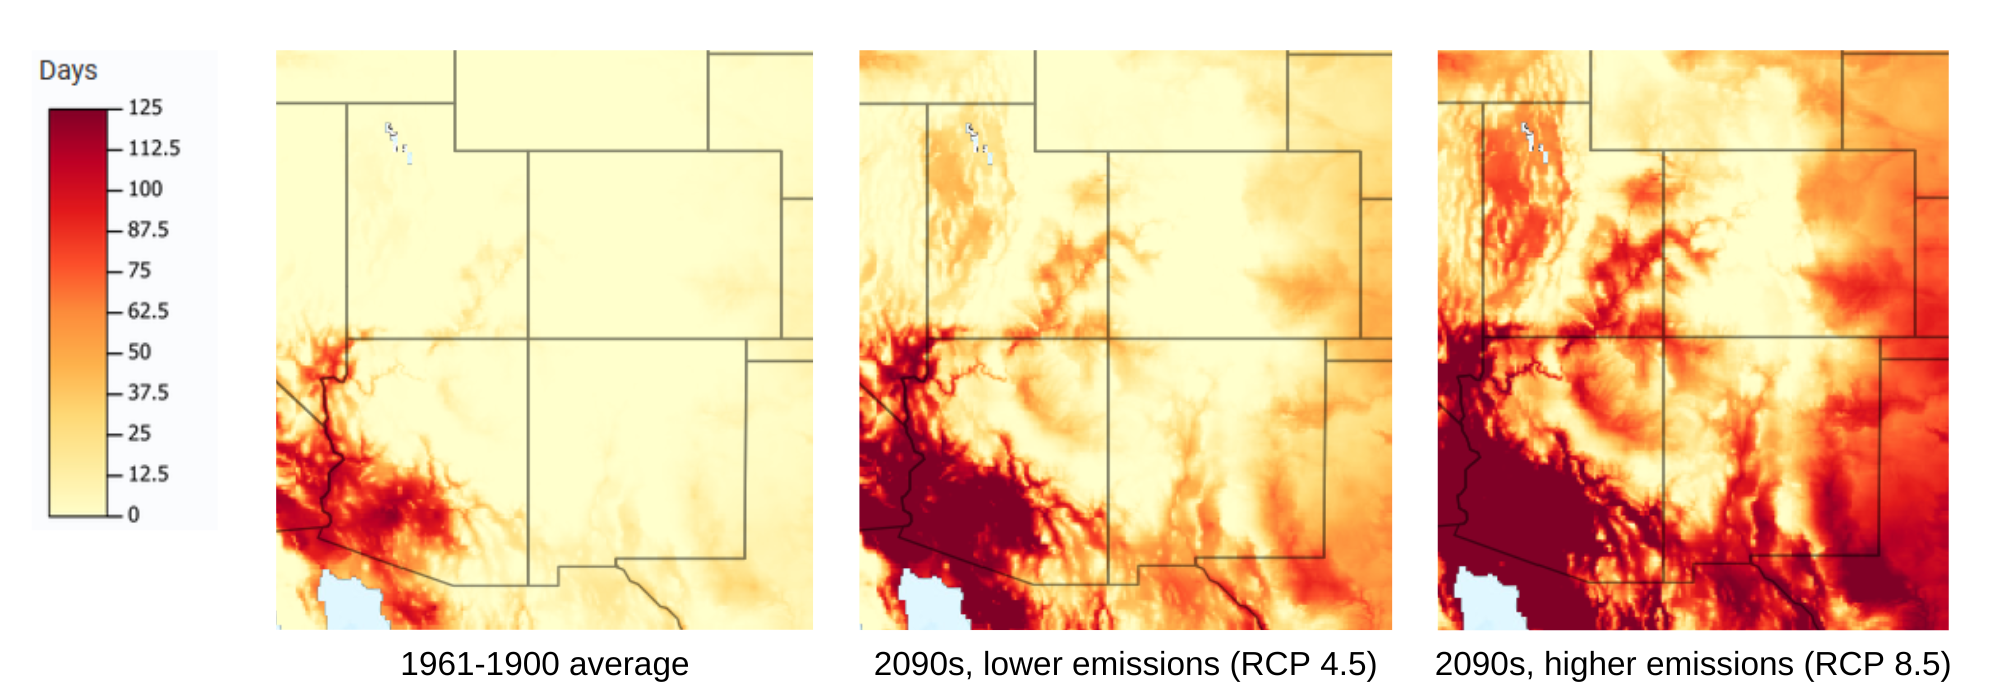
Maps of the number of days per year with maximum temperature reaching over 100°F. Left map: data showing the average over the period 1961-1990. Most counties in southwestern states had fewer than 20 days per year of extreme heat, except for southwestern Arizona. Center and right maps: future projections for the end of the 21st century (the 2090s) from climate models; the center map is for a lower greenhouse gas emissions scenario and the right map is for a higher greenhouse gas emissions scenario. The projections show many more extremely hot days per year, with large portions of the region potentially having around 80 to 120 days per year with temperatures over 100°F, in the higher emissions scenario. Maps are from The Climate Explorer, U.S. Climate Resilience Toolkit, accessed May 23, 2023.
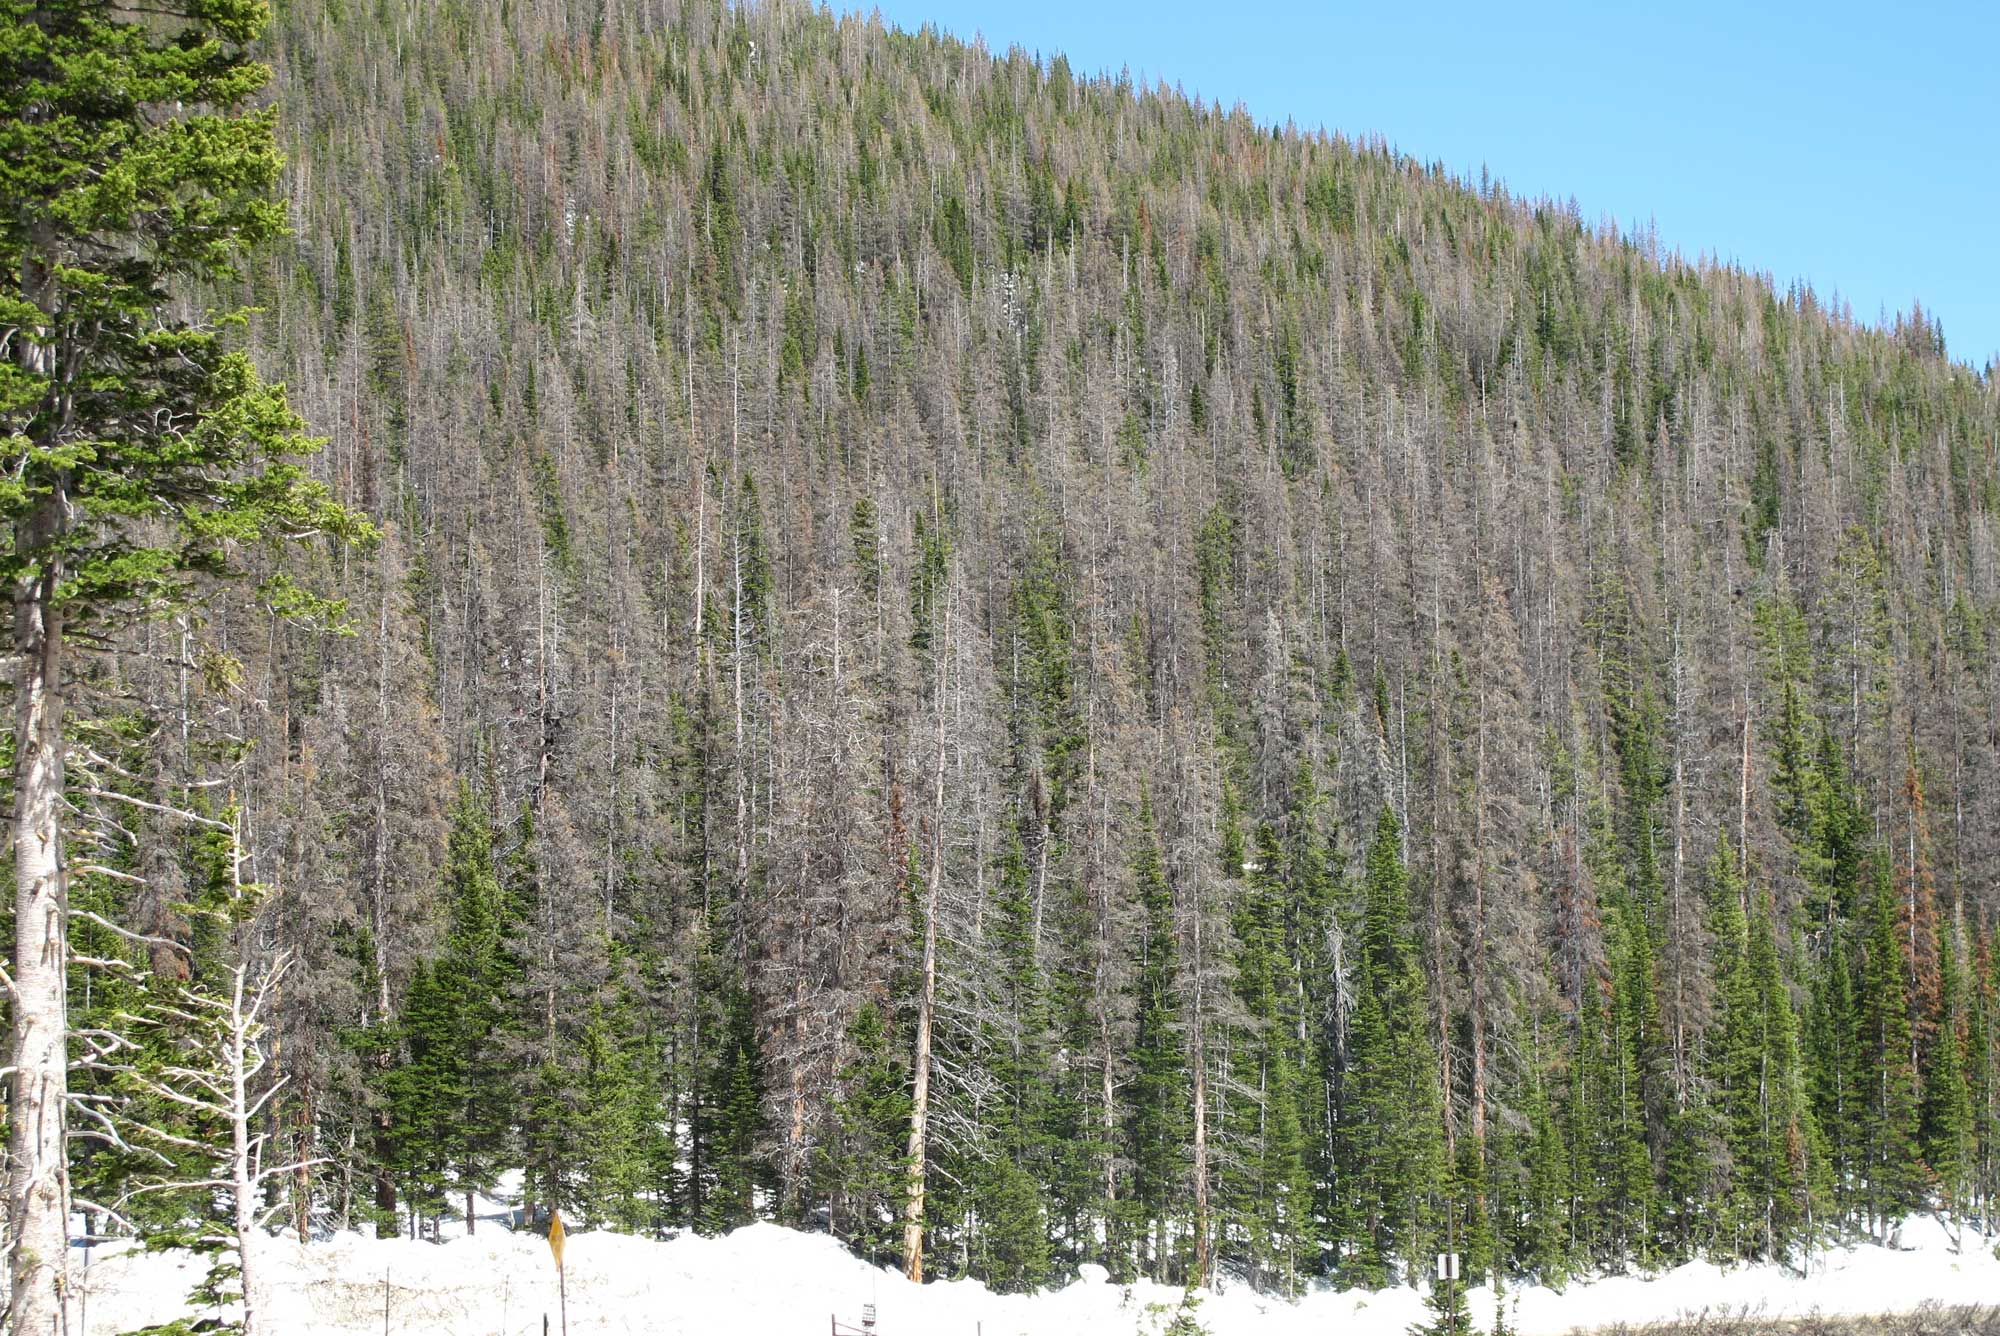
Trees killed by bark beetles at Cameron Pass, Colorado, 2011. Photo by Dr. David Goodrich, NOAA (NOAA Photo Library ID wea04192, NOAA's National Weather Service, via flickr, Creative Commons Attribution 2.0 Generic license, image cropped and resized).
Future precipitation and water supply
Water supply is an important issue in the Southwest, and communities will need to adapt to changes in precipitation, snowmelt, and runoff as the climate changes. Agriculture accounts for more than half of the Southwest’s water use, so any major reduction in the availability of water resources will create a serious strain on ecosystems and populations. Drier days and higher temperatures will amplify evaporation, increasing the desertification of already arid areas and affecting natural ecosystems as well as increasing pressure on the water supply for agriculture and cities. An increased frost-free season length also leads to increased water demands for agriculture and heat stress on plants.
Cattle ranches throughout the southwestern states rely on rain-fed grazing forage, making them extremely susceptible to climate change and drought. In addition, temperature increases and recent drought have resulted in earlier spring snowmelt and decreased snow cover on the lower slopes of high mountains, bringing about more rapid runoff and increased flooding. These changes to rain and snow-pack are already stressing water sources and affecting agriculture.
Precipitation has become more variable from year to year, and heavy downpours across the U.S. have increased in the last 20 years. Because higher temperatures mean greater evaporation and warmer air can hold more water, precipitation events are becoming more extreme. Although there has so far been little regional change in the Southwest’s annual precipitation, the area’s average precipitation is expected to decrease in the south and remain stable or increase in the north. Most models predict a decrease in winter and spring precipitation by the middle of the century, and more frequent precipitation extremes during the last half of the century.
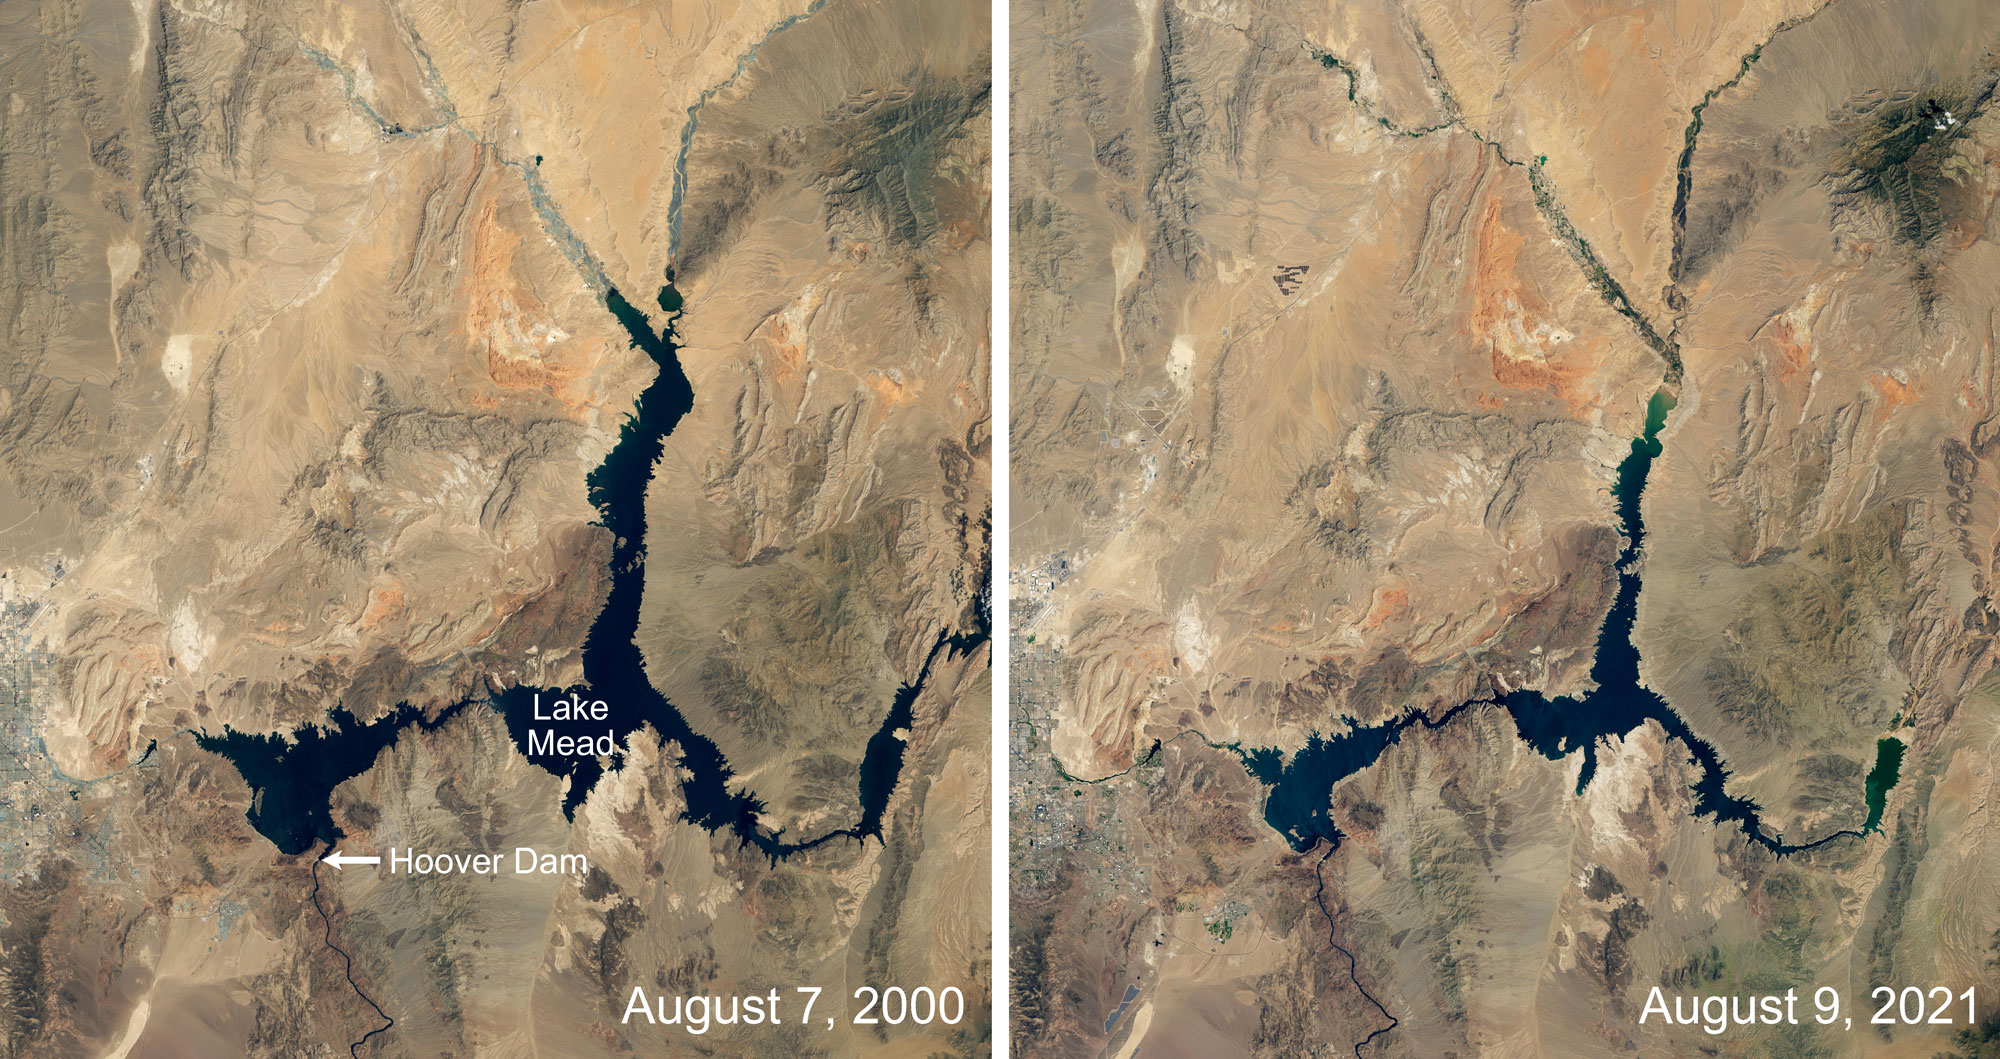
Lake Mead, the lake created by the Hoover Dam, at two points in time about 21 years apart. Images by Lauren Dauphin, NASA Earth Observatory (used following NASA's image use policy).
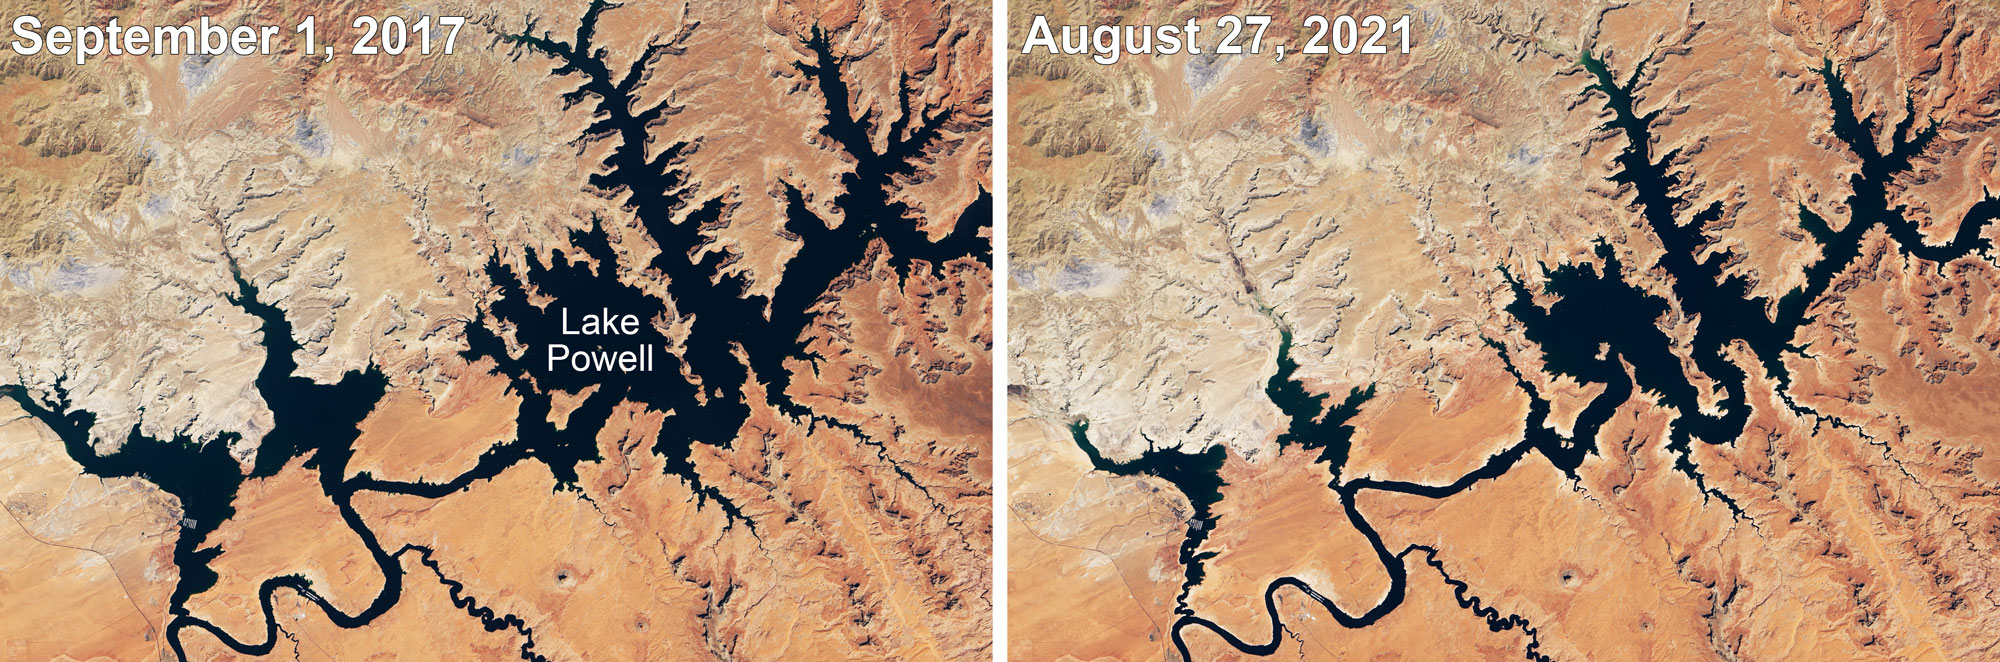
Lake Powell, the lake created by Glen Canyon Dam, at two points in time about four years apart. Photos by Lauren Dauphin, NASA Earth Observatory (used following NASA's image use policy).
Future severe weather events
The causes of specific weather events such as tornadoes and severe thunderstorms are incredibly complex, although climate change has enhanced some correlated factors, such as increased wind speed and an unstable atmosphere. Higher atmospheric moisture content has also been correlated with an increased incidence of tornadoes and winter storms. However, although climate change is predicted to enhance the intensity of severe weather, there is currently no way to calculate what effect climate change will have on the frequency of specific storm events—for example, we might see more powerful tornadoes, but we do not know if we will see more of them.
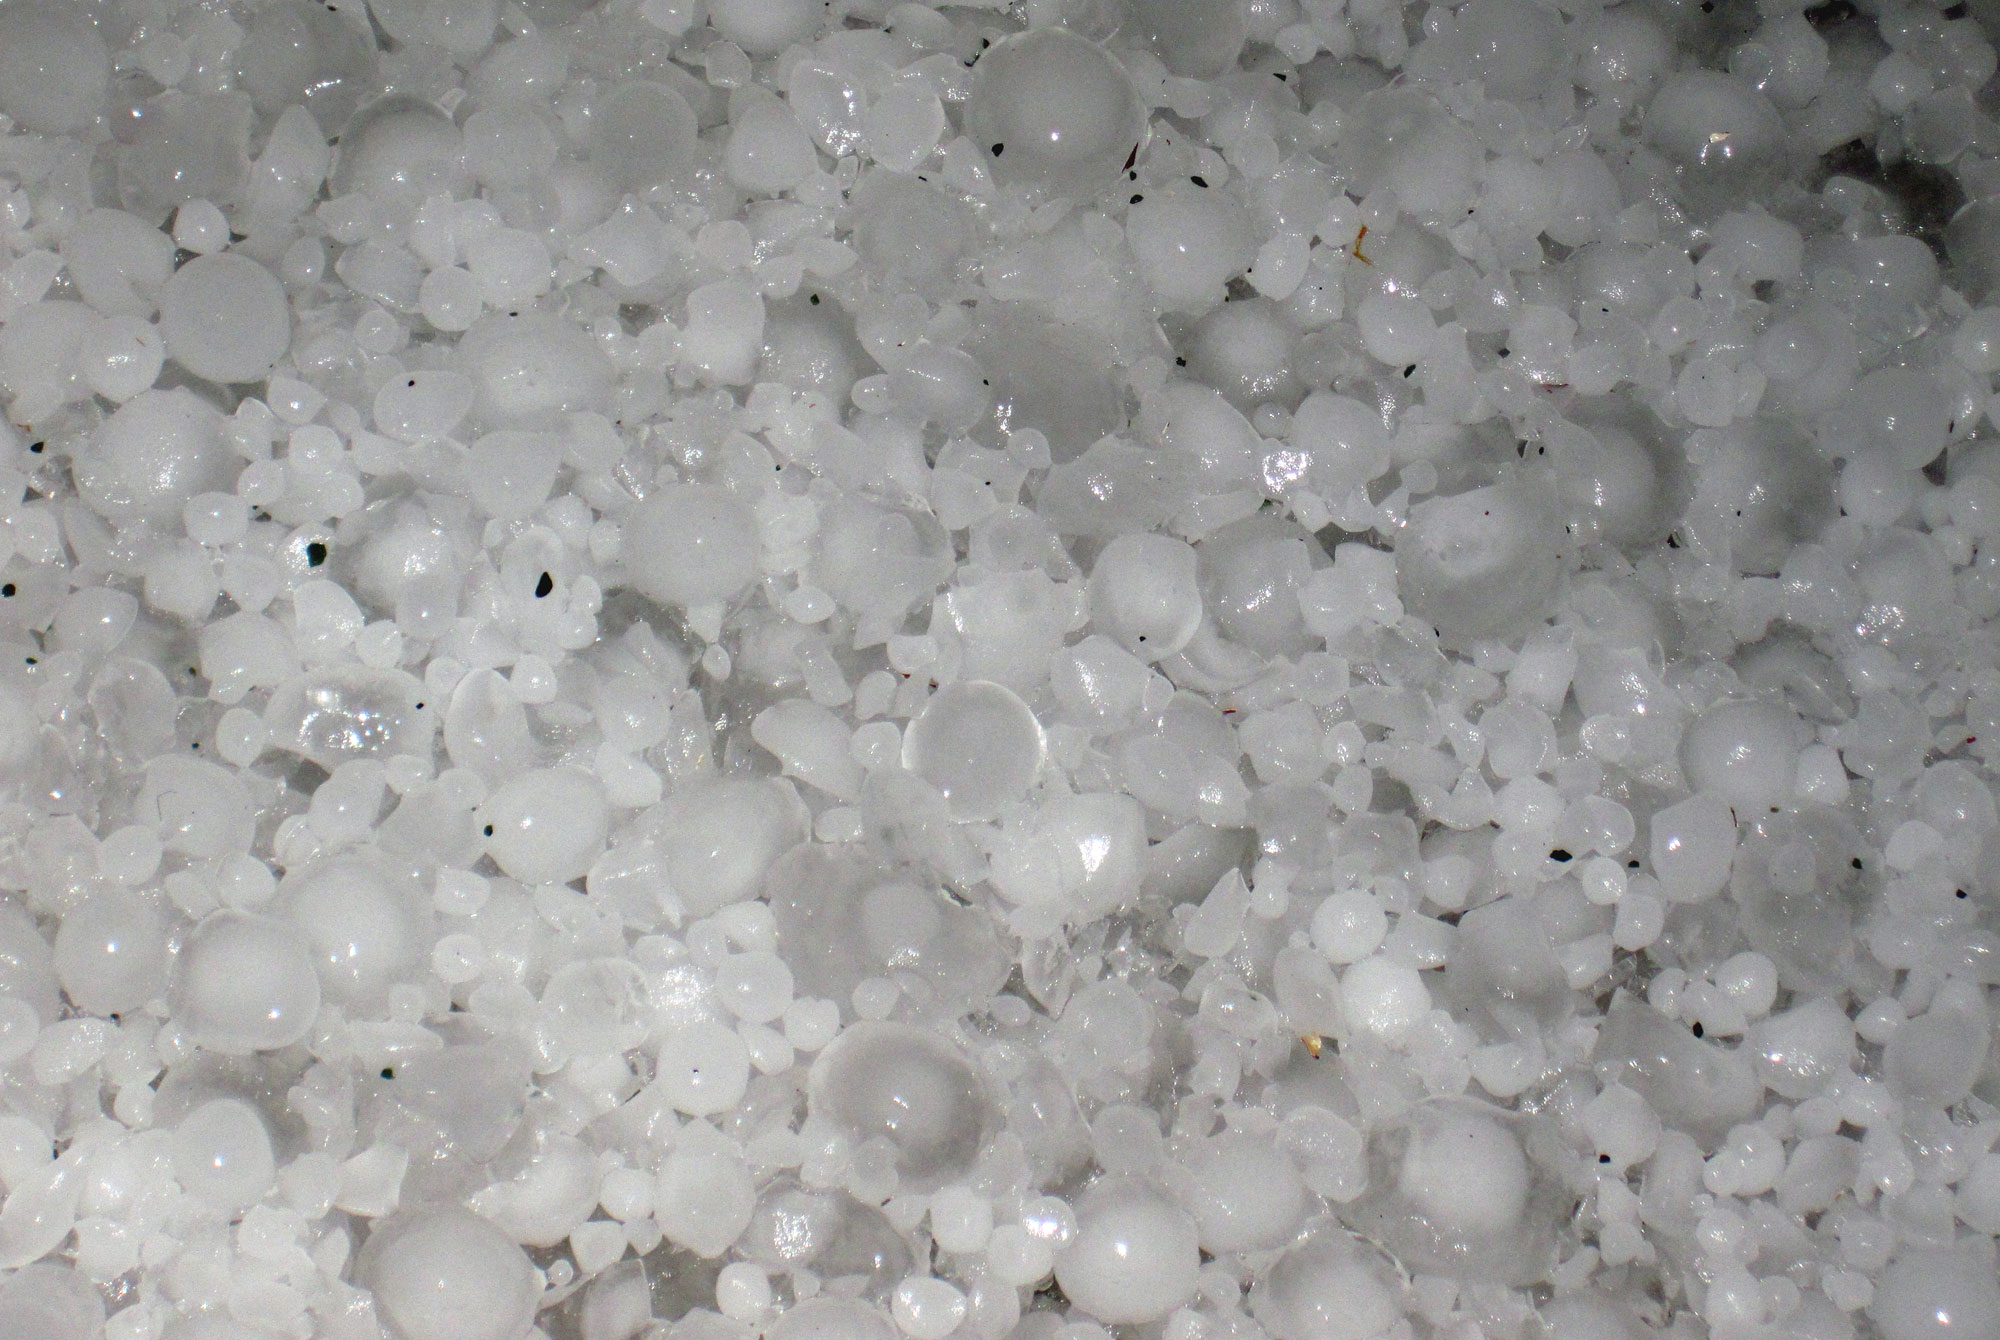
Hailstones from a storm in Limon, Colorado, 2010. According to the photographer, the largest stones were 1.5 to 2.5 centimeters (0.6 to 1 inch) size. Photo by James St. John (flickr, Creative Commons Attribution 2.0 Generic license, image cropped and resized).
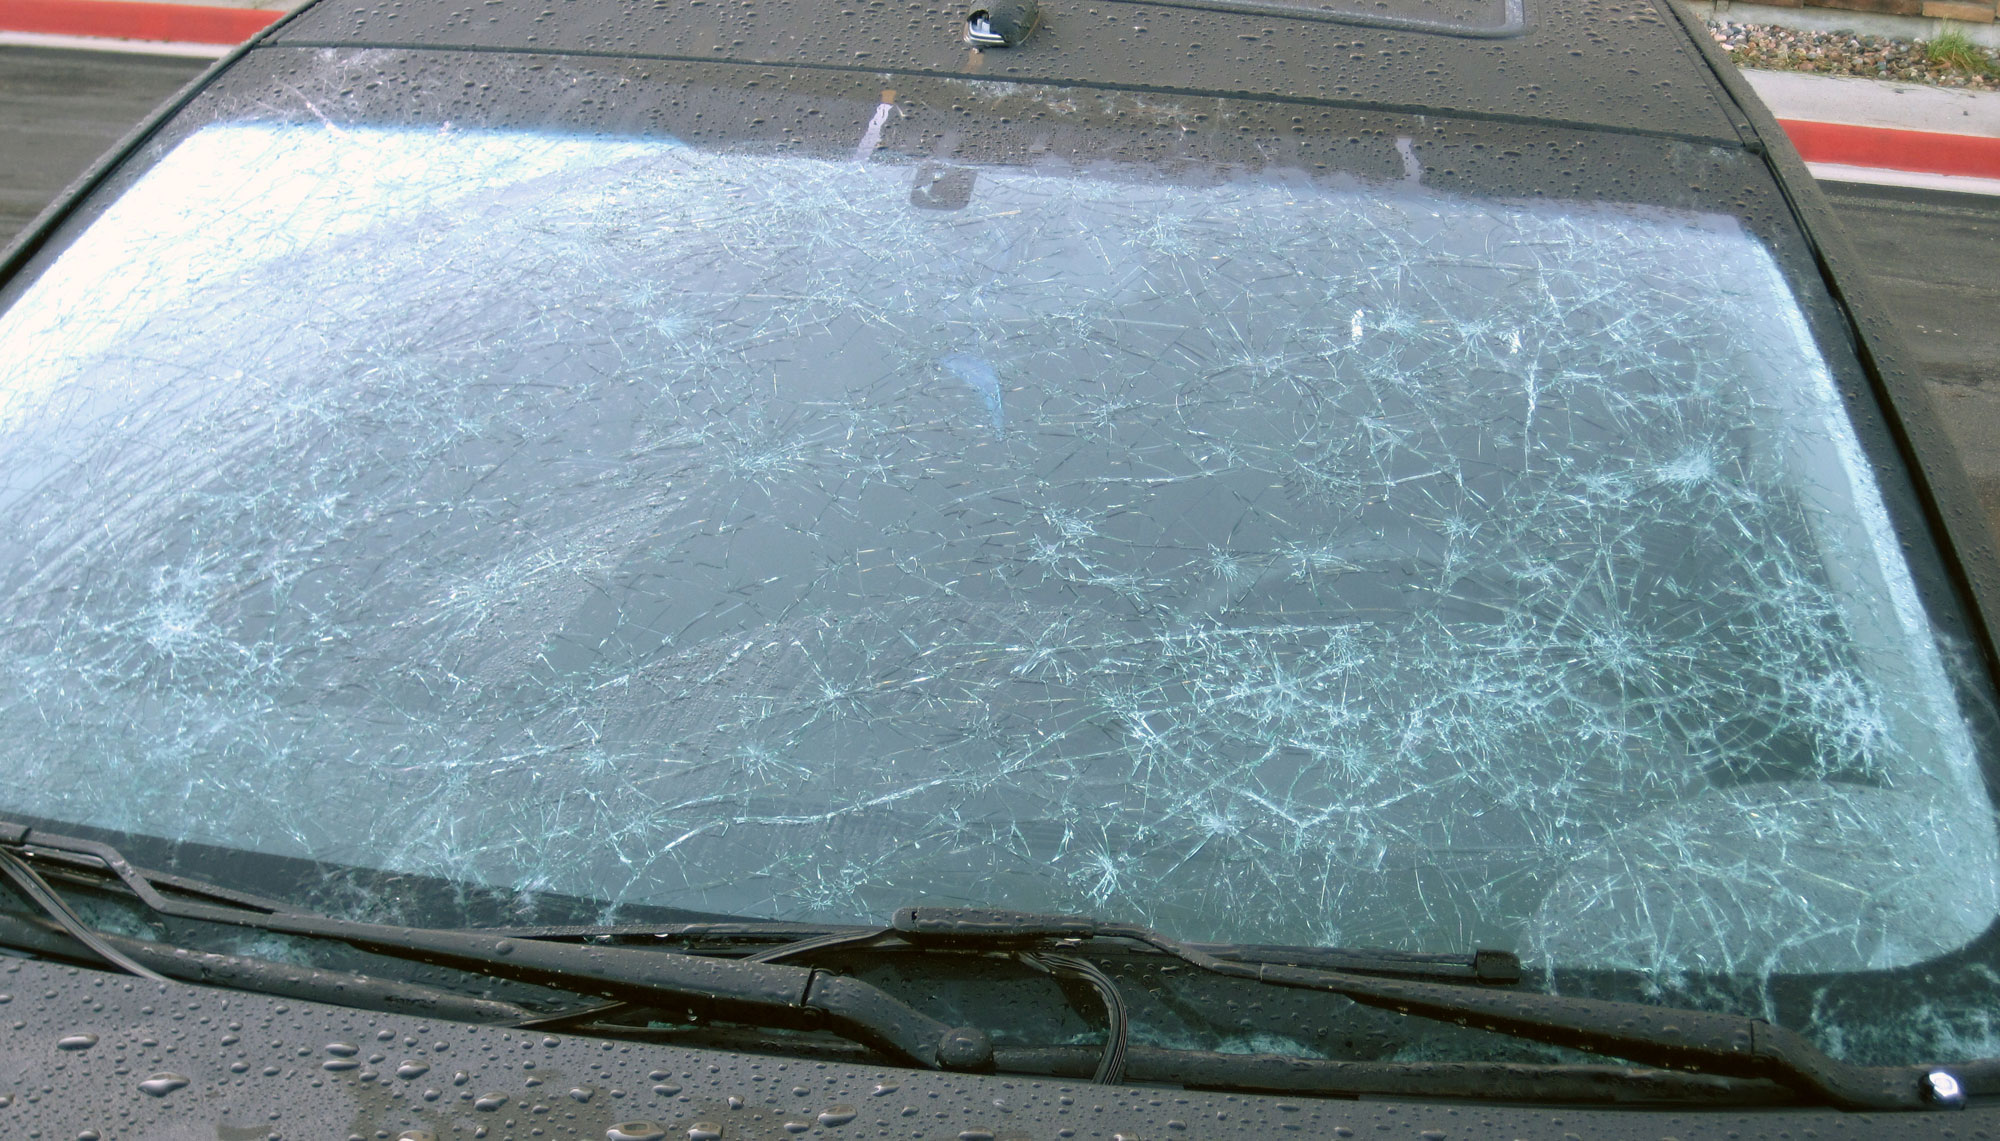
A car with a windshield damaged by hailstones, Limon, Colorado, 2010. Photo by James St. John (flickr, Creative Commons Attribution 2.0 Generic license, image resized).
Climate change and wildfire risk
The risk of dangerous wildfires is currently very high in parts of the Southwest. The reasons for this are complex and involve a combination factors. Weather conditions, particularly hot, dry weather and wind that spreads flames, contribute significantly to the ignition and growth of wildfires. Other elements involved in the ignition and growth of fires and the risks they pose to people living in the Southwest include (but are not limited to) forest management practices, development patterns, and human behavior (intentionally or unintentionally starting fires).
As average temperatures rise and the Southwest becomes drier with a longer annual fire season (season conducive to the ignition and spread of wildfires), the number and intensity of wildfires is expected to increase. The result may be more destructive wildfires like the Calf Canyon-Hermit Peak wildfire in New Mexico. This fire, which started as two separate fires that merged, began in April 2022 and has since burned more than 138,000 hectares (340,000 acres) of land and over 300 homes. As of June 2022, it was more than 90% contained. It is the largest wildfire that New Mexico has ever witnessed.
Both fires began as prescribed burns, or fires that were set deliberately with the intention of preventing the formation of future wildfires. (Prescribed burns are an important forest management tool; they are used to consume fuels like dry wood that can ignite and feed wildfires as well as maintain forest health.) Unfortunately, unpredictable winds spread the flames, which, combined with dry conditions, caused the Calf Canyon and Hermit Peak fires to grow beyond control. One especially alarming detail about the Calf Canyon fire is that it was originally set in January 2022. It smoldered beneath the ground as a dormant “holdover,” “sleeper,” or “zombie” fire until April, when it flared up and grew into a wildfire, an almost unprecedented occurrence in the Southwest.
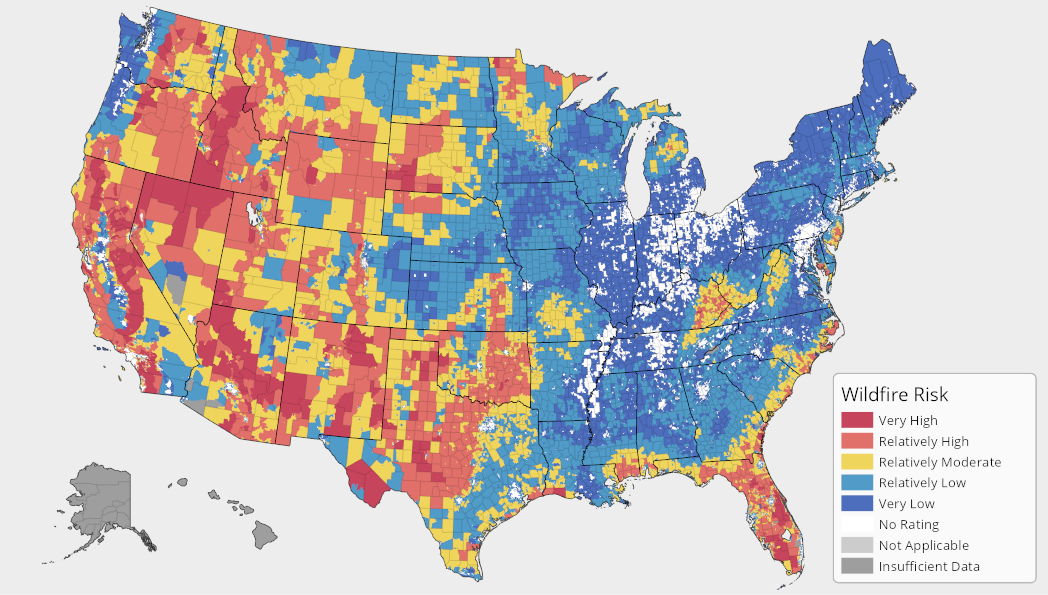
Wildfire risk map for the United States. Source: FEMA National Risk Index.
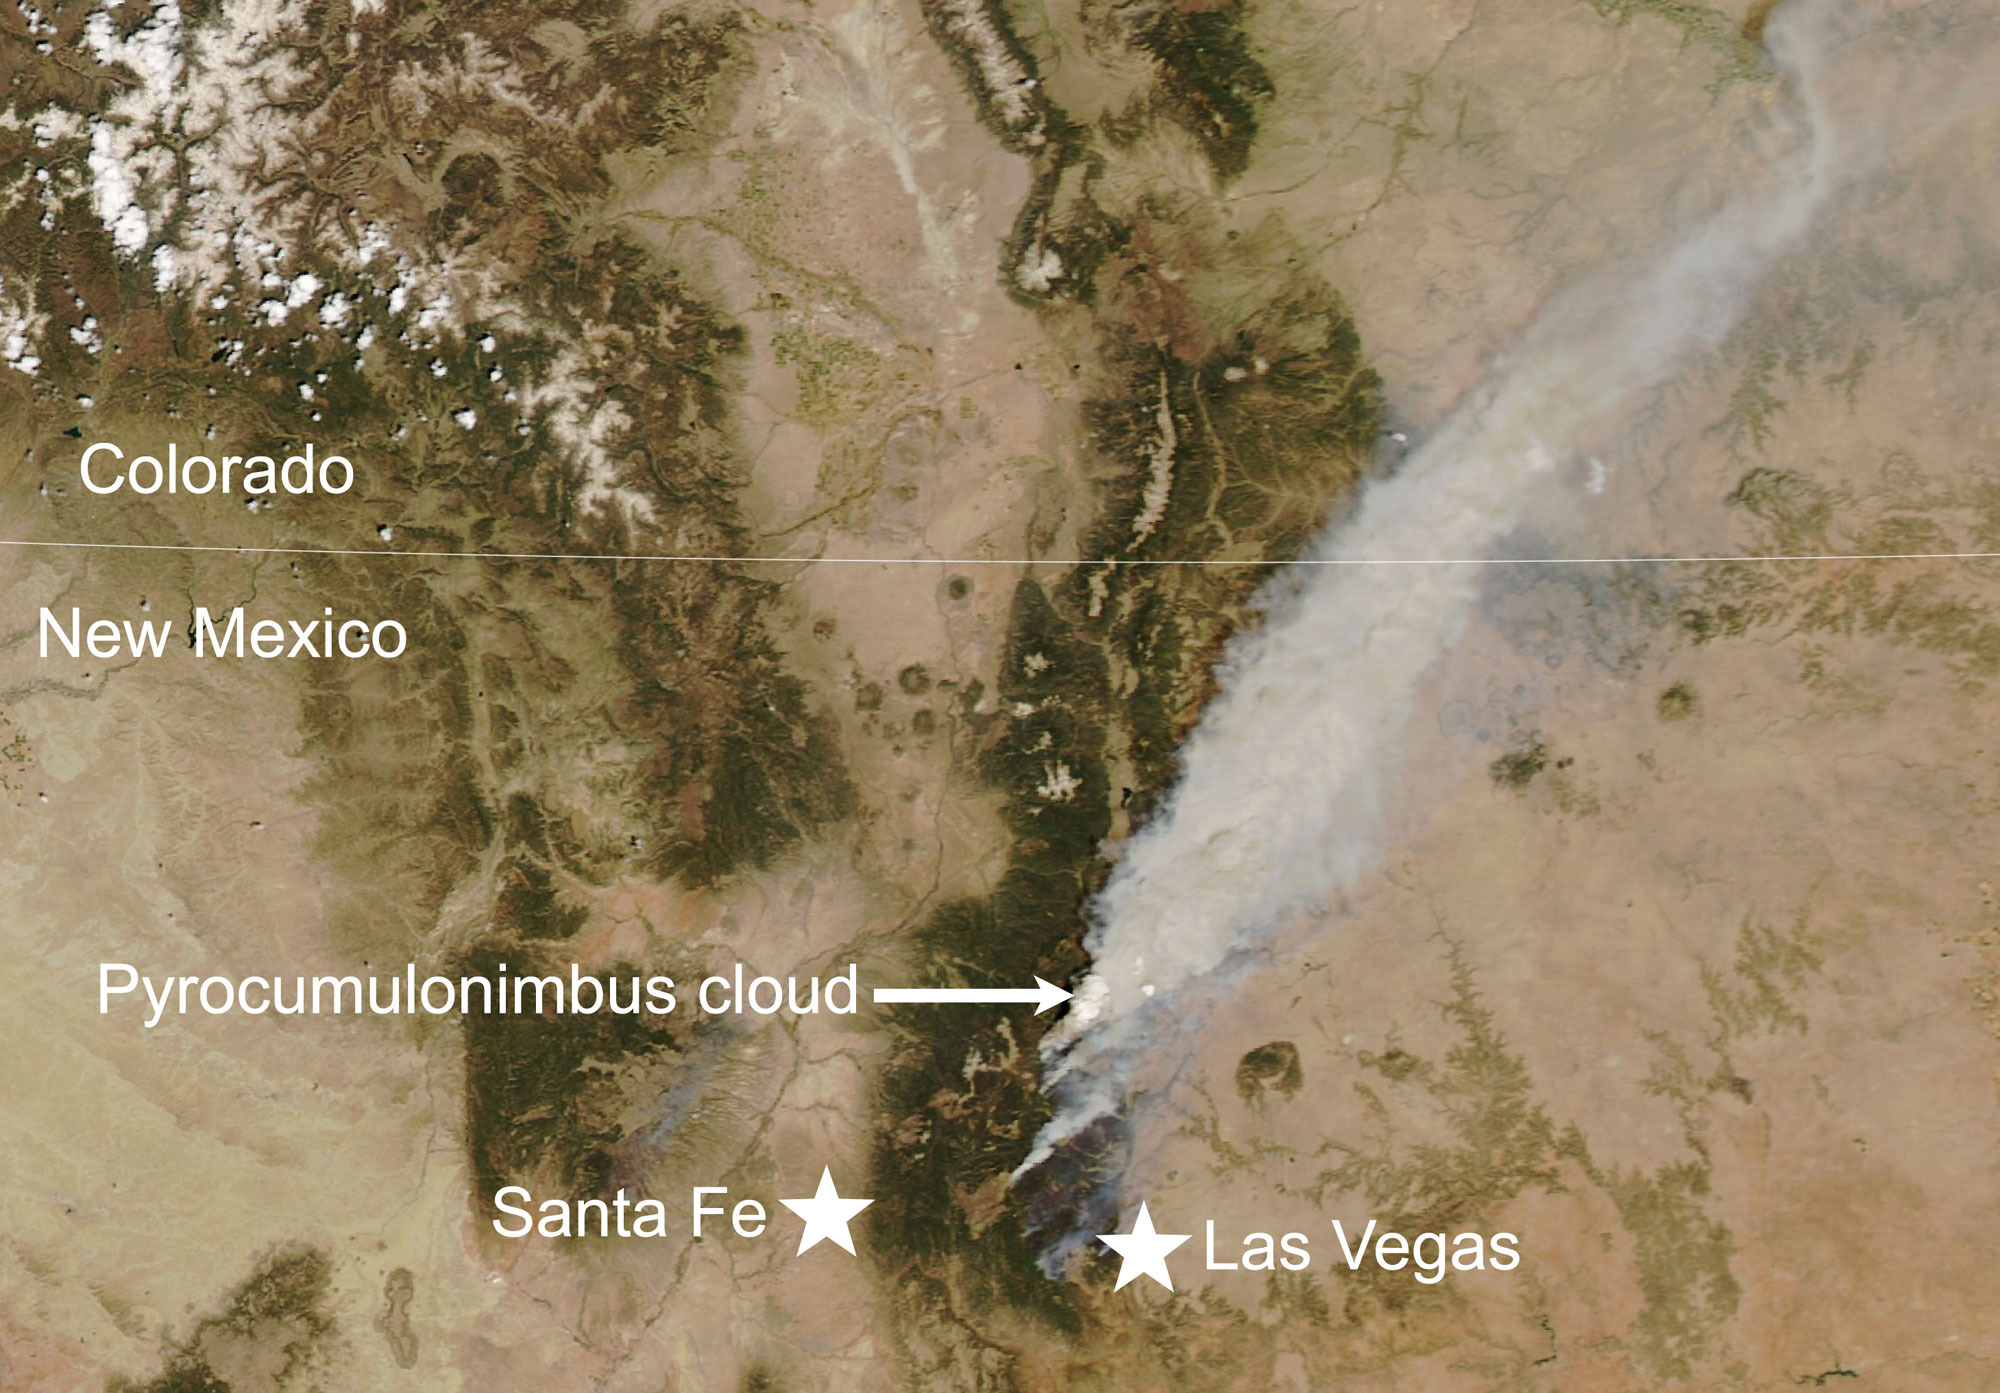
Satellite photo showing smoke from the Calf Canyon-Hermit Creek Fire on May 10, 2022. The distance between Santa Fe and Las Vegas, New Mexico, is about 65 kilometers (about 40.5 miles). The pyrocumulonimbus cloud shown at the arrow was created by heat from the fire. NASA Earth Observatory image by Lauren Dauphin (NASA Earth Observatory, used following NASA's image use policy).
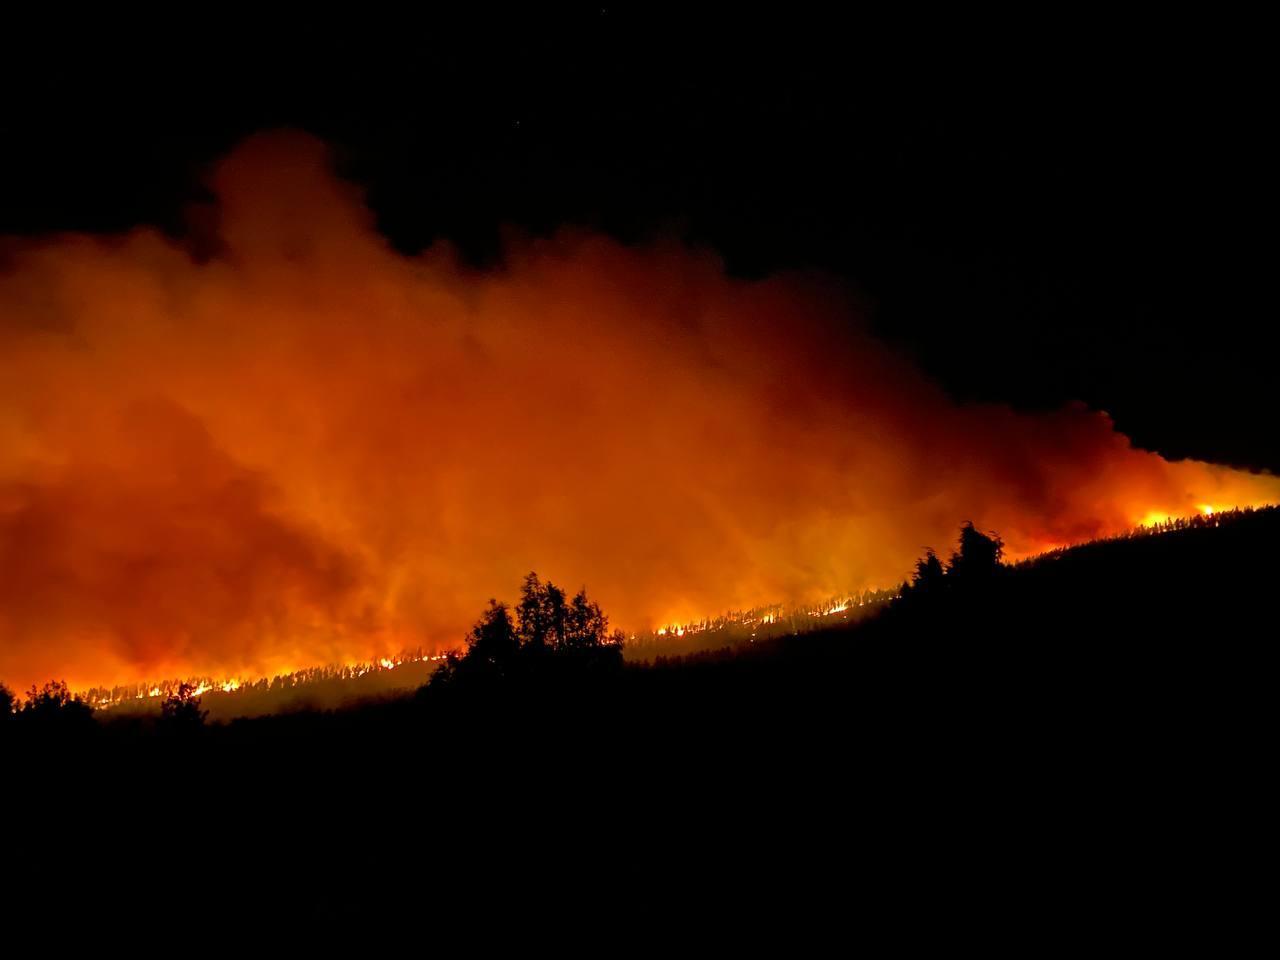
Calf Canyon-Hermit Creek Fire near Holman, New Mexico, on May 8, 2022. Photo by Santa Fe National Forest (National Interagency Fire Center on flickr, public domain).
Resources
Resources from the Paleontological Research Institution
Books
Zabel, I.H.H., D. Haas, and R.M. Ross. 2017. The Teacher-Friendly Guide to Climate Change. Paleontological Research Institution Special Publication 53, Ithaca, NY, 294 pp. Find updated, digital versions of the chapters of this book on Earth@Home Climate.
Allmon, W. D., T. A. Smrecak, and R. M. Ross. 2010. Climate change—past, present & future: a very short guide. Paleontological Research Institution Special Publication 38, Ithaca, NY, 200 pp.
Websites
Earth@Home Climate: https://climate.earthathome.org/
Earth@Home: Quick guides & FAQ: Climate and Energy: https://earthathome.org/quick-faqs/#climate
Earth@Home: Here on Earth: Introduction to Climate: https://earthathome.org/hoe/climate/