

Page snapshot: Introduction to the climate of the northeastern U.S., including present, past, and future climate.
Topics covered on this page: Present climate of the northeastern U.S.; Average temperature and precipitation; Severe weather; Hurricanes; Polar jet stream and winter storms; The polar vortex; Lake effect snow; Past climate of the northeastern U.S.; Paleozoic; Mesozoic; Cenozoic; Future climate of the northeastern U.S.; Resources.
Credits: Some of the text of this page comes from text developed for the Teacher Friendly Guides to the Earth Science series. The text was adapted for the web by Elizabeth J. Hermsen, Jonathan R. Hendricks, and Ingrid H. H. Zabel in 2022. Credits for individual images are given in figure captions.
Updates: Page last updated October 13, 2022.
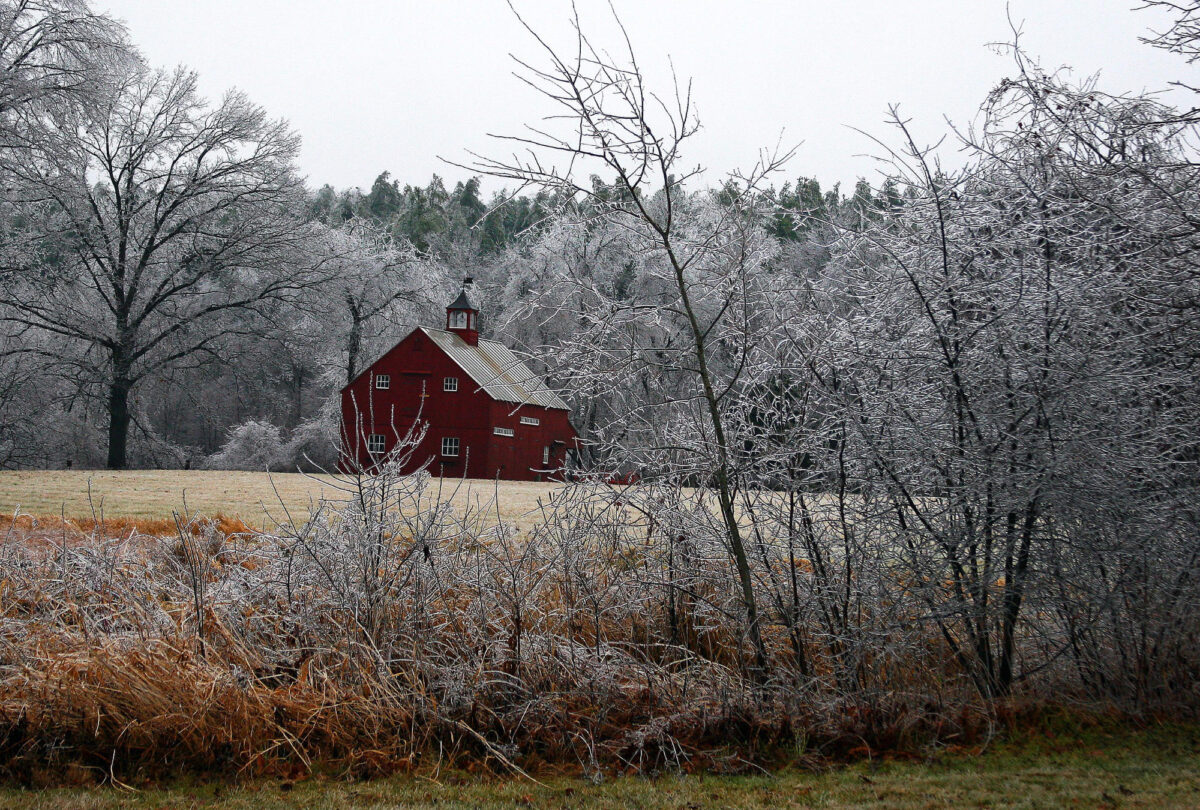
Image above: Landscape with barn after an ice storm; Boxborough, Massachusetts. Photo by Liz West (CC BY 2.0) via Wikimedia Commons.
Present climate of the northeastern U.S.
Nearly all of the Northeast has a humid continental climate, describing temperatures that vary greatly from summer to winter, and appreciable precipitation year-round. Maryland, Delaware, New Jersey, southern Pennsylvania, southern New England, and extreme southeastern New York are closer to a humid subtropical climate. The Atlantic Ocean and the Great Lakes influence the Northeast’s climate heavily. The Atlantic Ocean has a moderating effect on the temperatures of coastal regions because of air masses that pass from the ocean over the coast, warming in winter and cooling in summer. It is also the source of hurricanes that originate close to the equator over the Atlantic.
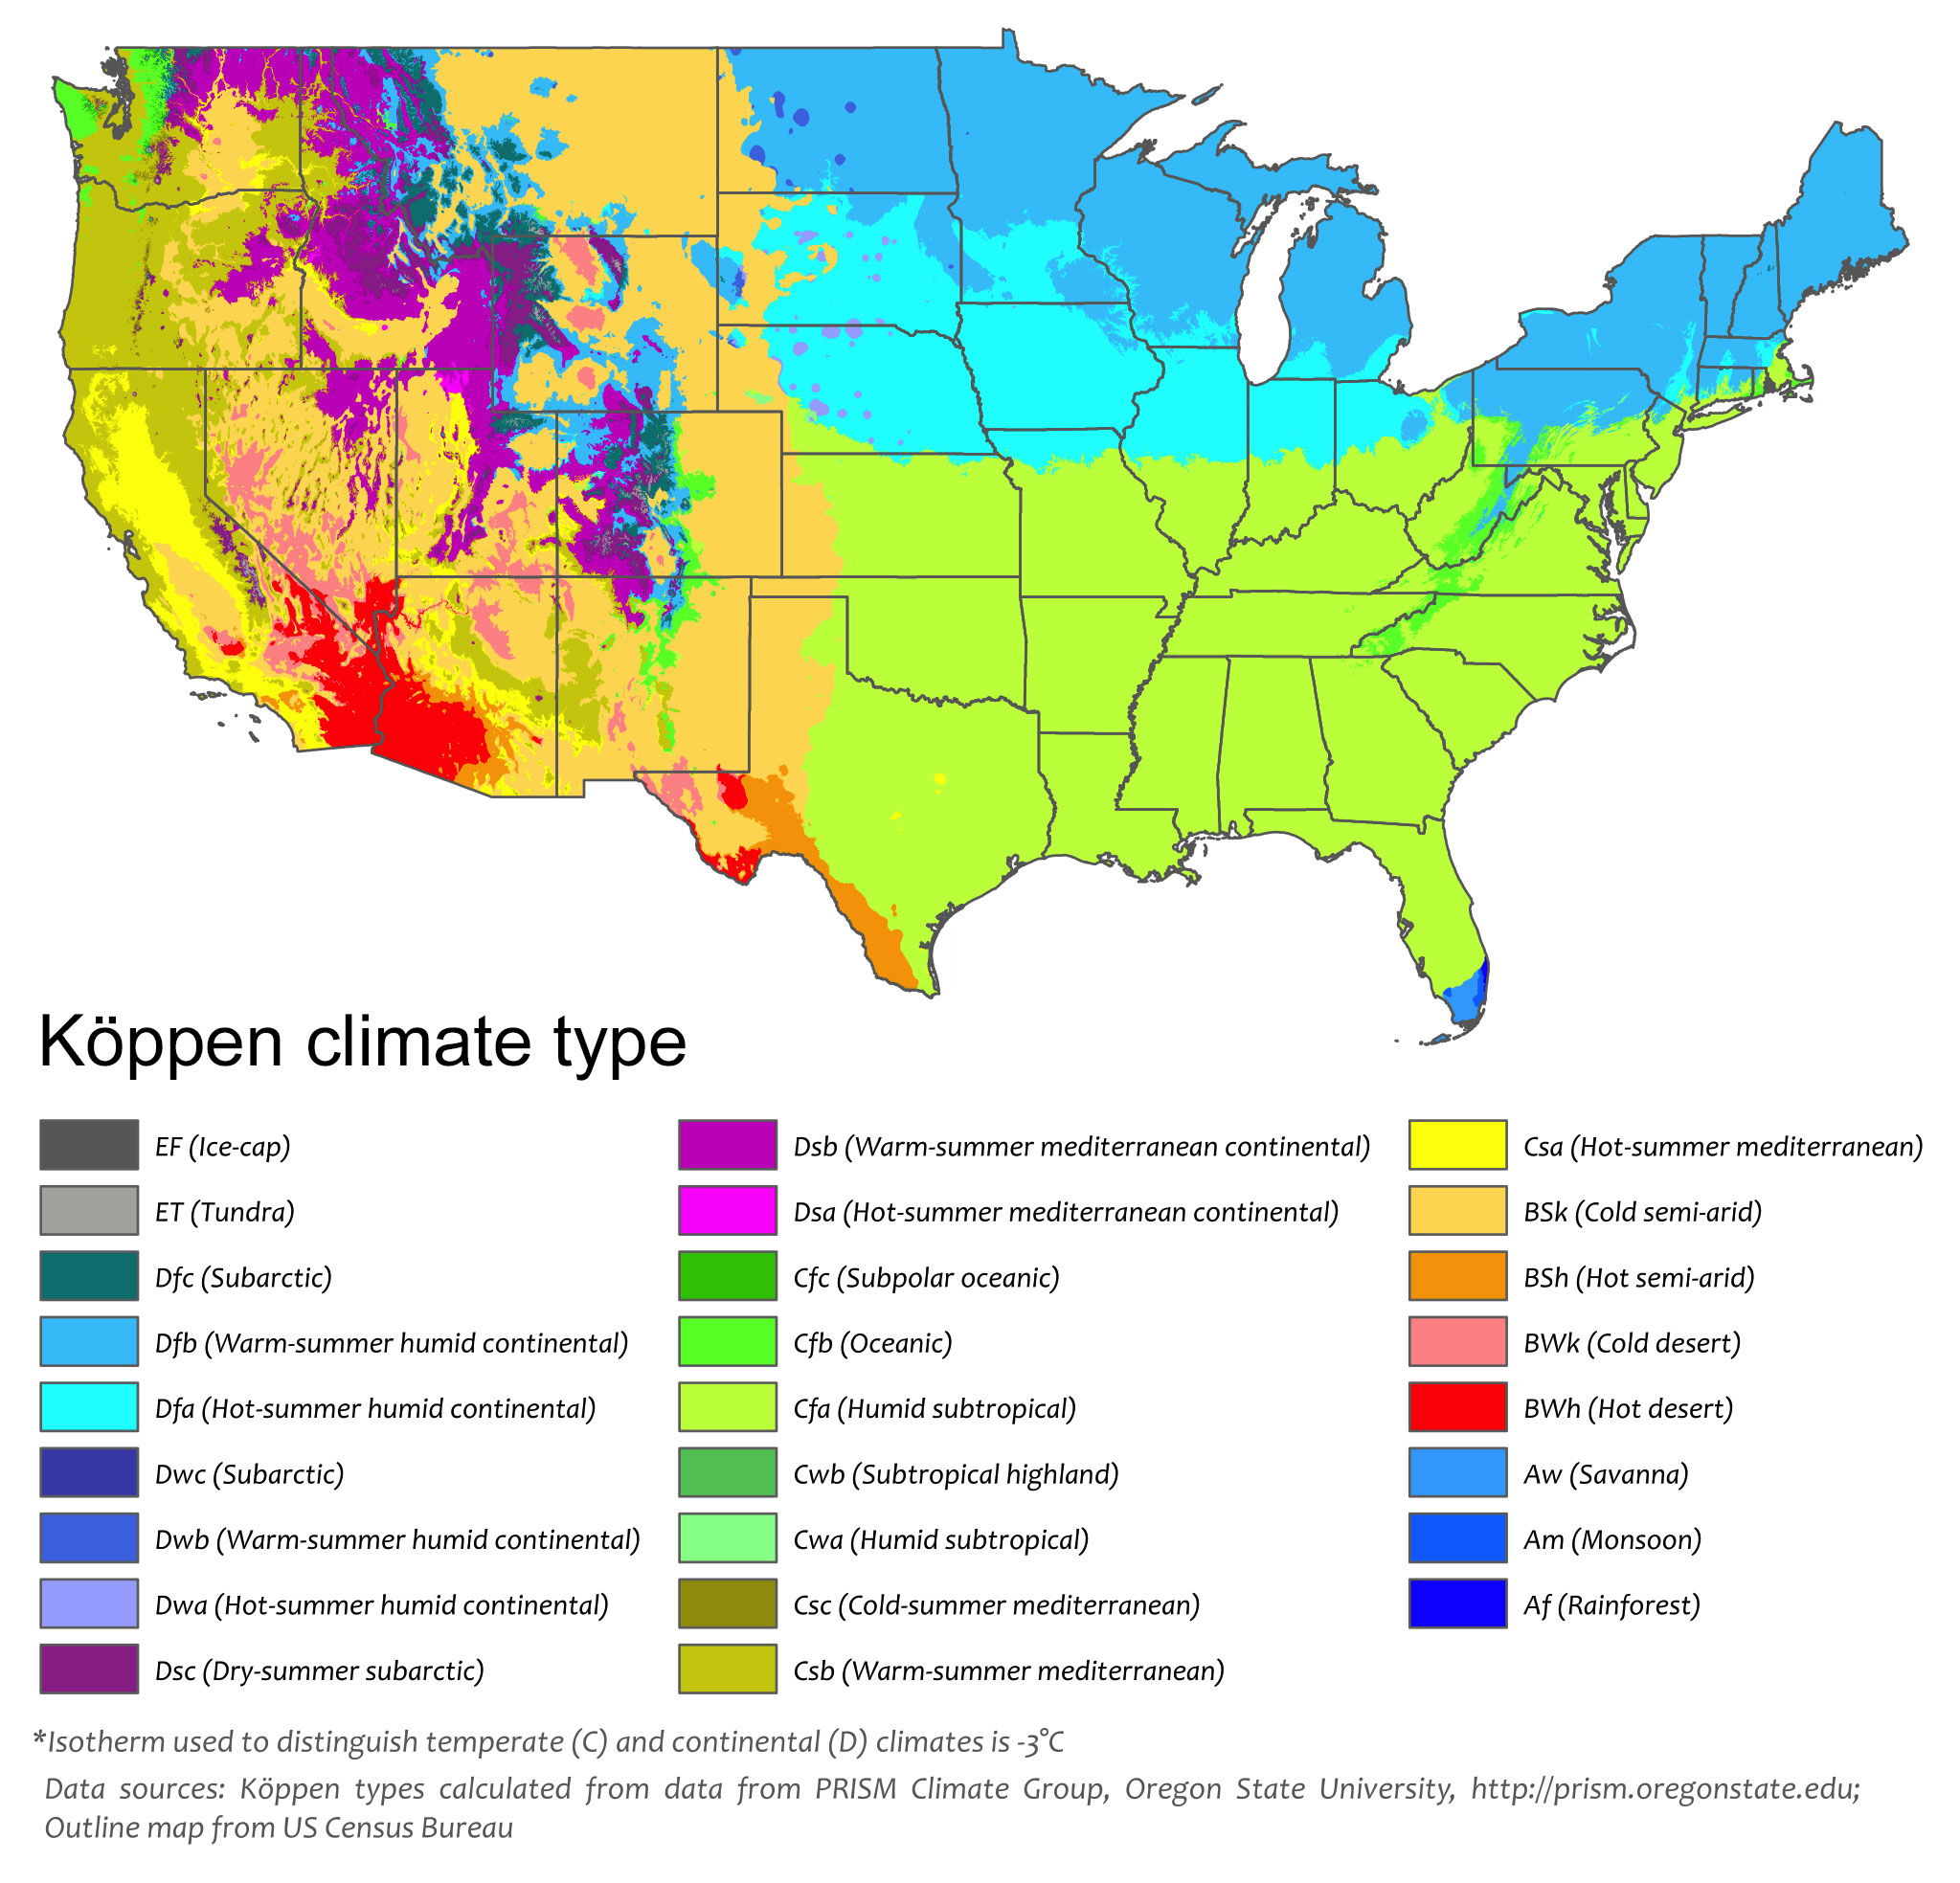
Köppen climate map of the 48 contiguous states of the continental United States. The first letter of each zone in the key indicates its major classification. A = Tropical (equatorial), B = Arid, C = Temperate (warm temperate), D = Continental (cold), E = polar. Modified from a map by Adam Peterson (Wikimedia Commons, Creative Commons Attribution-ShareAlike 4.0 International license).
In addition to adjoining large bodies of water, the Northeast contains the northern part of the Appalachian Mountain chain, which influences the climates in its subregions. In the southern part of the Northeast, the Appalachians partially protect the east coast from the prevailing winds coming from the west and the interior of North America. They also limit moist, Atlantic air from traveling to the western subregions.
The Northeast is the most densely populated region of the United States, with almost all the counties along the east coast from New Hampshire to Maryland having 300 or more people per square mile. New York City—the largest city in the U.S., with more than 8.5 million people living within the city limits—and other coastal cities are vulnerable to extreme weather hazards; examples include public health risks brought on by heat waves; physical harm, property damage, and water supply contamination during flooding; and transportation disruptions and power outages from ice and snow storms. The Northeast experiences its share of these weather hazards, as well as drought and fog.

Spc. Daryl Johnson, a construction equipment operator, 379th Engineer Co. (Horizontal), Massachusetts Army National Guard, cuts a fallen tree with a chainsaw in Phillipston, Mass., Dec. 14, 2008. The town of Phillipston lost power when trees covered with ice began falling onto power lines leaving the towns 900 homes without electricity. The 379th was mobilized to cut down trees and clear roads so civilian utility companies can begin trying to restore power to the town. Photo: Sgt. 1st Class Jon Soucy (public domain) via Wikimedia Commons
Average temperature and precipitation
Average temperatures in the Northeast can vary from summer to winter by as much as 22°C (72°F) in Maine and 16°C (61°F) in Maryland. The Northeast can get hot—Pennsylvania experienced a record high of 44°C (111°F) in 1936—but in general, the Northeast’s climate is cool enough that even the states in its southern portion have average low temperatures below freezing during the winter.
Average annual precipitation typically ranges from about 90 to 125 centimeters (35 to 50 inches) in the Northeast, though a few spots receive over 150 centimeters (60 inches) of rain annually due to their location on the windward side of a mountain range. Coastal areas tend to get more rain than do inland areas, and flooding is common in the Northeast due to extreme rainfall events, as well as from snowmelt and ice jams.
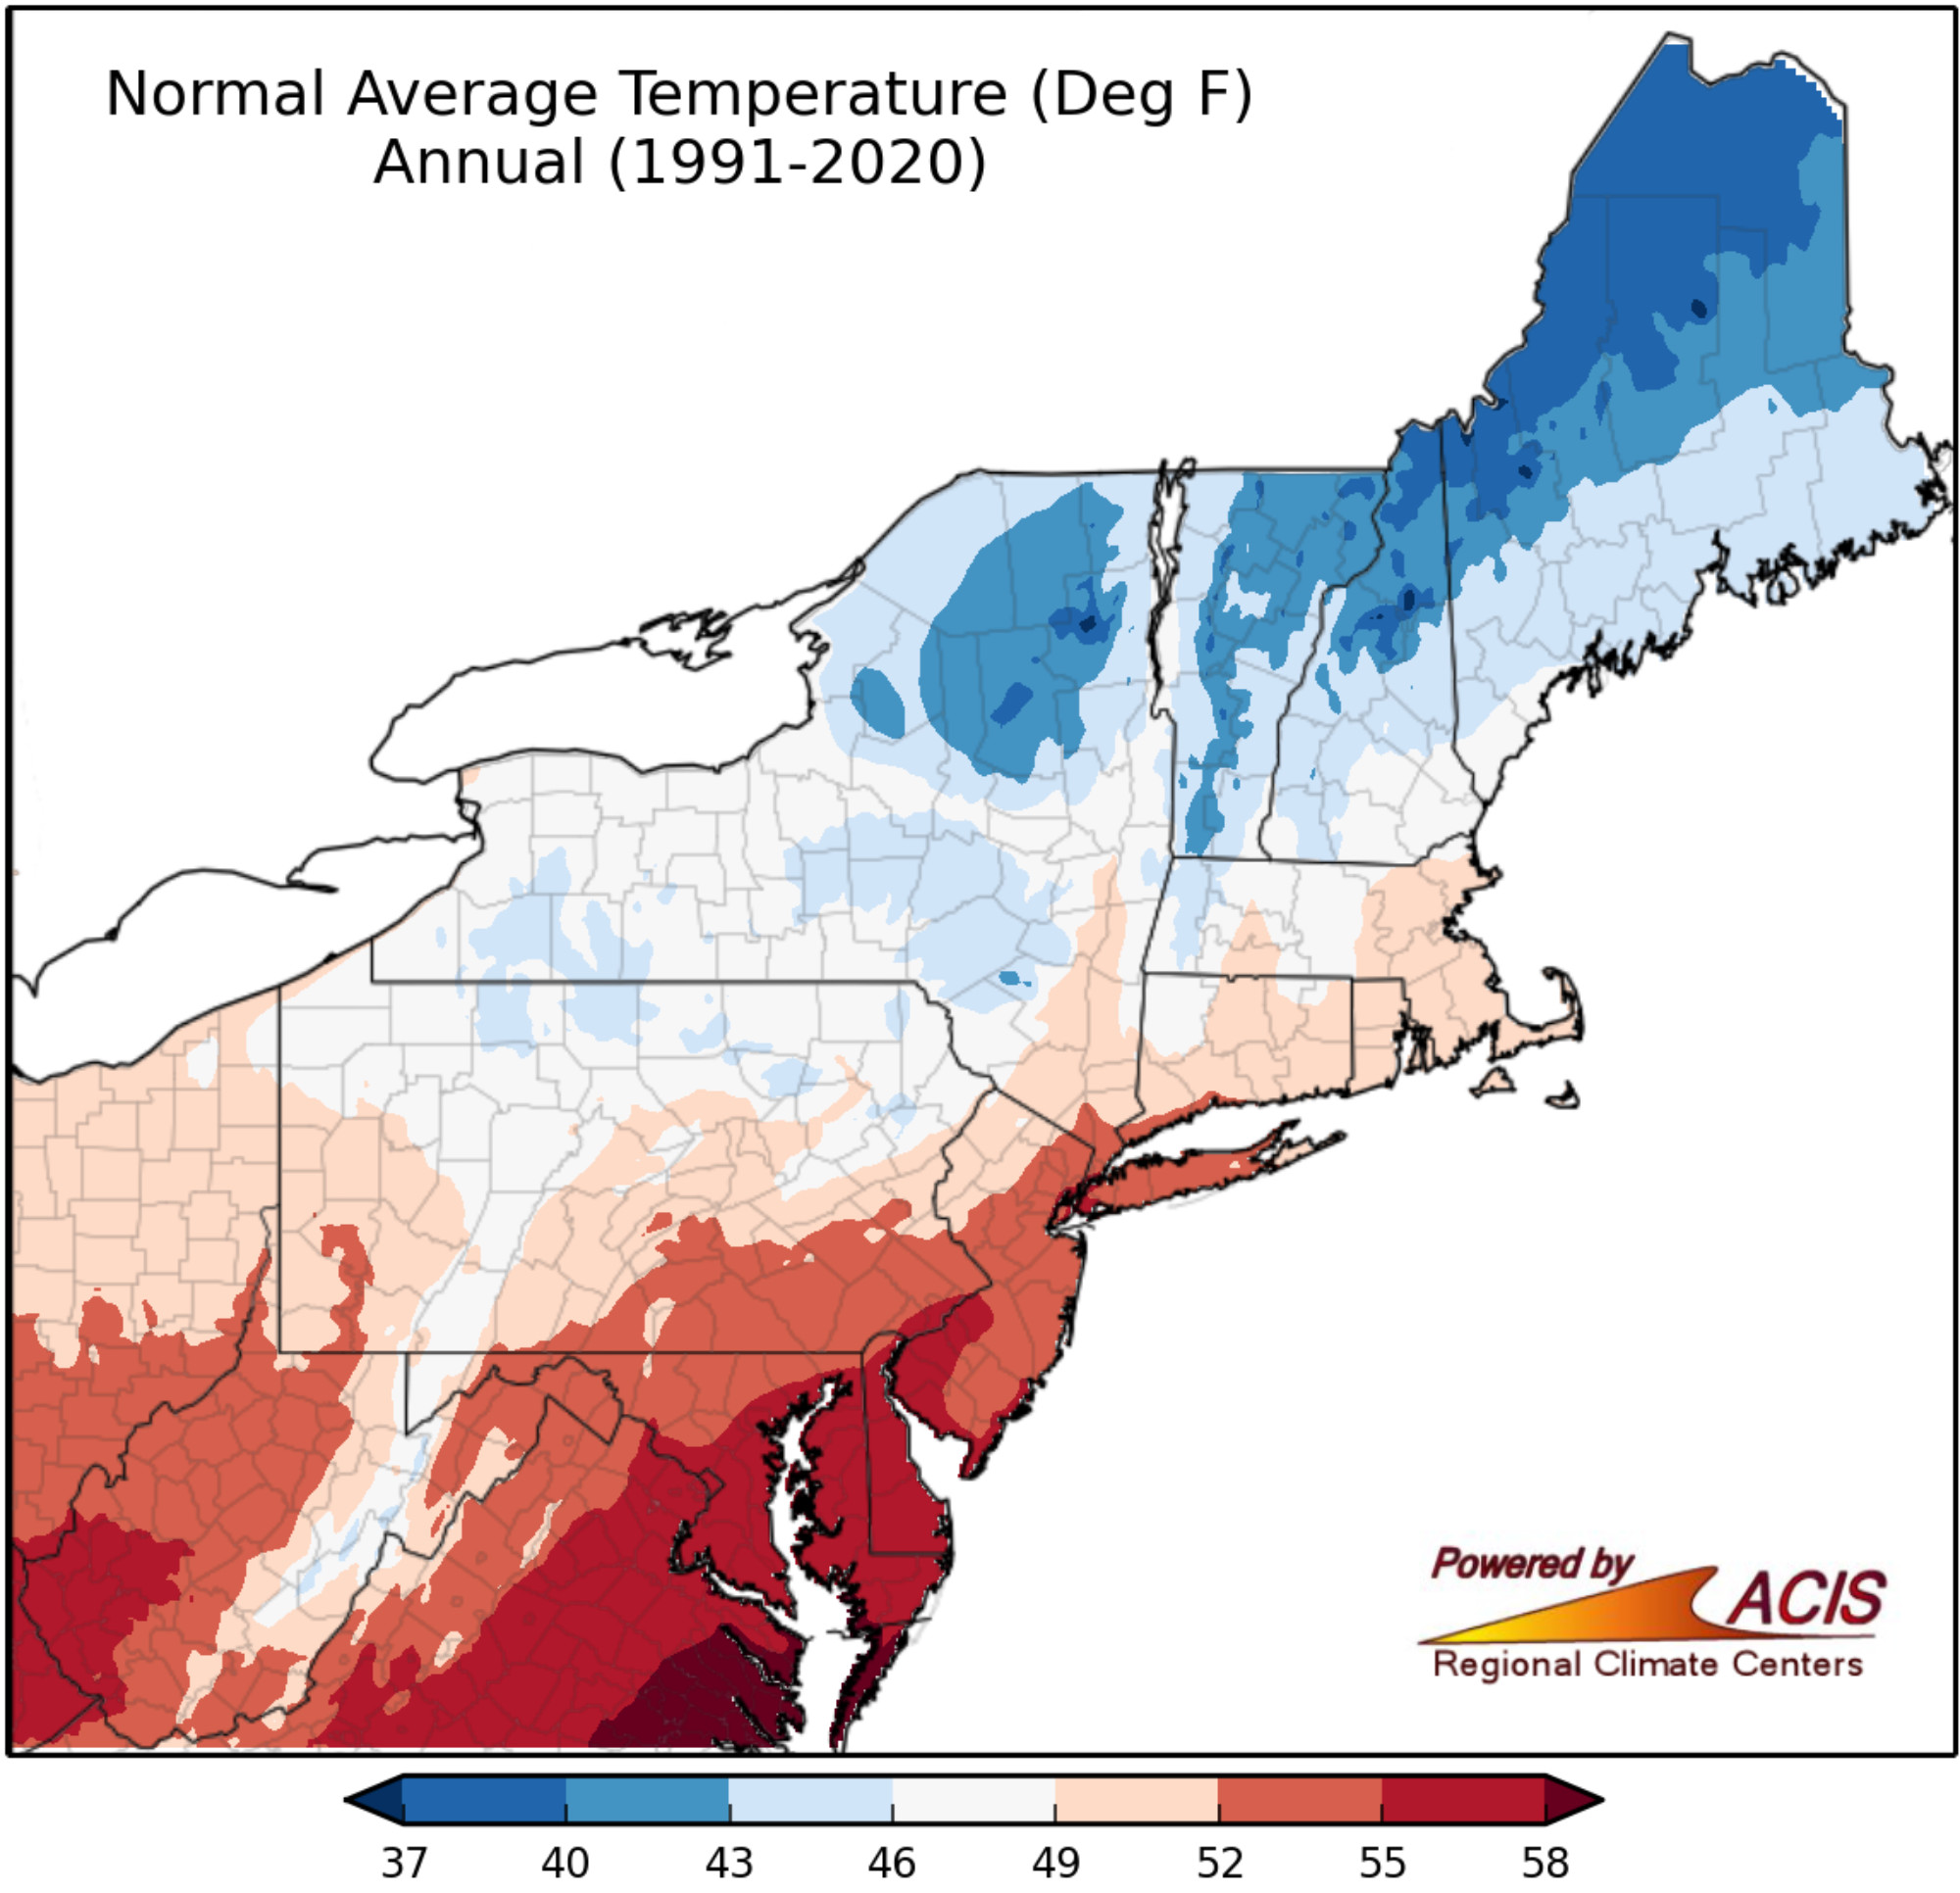
Map of Northeast U.S. average annual temperatures, averaged over the thirty-year period of 1991-2020. Map: Northeast Regional Climate Center at Cornell University, Climate Normals Maps
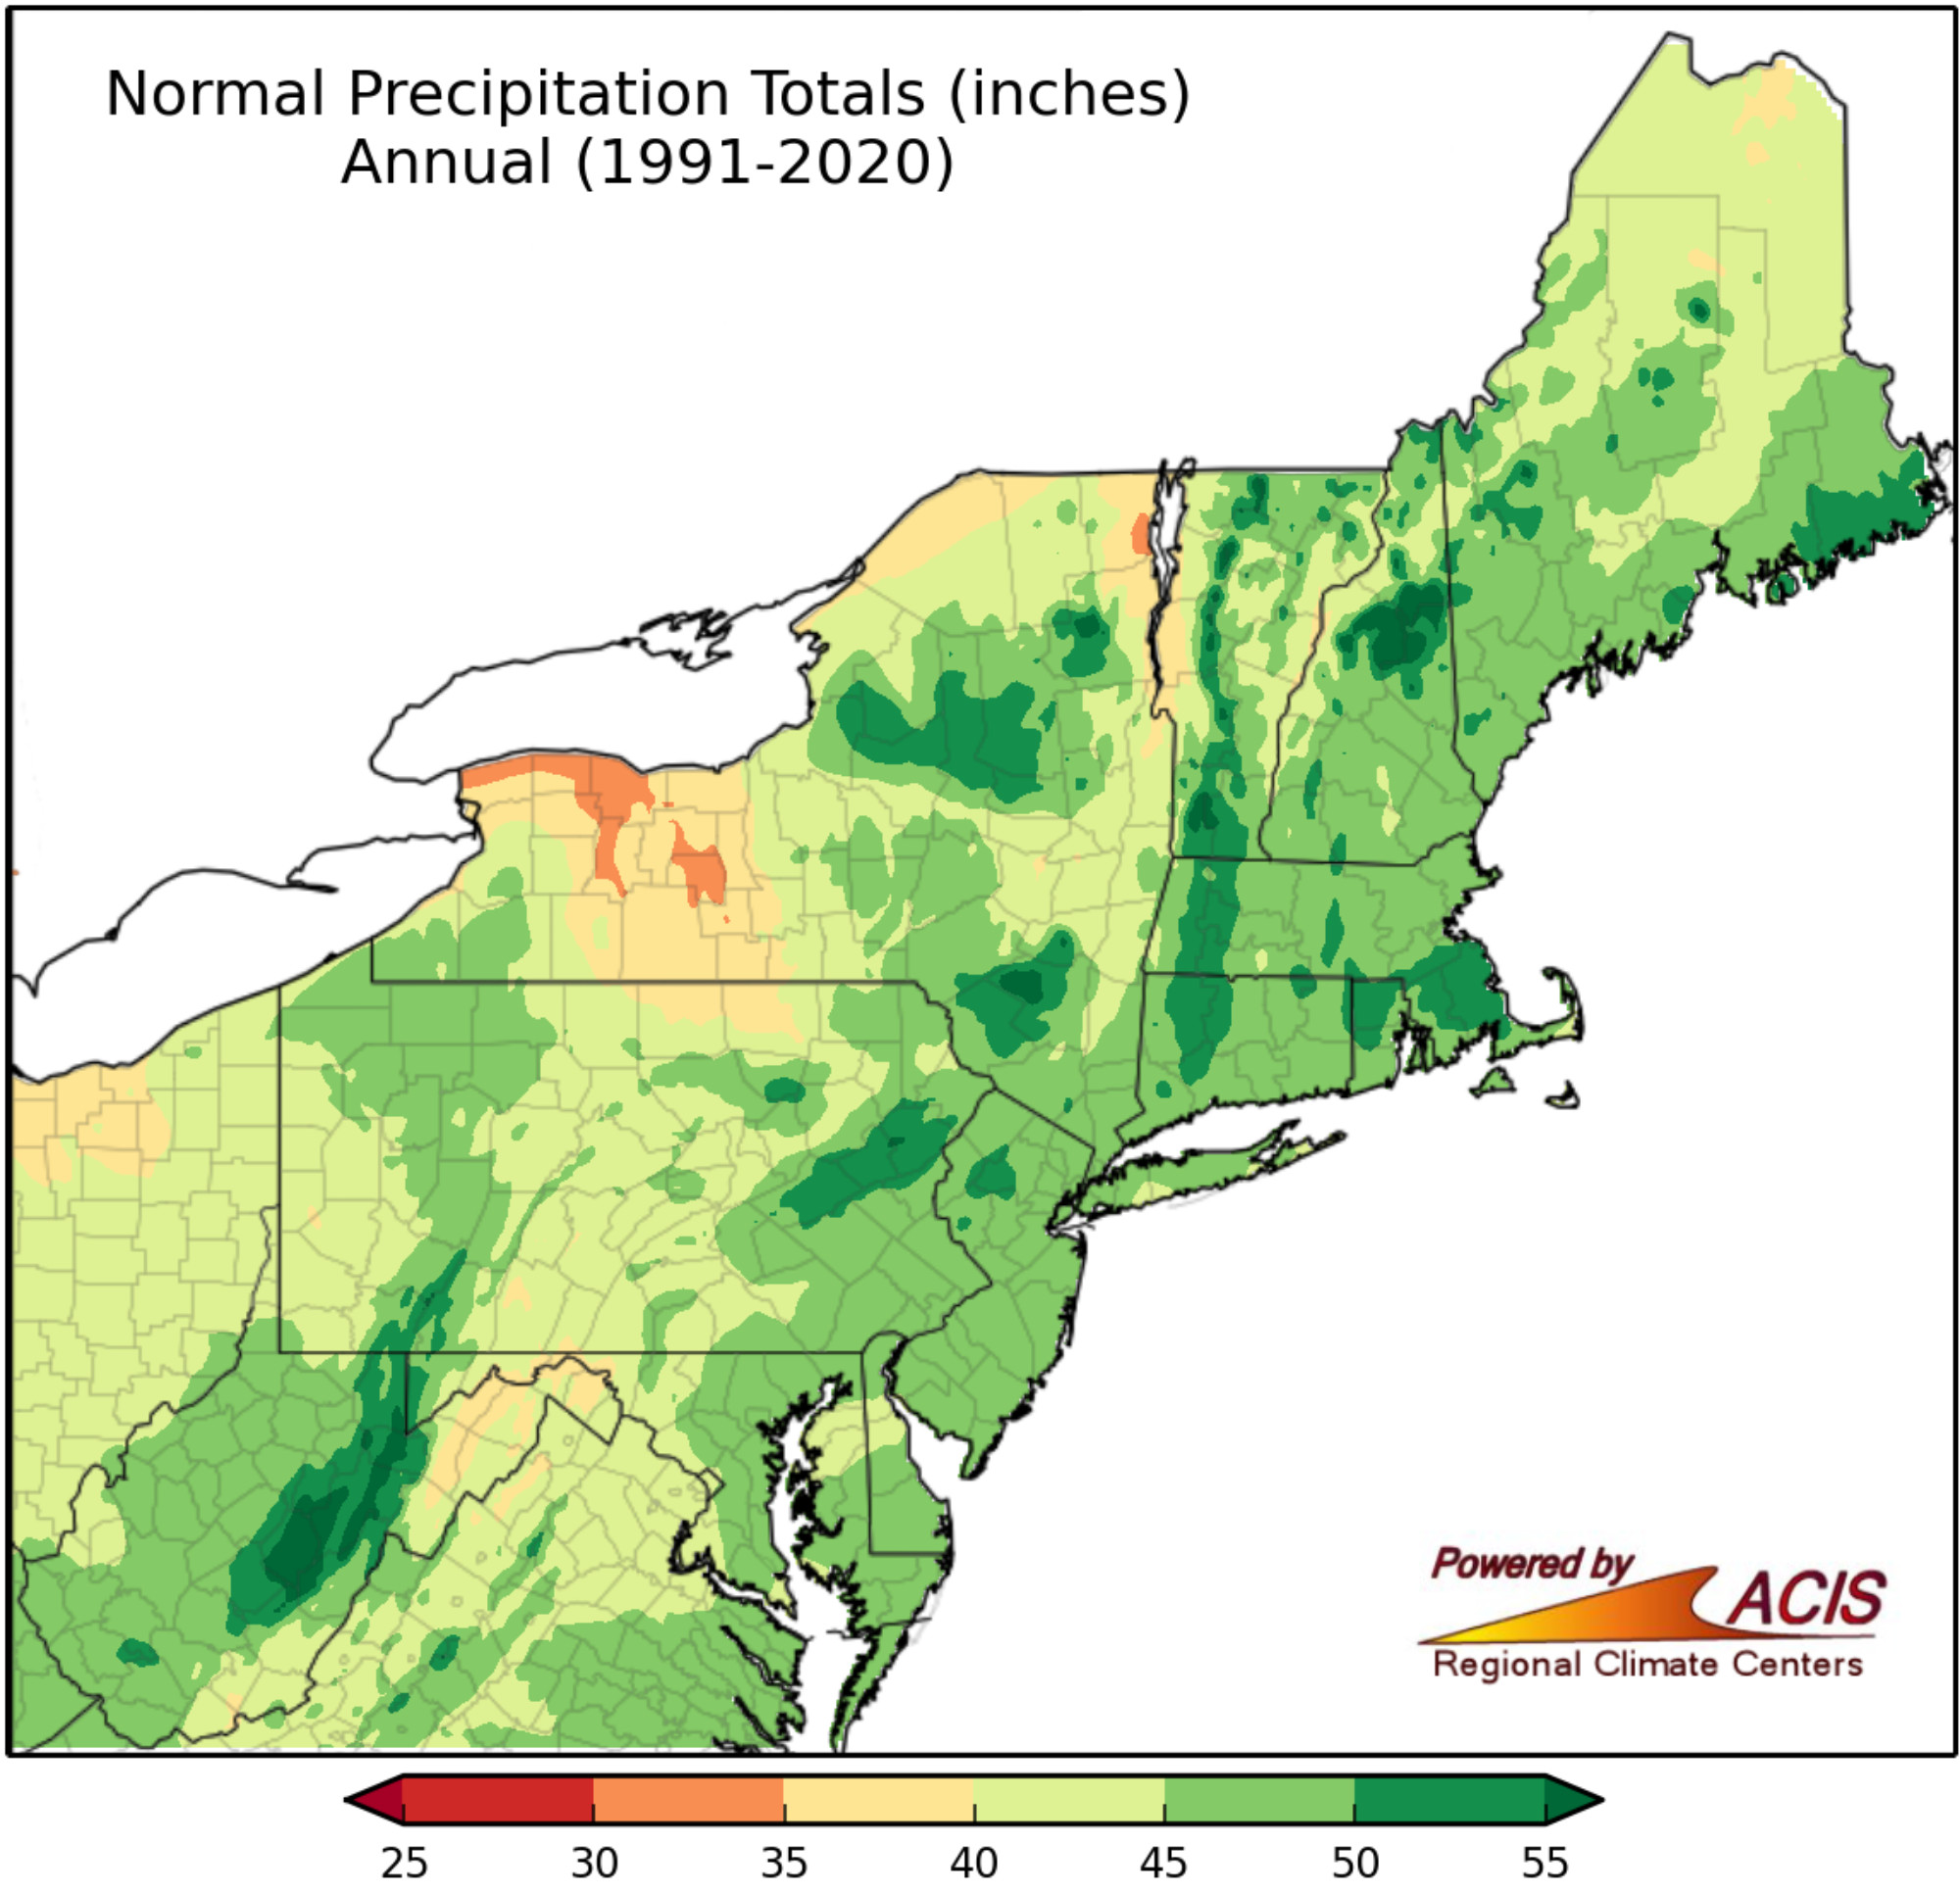
Map of Northeast U.S. total annual precipitation, averaged over the thirty-year period of 1991-2020. Map: Northeast Regional Climate Center at Cornell University, Climate Normals Maps
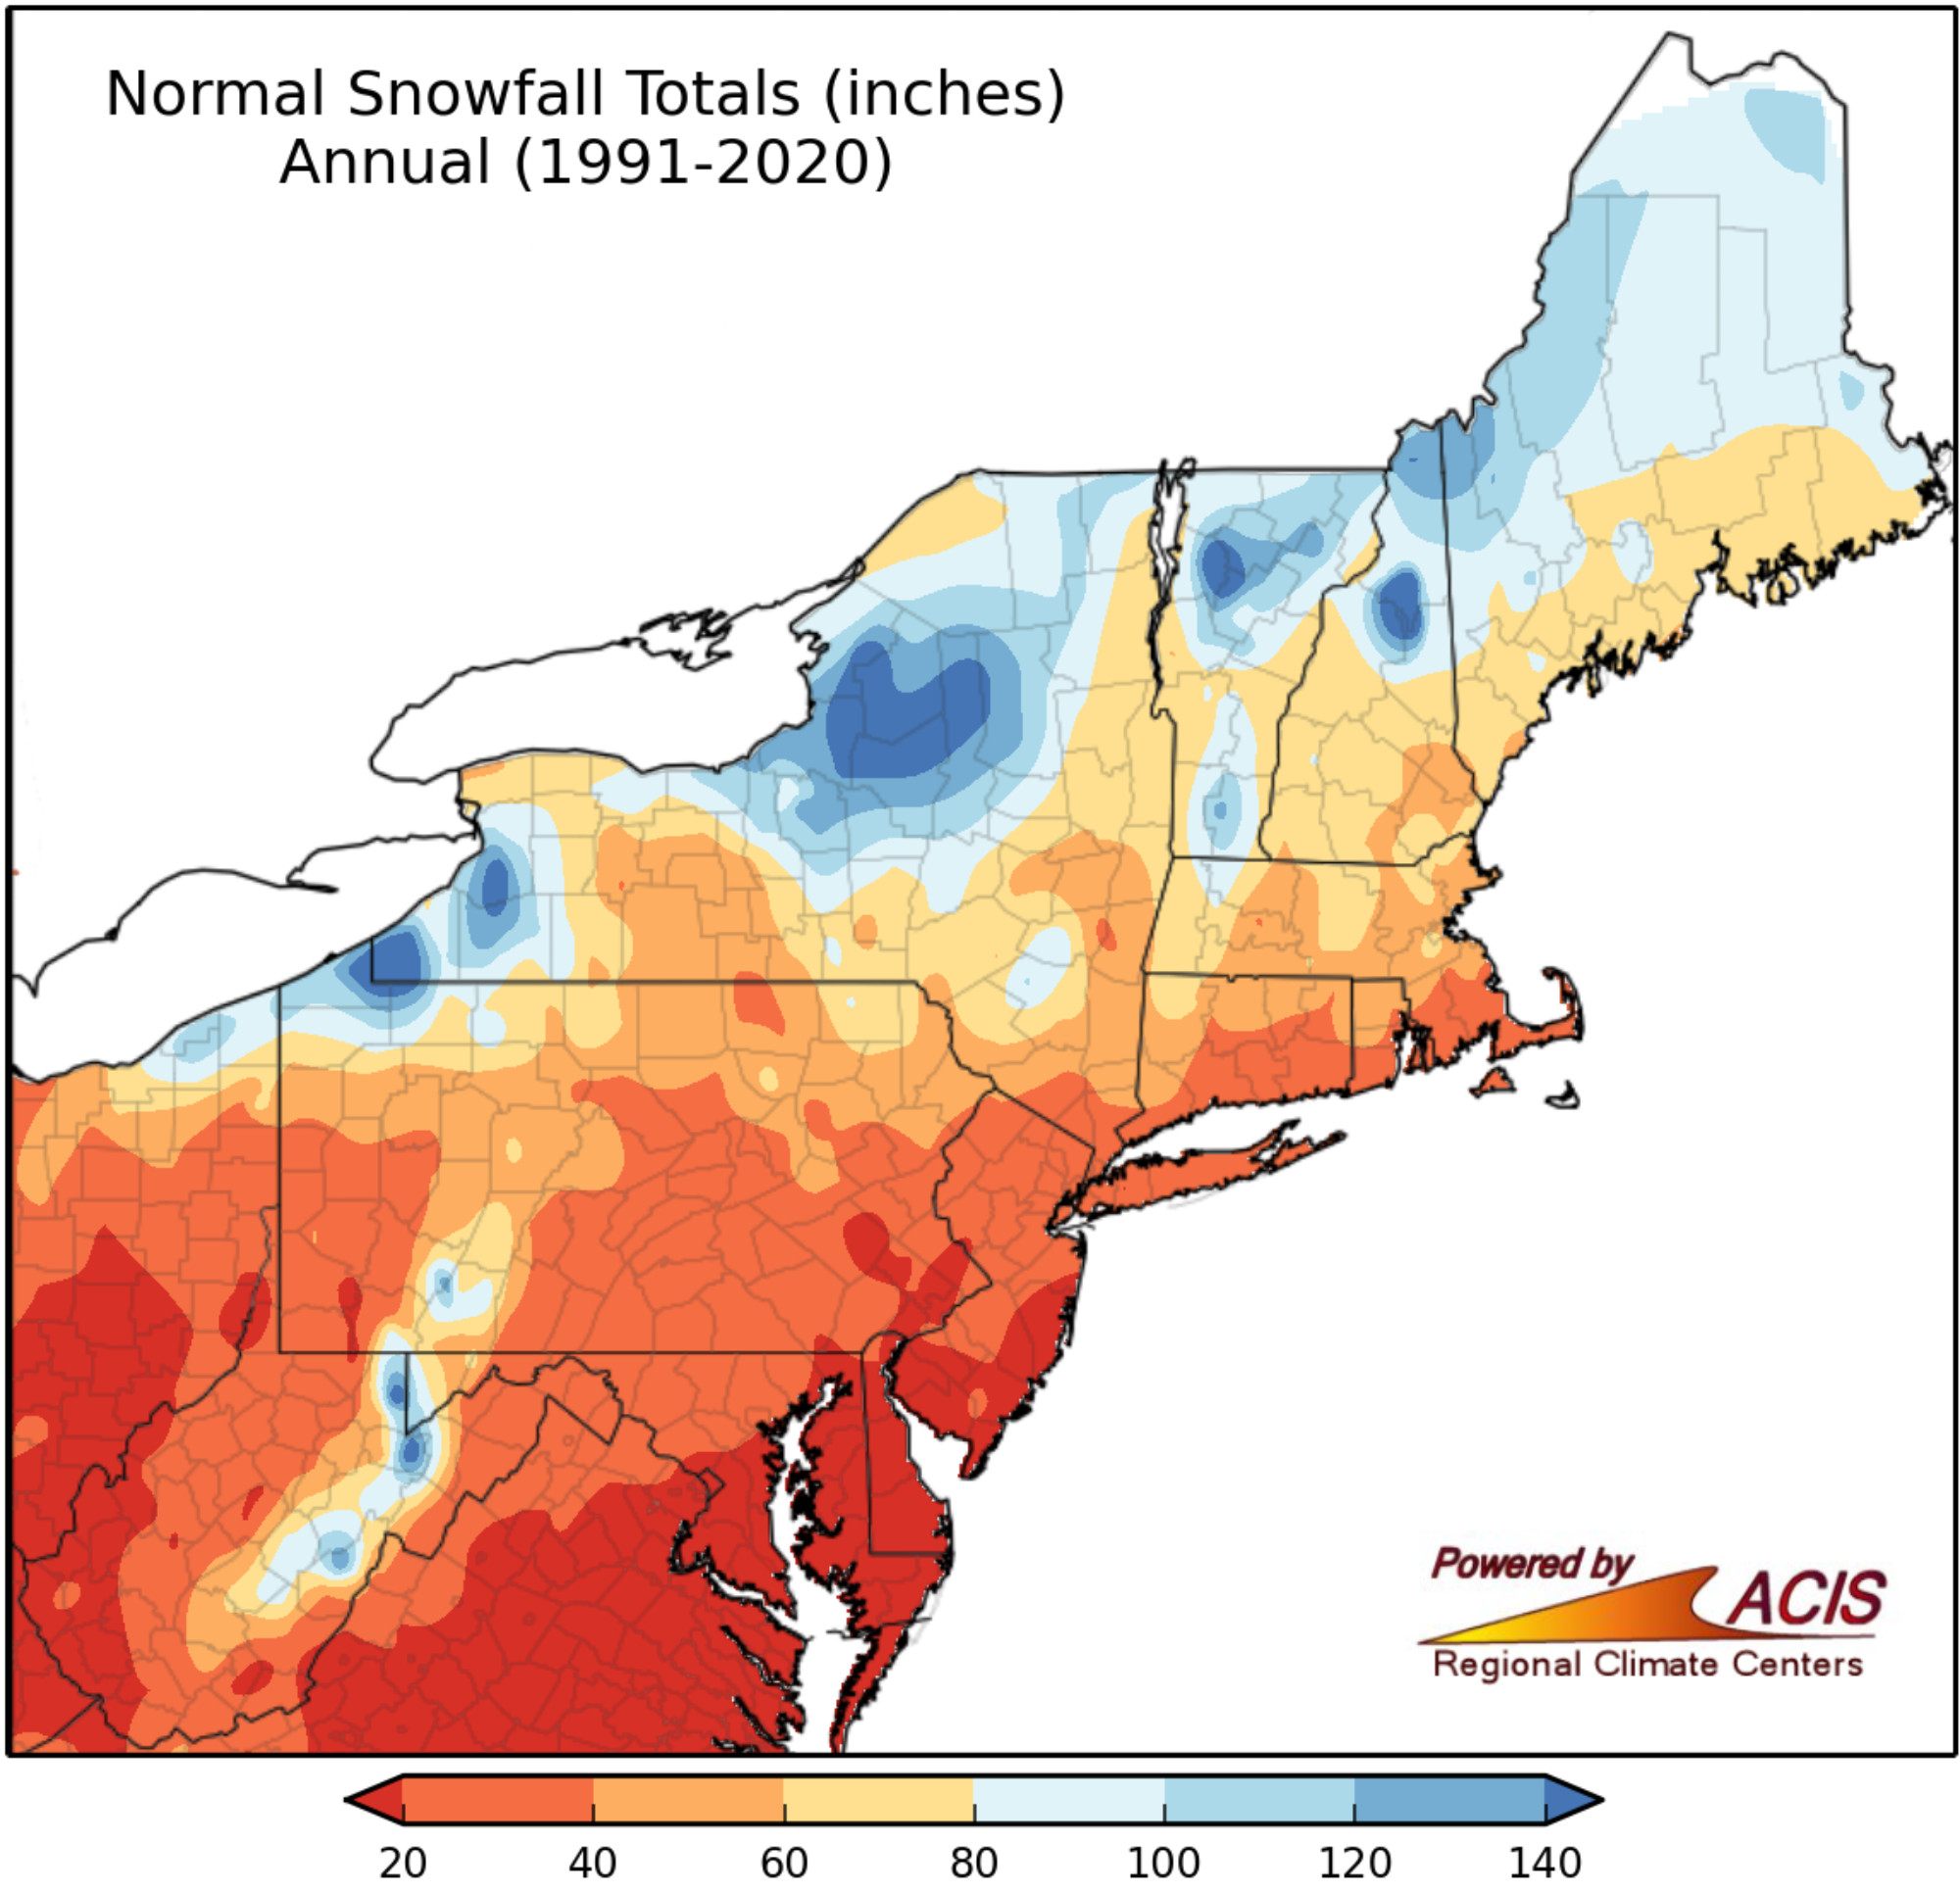
Map of Northeast U.S. total annual snowfall, averaged over the thirty-year period of 1991-2020. Map: Northeast Regional Climate Center at Cornell University, Climate Normals Maps
Severe weather
In part because of its temperature variation and humidity, the Northeast experiences nearly every variety of severe weather. This includes hurricanes, heat waves and cold snaps, droughts, floods, blizzards, and tornadoes.
Hurricanes
In the summer and fall, tropical cyclones (hurricanes) often bring heavy rains to the Gulf and Atlantic coasts. While the Northeast experiences fewer hurricanes than the Southeast, some hurricanes do work their way up the Atlantic Coast from the Southeast and impact coastal and even inland areas of the Northeast, either as hurricanes, tropical storms, or just remnants of these systems that may produce heavy rainfall. In 2012, Hurricane Sandy devastated communities on the mid-Atlantic coast, and rainfall from Hurricane Irene in 2011 led to severe flooding inland as well as major damage along the coast. Thirteen people died in New York City as a result of flooding from Hurricane Ida in 2021.
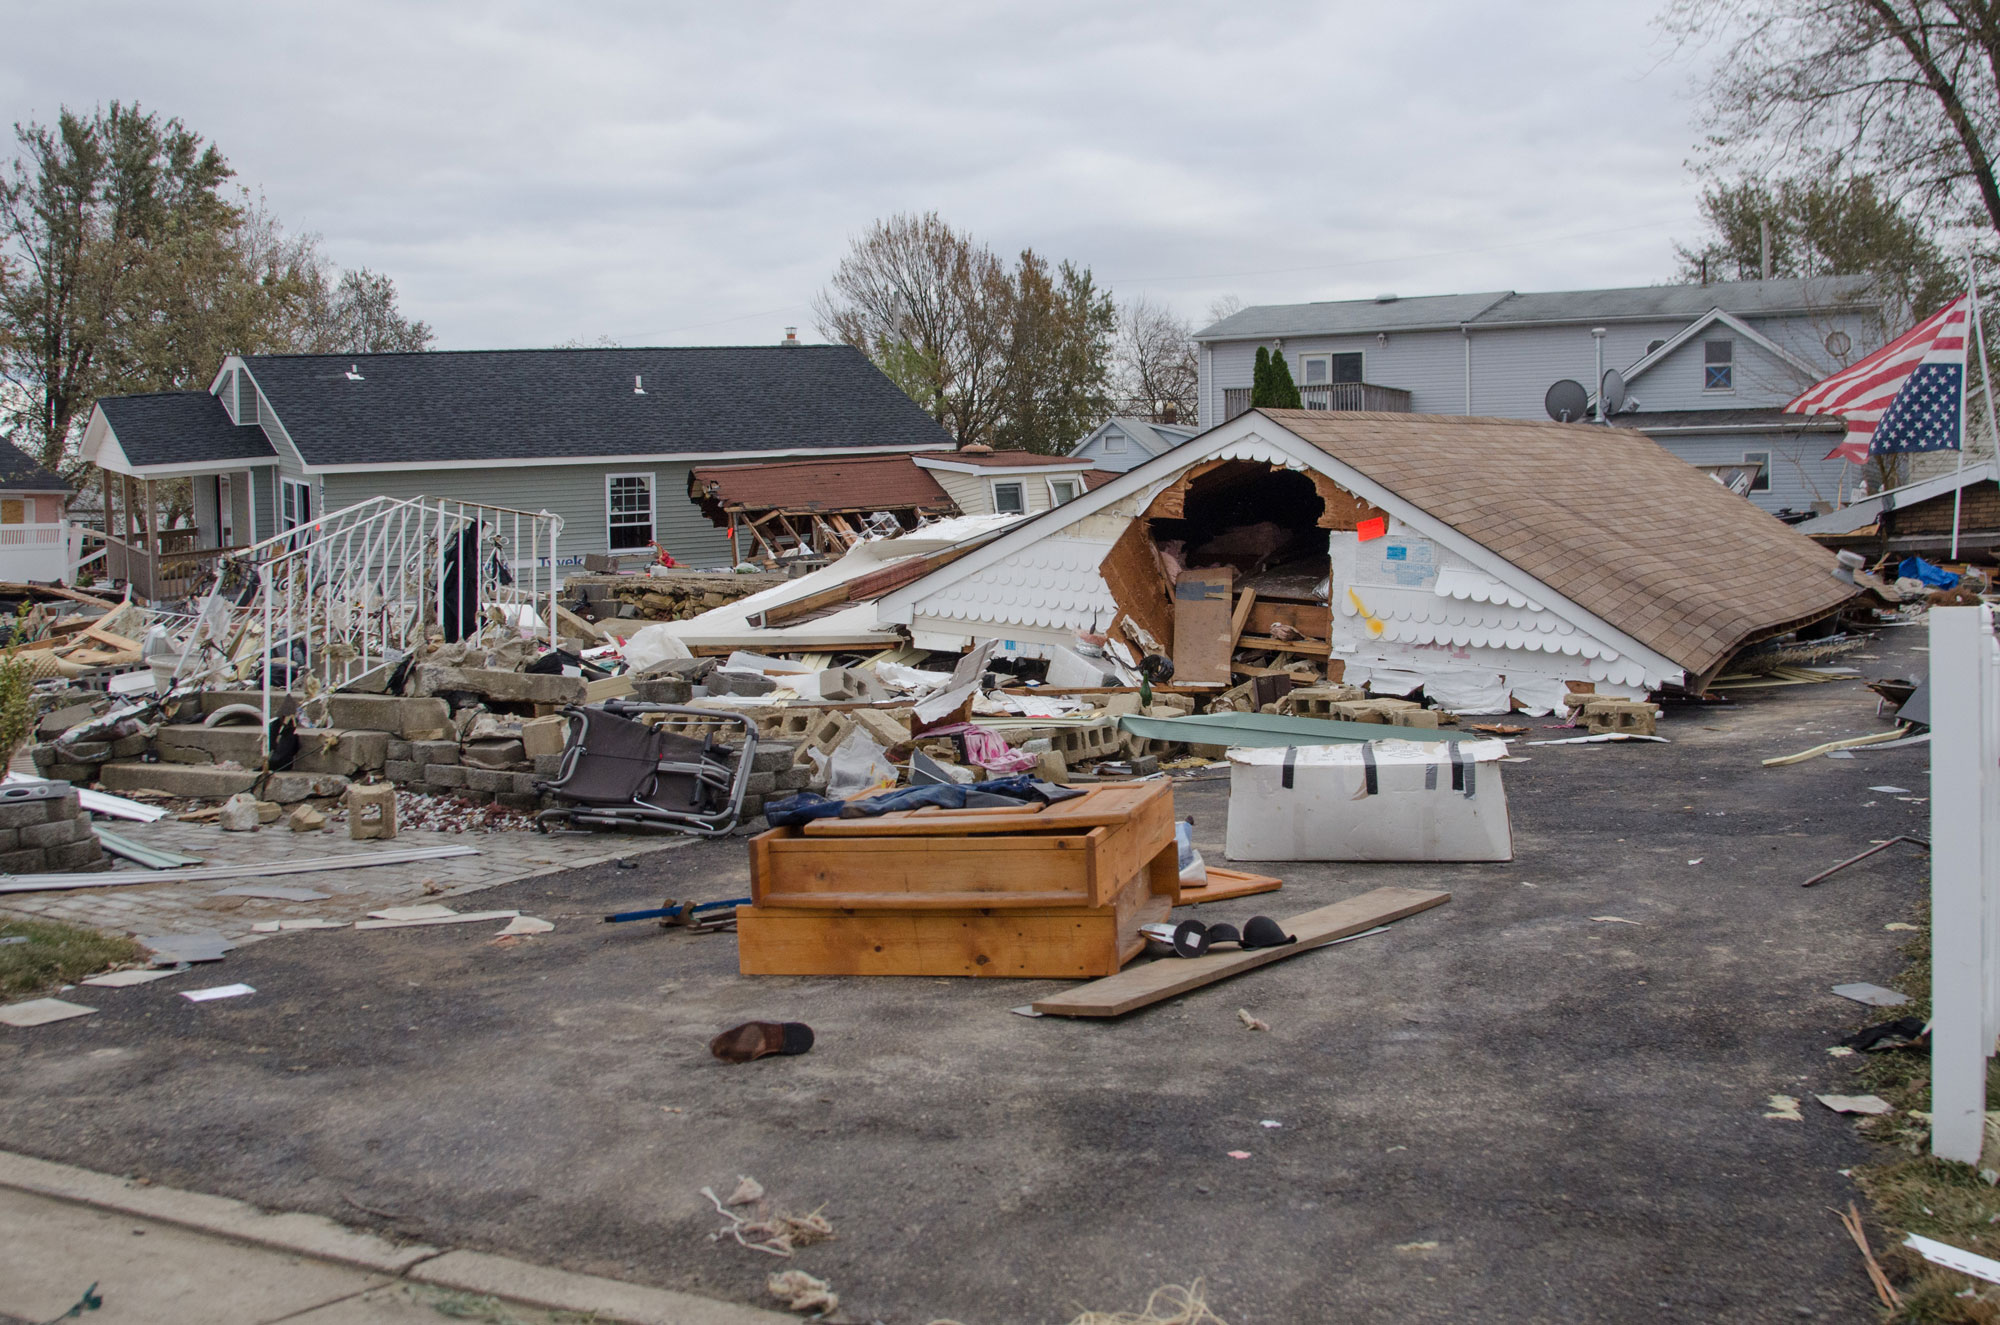
Damage from Hurricane Sandy in Union Beach, New Jersey, November 4, 2012. Photo by Liz Roll/FEMA (National Archives Identifier 24475303, unrestricted use).
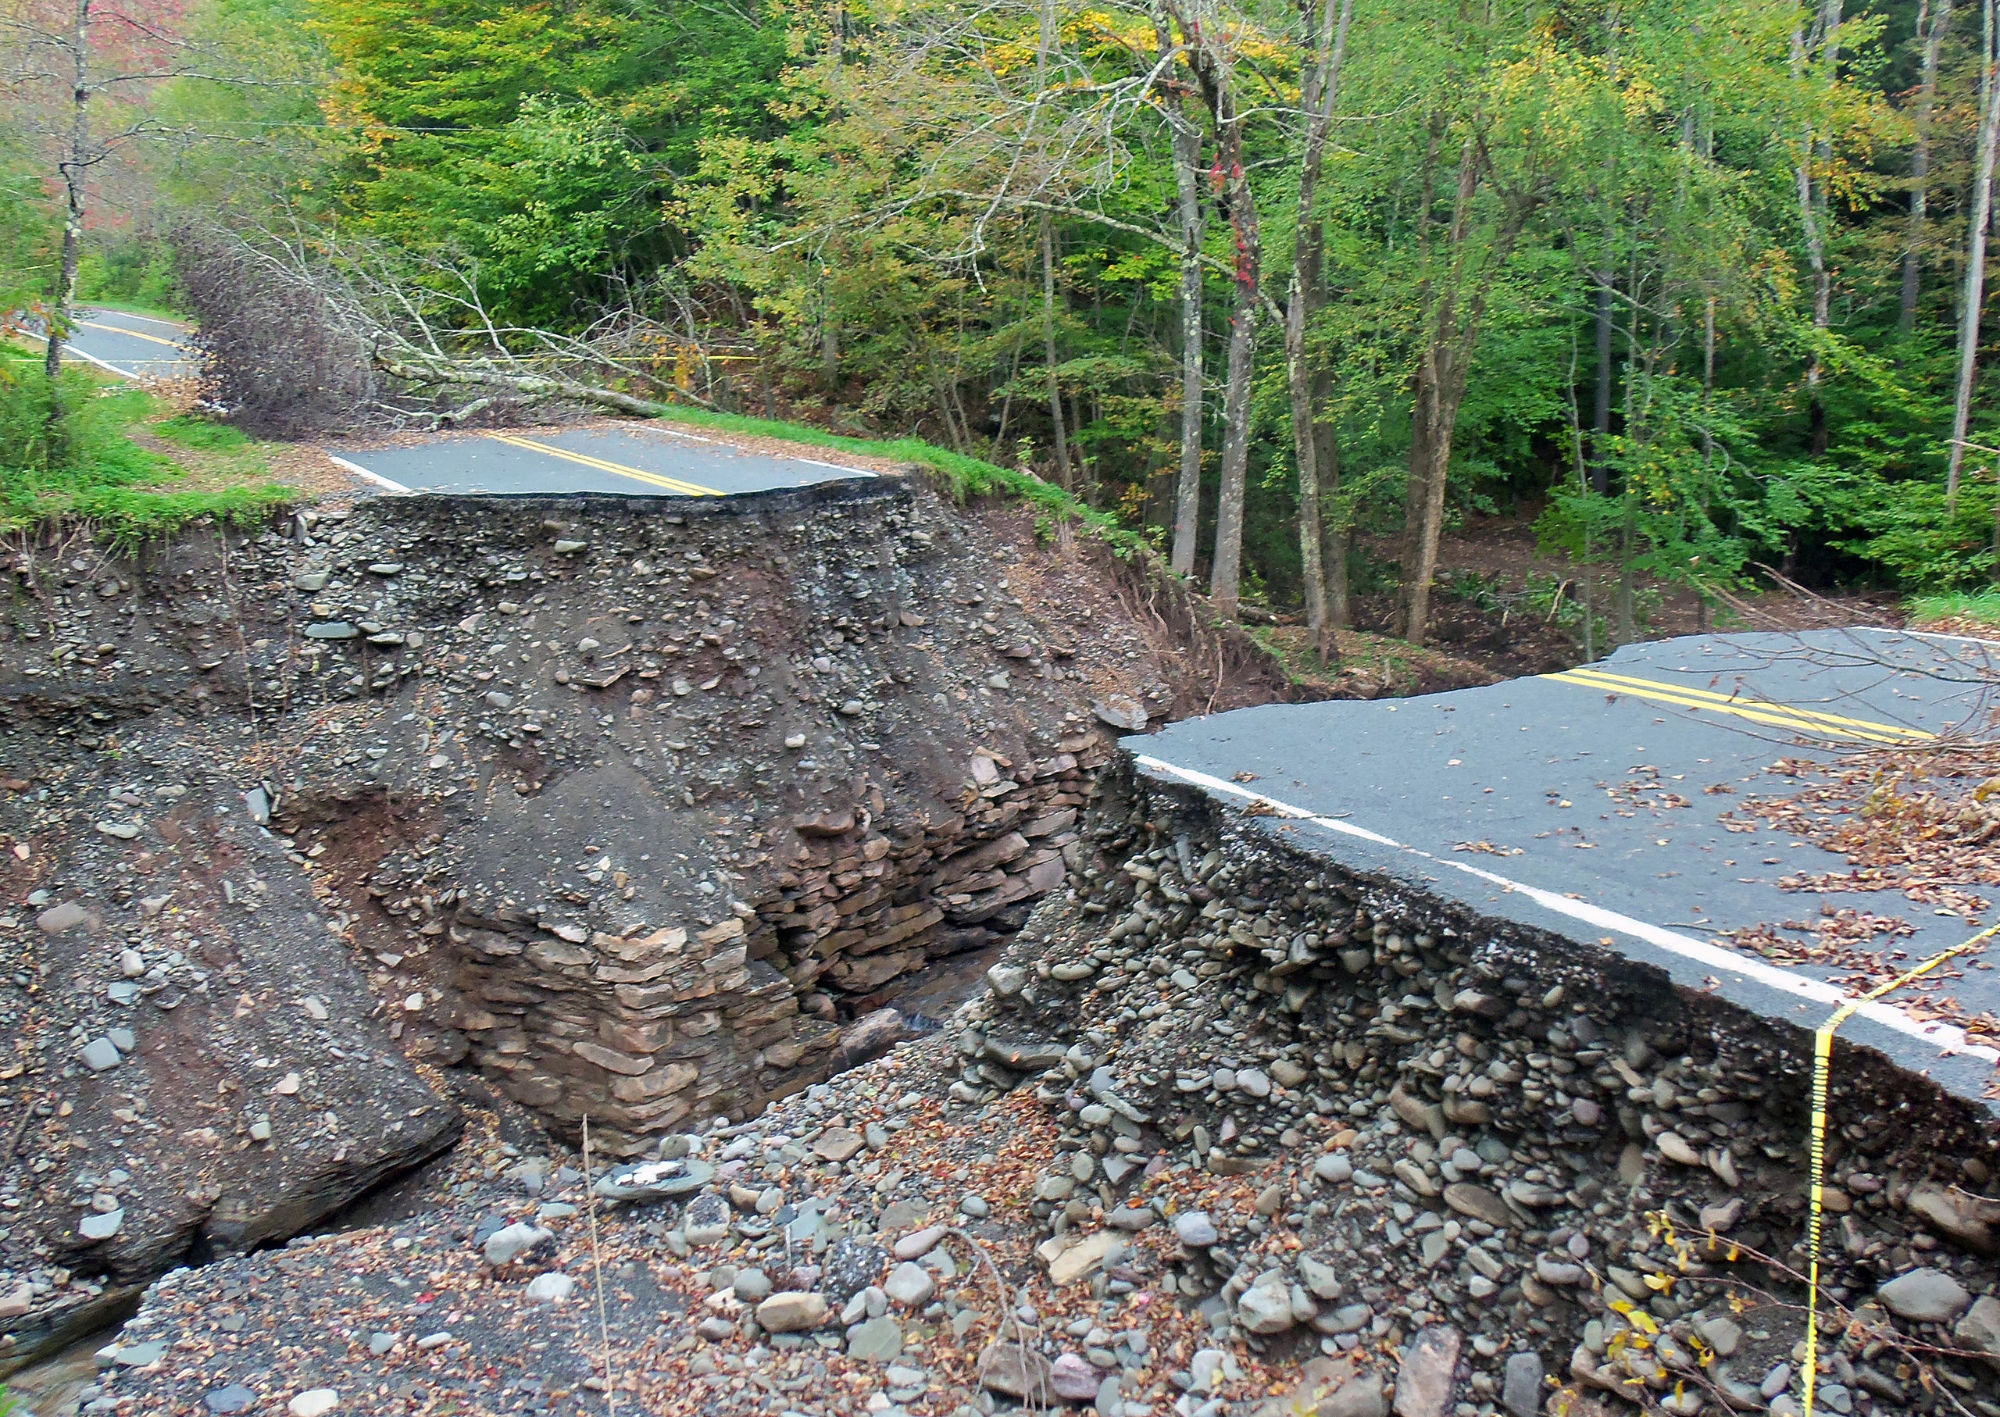
Deep gorge created in Ulster County, NY Route 47 when floods after Hurricane Irene blew out a culvert below the road, in Oliverea, NY. Photo by Daniel Case (CC BY-SA 3.0) via Wikimedia Commons.
Polar jet stream and winter storms
Harsh winter storms are a fact of life in the northeastern U.S. These storms are carried in by the polar jet stream, which typically falls near or over the area, especially in the winter. Jet streams—more than one exists—are narrow bands of fast moving air high above Earth's surface. The Earth’s rotation drives these rivers of air and causes them to blow from west to east. Jet streams are typically found between 6 and 13 kilometers (4 and 8 miles) above the surface and can move at speeds tens to hundreds of kilometers (miles) per hour.
"The Polar Jet Stream." Video description: Animation of the Earth showing the north polar jet stream. The video starts with a view centered on the north pole, with the jet stream encircling it in a sinuous wave. The Earth then turns to center on North America, showing the jet stream taking an ever-changing, sinuous route over Canada and the northern United States. Video by NASA Scientific Visualization Studio (via YouTube).
Because jet streams separate warm and cold air masses, their movements influence the weather. Polar jet streams are typically found between 50° and 60° North and South latitude, and subtropical jet streams are typically found around 30° North and South latitude. As the boundaries between hot and cold air are sharpest in the winter months, jet streams are stronger in the winter.
In the northeastern states, the polar jet stream combined with lake effect snow (discussed below) strongly impacts the area’s weather. In addition, Nor’easters—severe winter storms that regularly batter the Northeast—can form when cold polar air mixes with warm moist air from the Atlantic Ocean.
All of the states of the Northeast experience winter storms to some extent, during which several inches of snow falls. While inconvenient and damaging to infrastructure, these storms do not frequently cause widespread disruption, as residents and governments are usually prepared to clear roads and repair damage. Additionally, schools have snow days calculated into their schedules. Ice storms can be more dangerous; as rain freezes to trees, power lines, and rooftops, they may collapse under the weight. If you are able to free your car, the icy roads are even more dangerous to drive on than snowy ones.
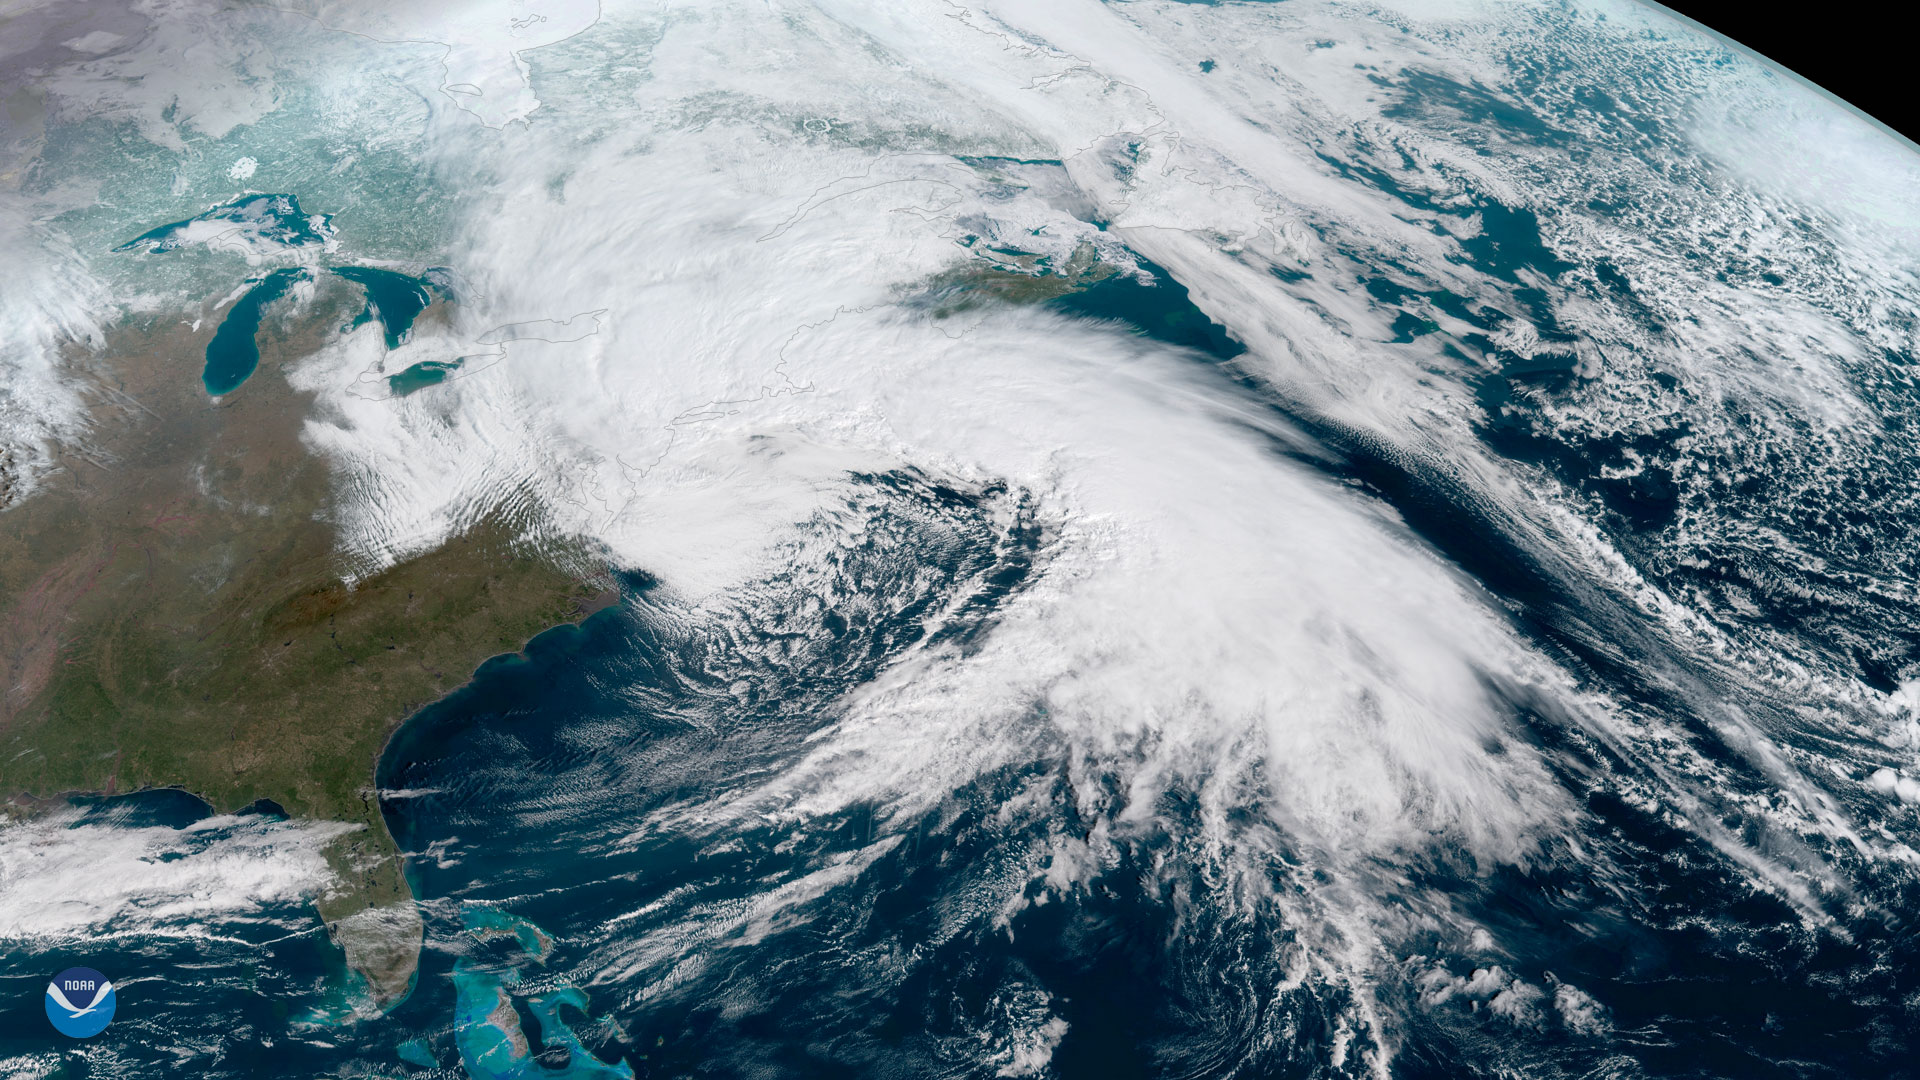
A Nor'easter brings wind and snow to the Northeast on March 2, 2018. Photo by NOAA's GOES East satellite (NOAA Satellites on flickr, public domain).
The polar vortex
The polar vortex is a pattern of winds around the North Pole, including the polar jet stream. In the winters of 2013–2014 and 2014–2015, the polar vortex shifted southward, bringing unusual weather patterns to much of North America. Weaker polar vortices can occur when weather near the pole is warmer than usual, and a weak polar vortex allows for a wandering jet stream. Some climate scientists believe the unusual winters of recent years are explained by natural variations, while others suggest that they could be driven due to decreases in sea ice and faster increases in Arctic temperatures when compared to areas at lower latitudes.
"NASA's AIRS Sees Polar Vortex Behind U.S. Big Chill." Video description: Video shows an animation of a globe with a view of North America. Color coding indicates temperature in degrees Kelvin. The polar vortex is indicated by dark blue to purple, and reaches as far south as the northern United States, especially the northwest-central and Great Lakes regions. Video by airsnews (via YouTube).
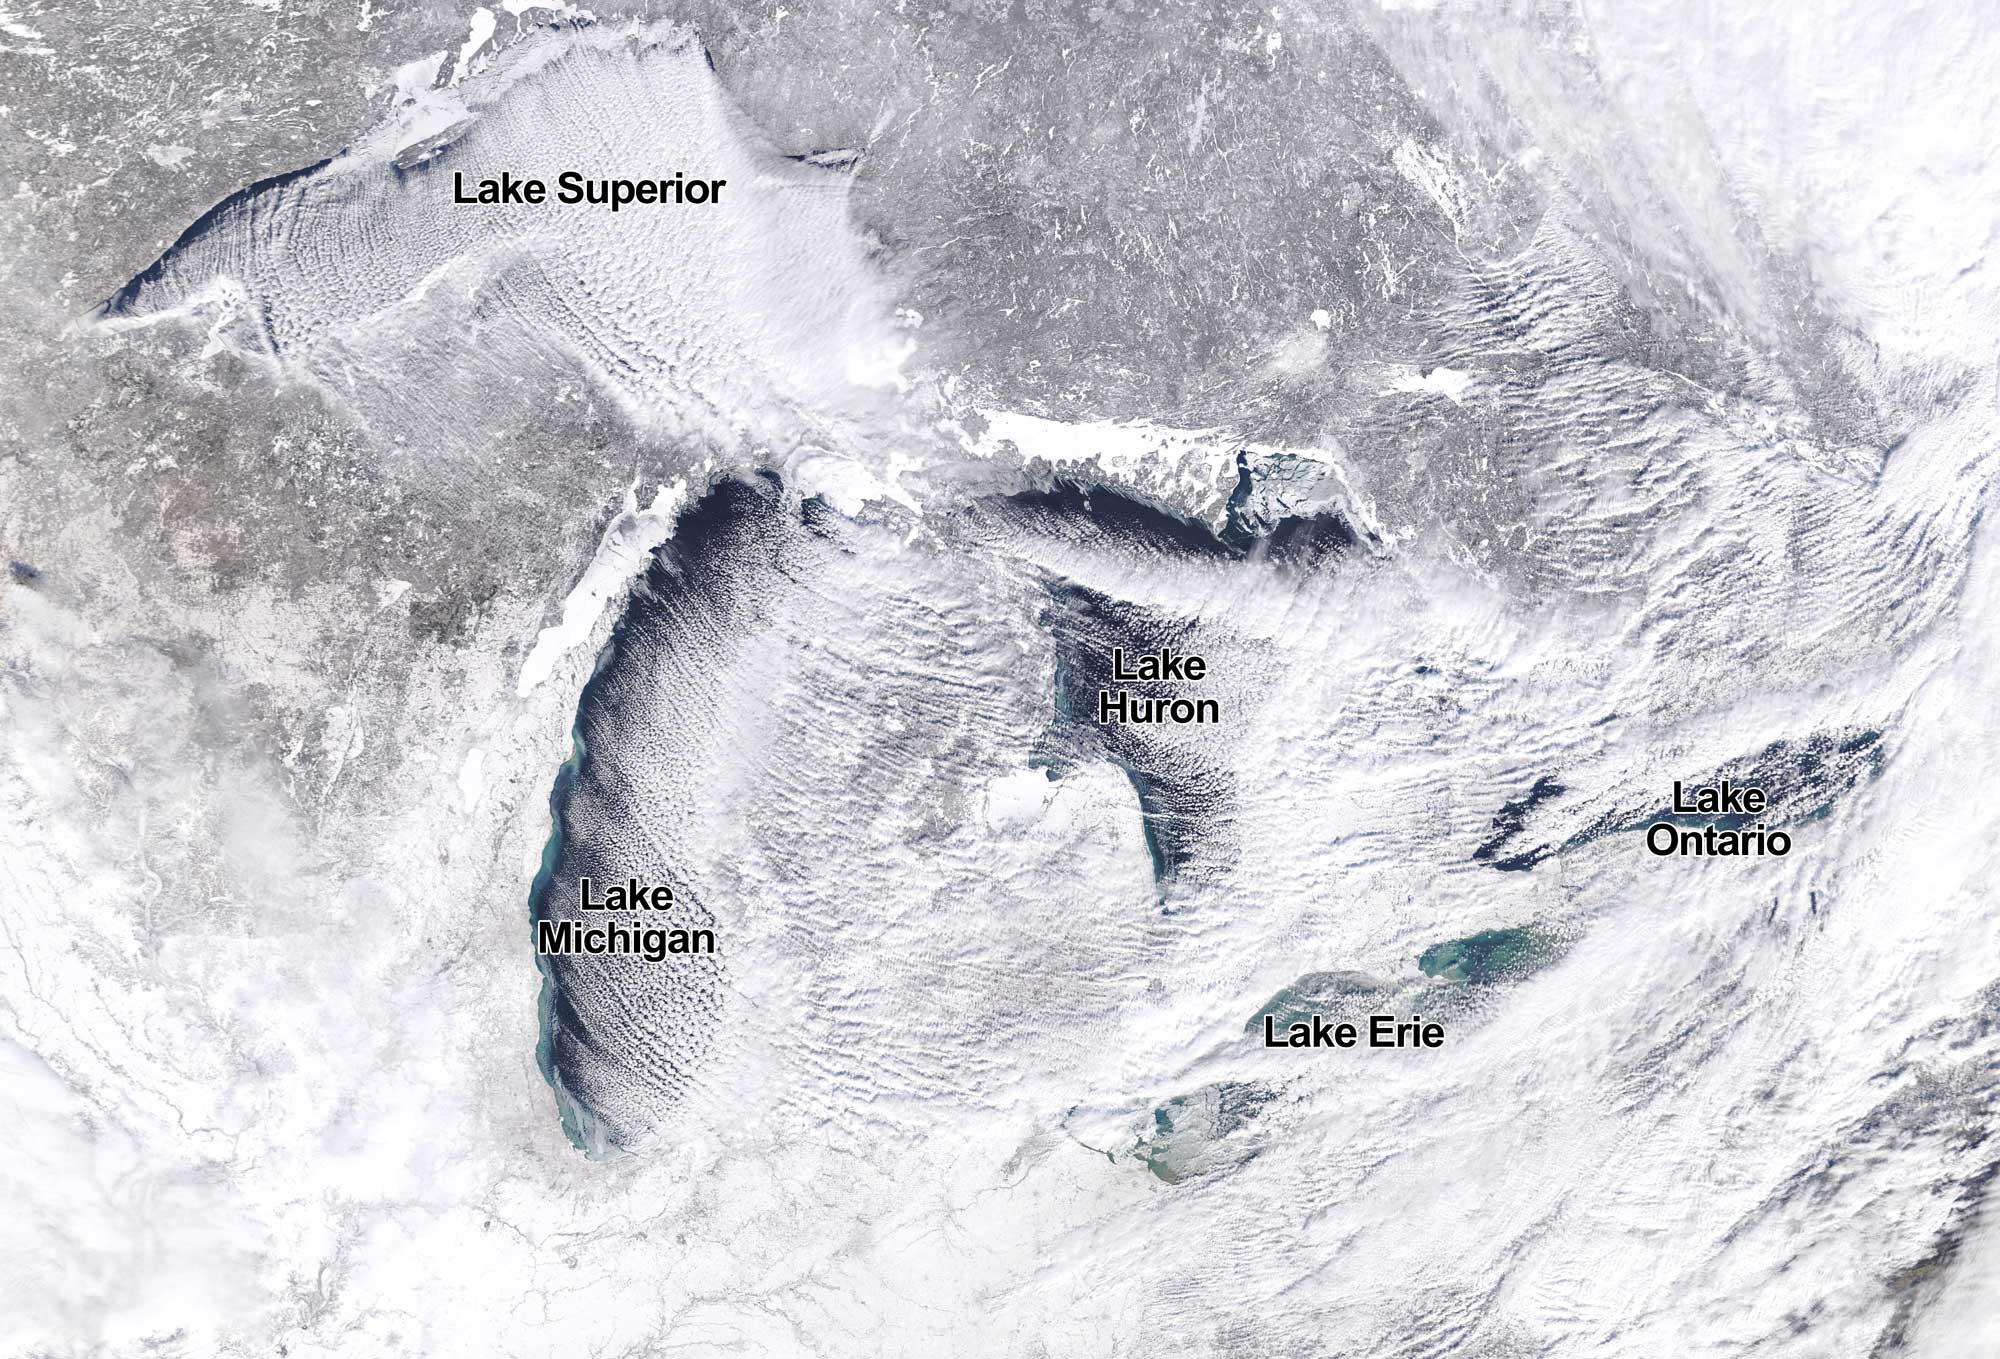
Satellite image showing the Great Lakes region of the United States and Canada during a polar vortex, January 27, 2019. The streaks of snow coming off the Great Lakes are "cloud streets" indicative of lake effect snow. Source: NASA Earth Observatory image by Josh Stevens (used following NASA's image use policy).
Lake effect snow
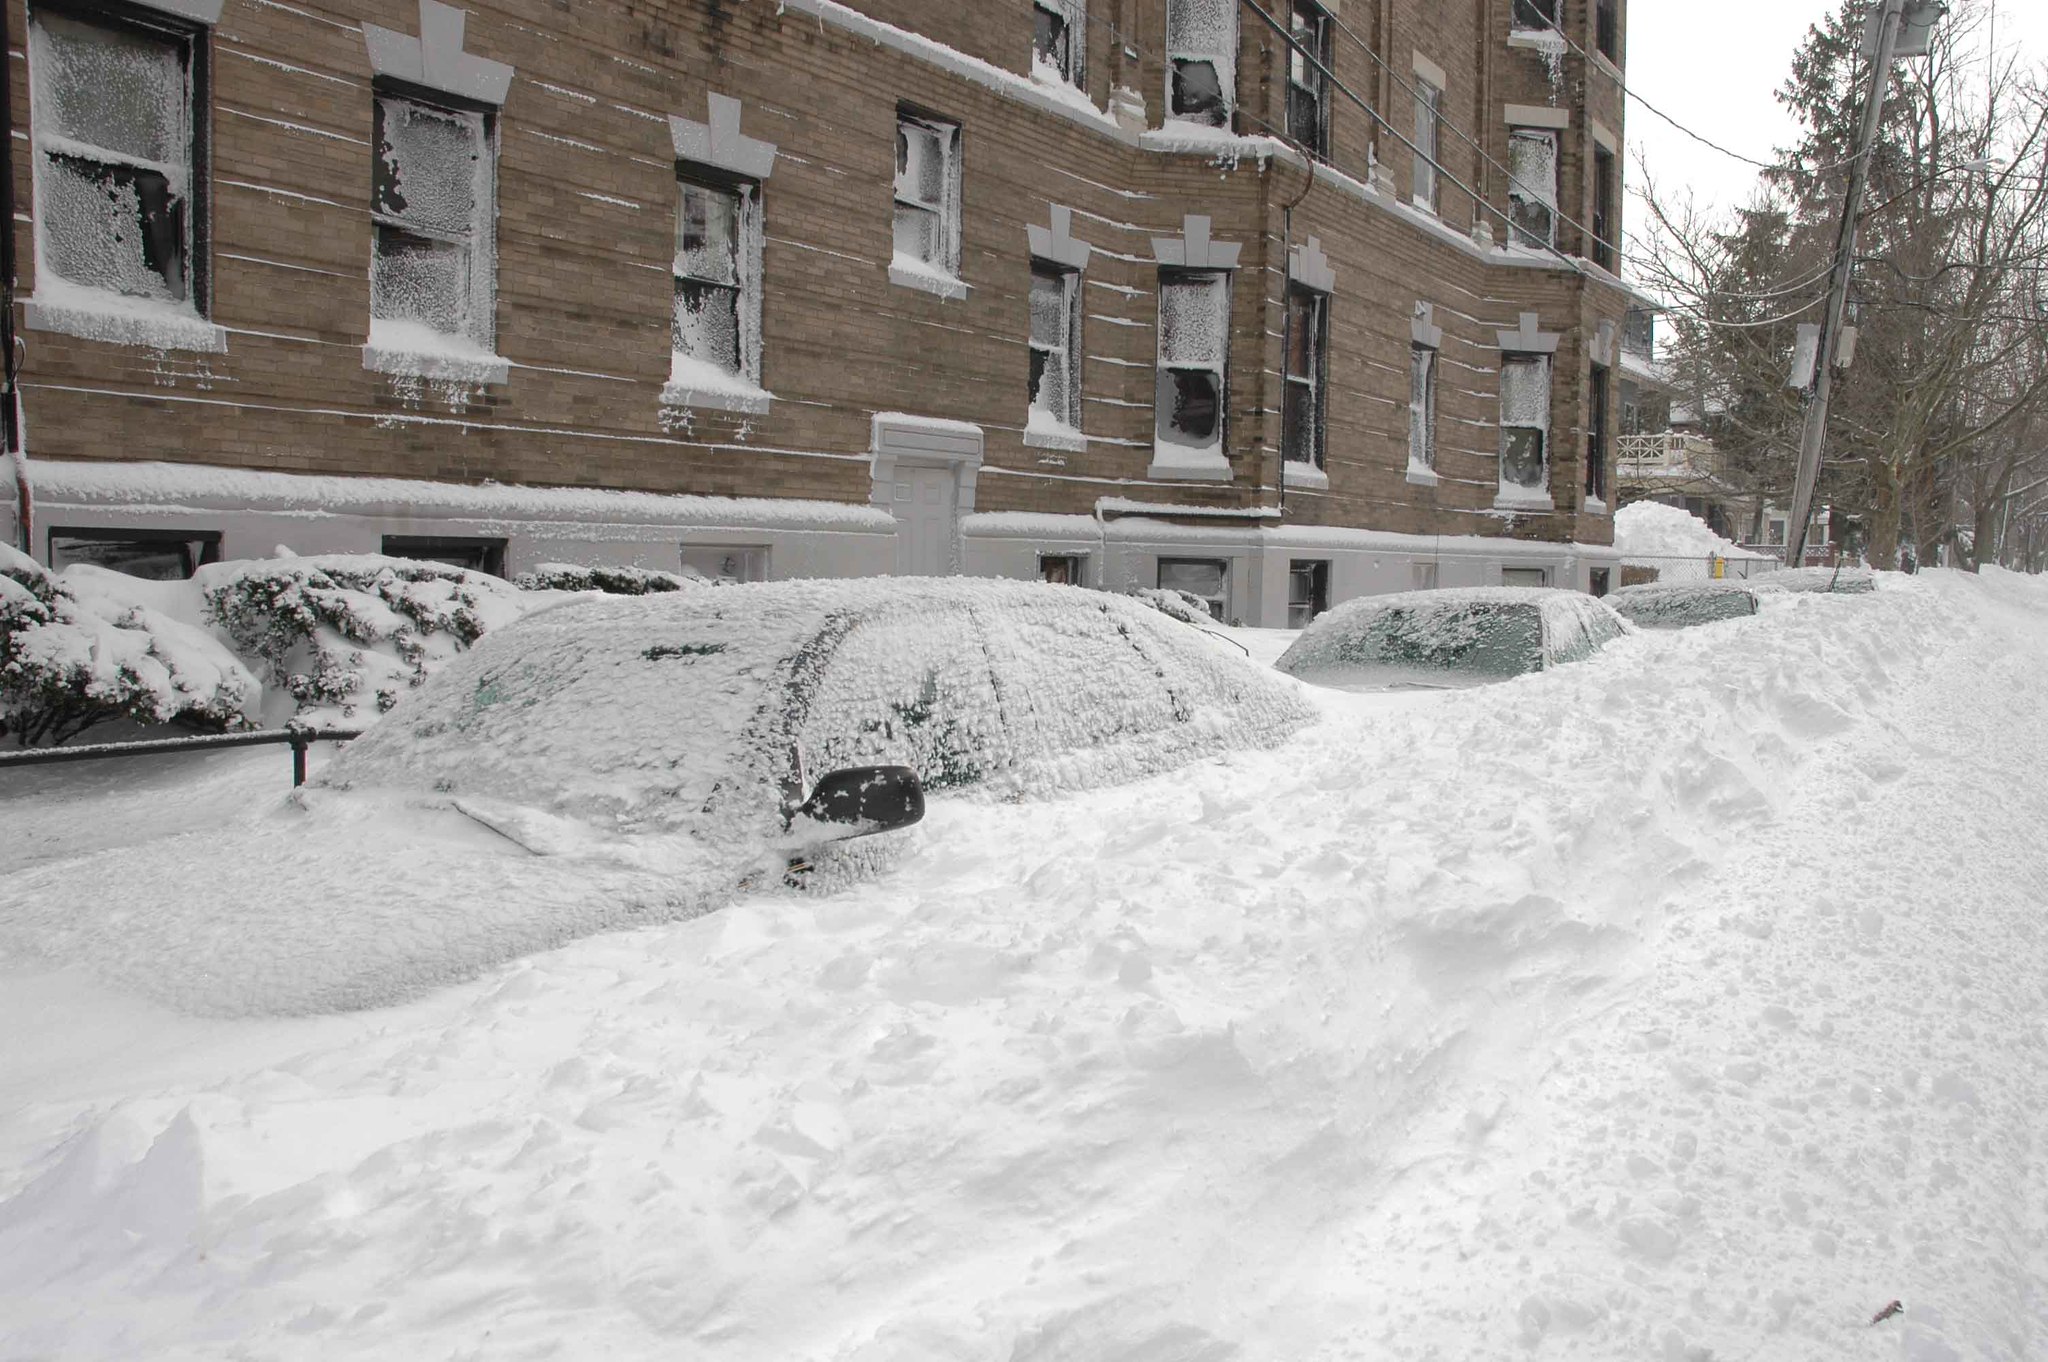
The Great Lakes and Lake Champlain produce lake-effect snow. During the winter, the large volume of water in the Great Lakes and Lake Champlain act as a reservoir of heat, making the air above it relatively warm and humid. When cold air moves across the warmer lake, convection begins, and a storm can form. The moisture from the lake begins to precipitate as snow soon after the air cools. The town of Montague, New York lies east of Lake Ontario and once received 195 centimeters (77 inches) of snow during a 24-hour period in 1997, an astonishing amount for a non-mountainous area. Parts of the Buffalo, New York, area received as much as 224 centimeters (88 inches) of snow during a late November storm in 2014.
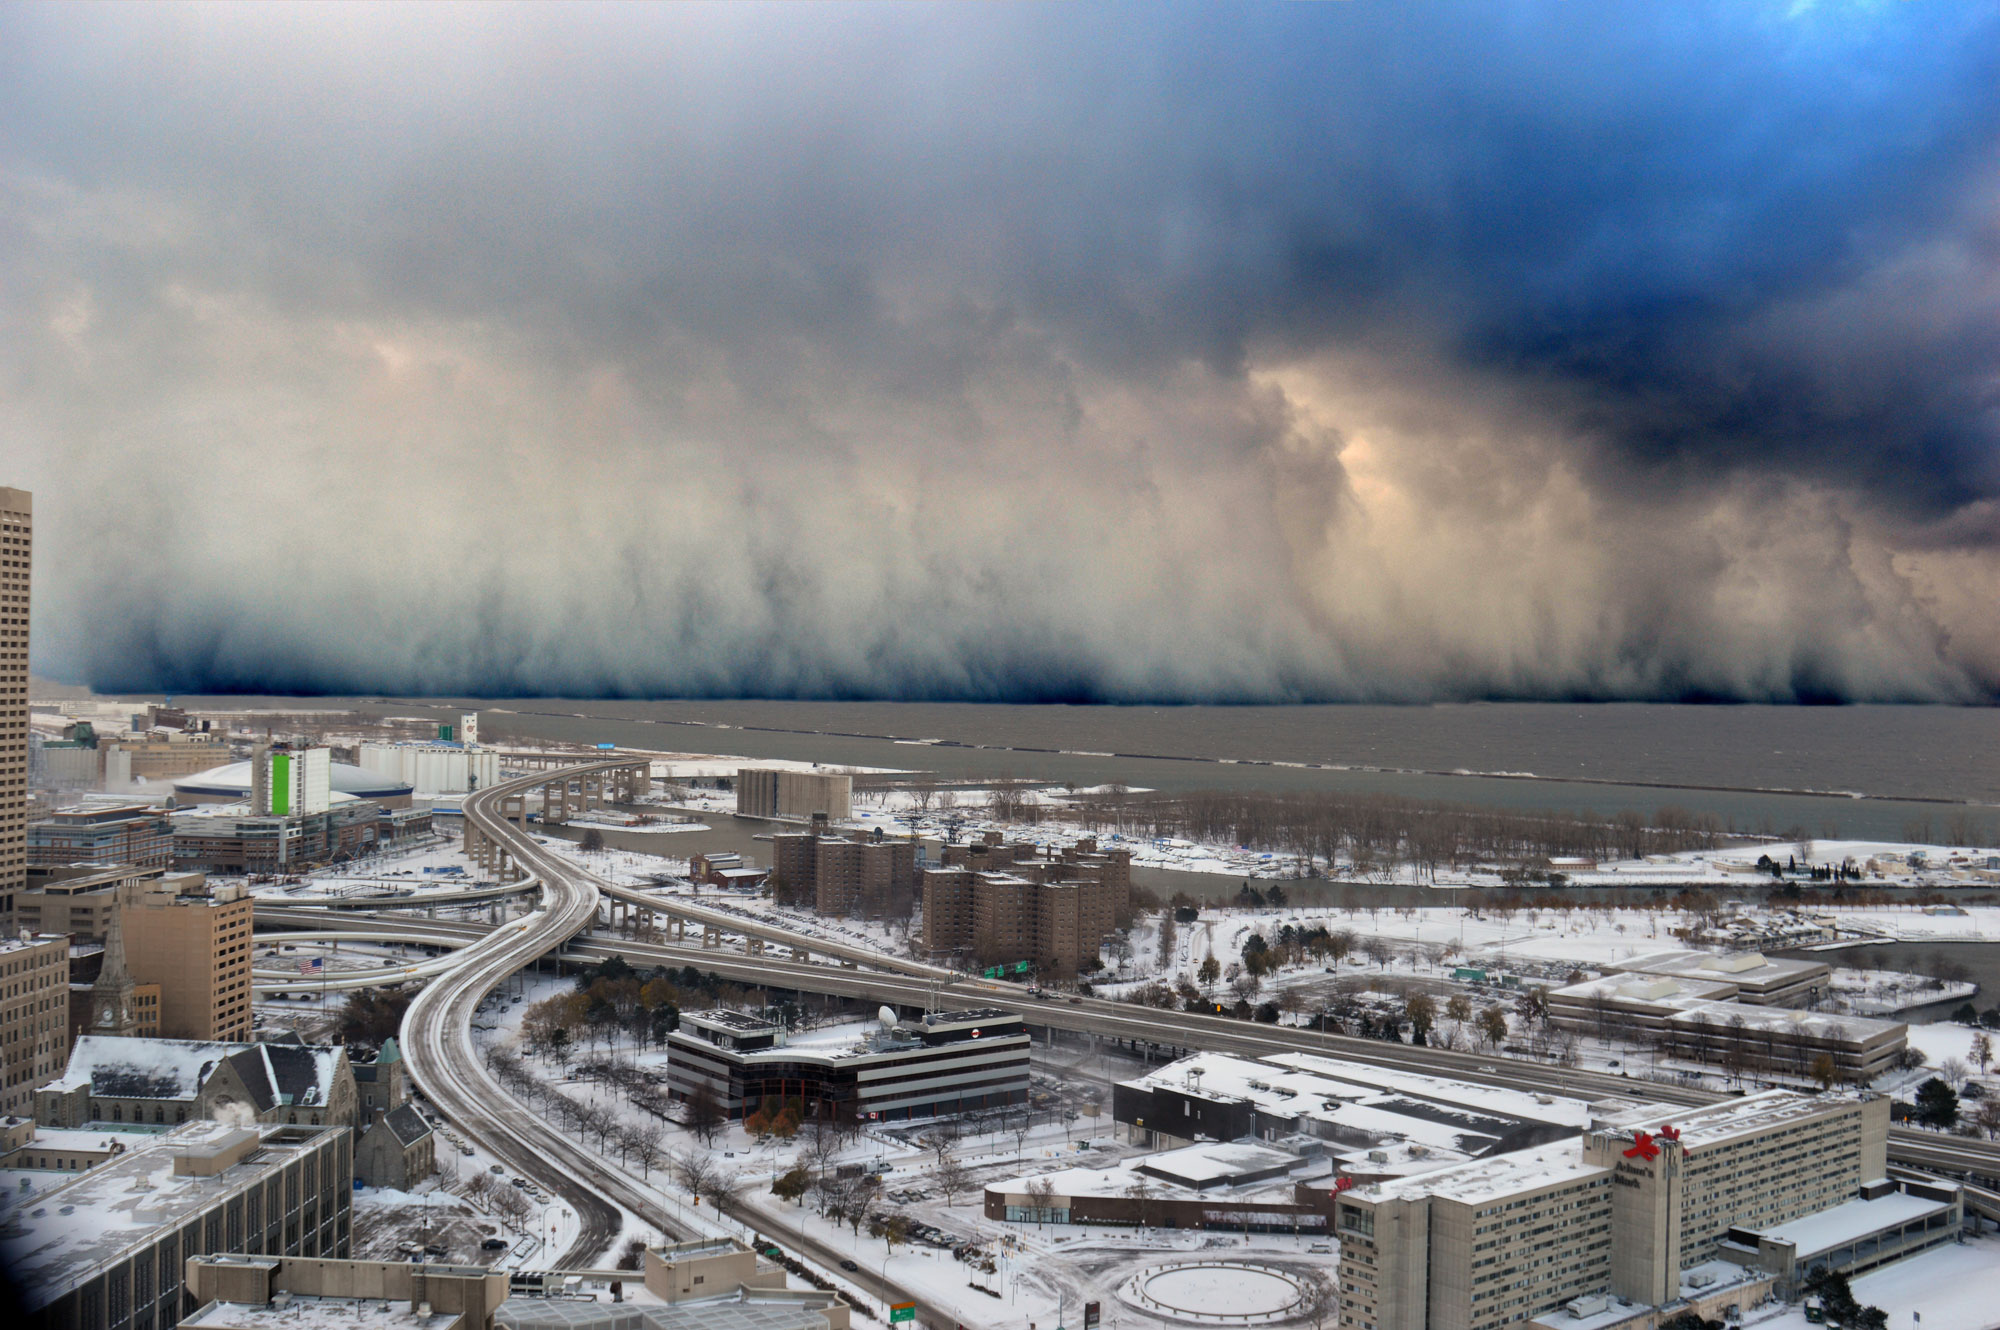
Lake effect snow moving toward Buffalo Southtowns, western New York, from Lake Erie, November 2014. Photo by Shawn Smith (NOAA Photo Library on flickr, Creative Commons Attribution 2.0 Generic license, image resized).
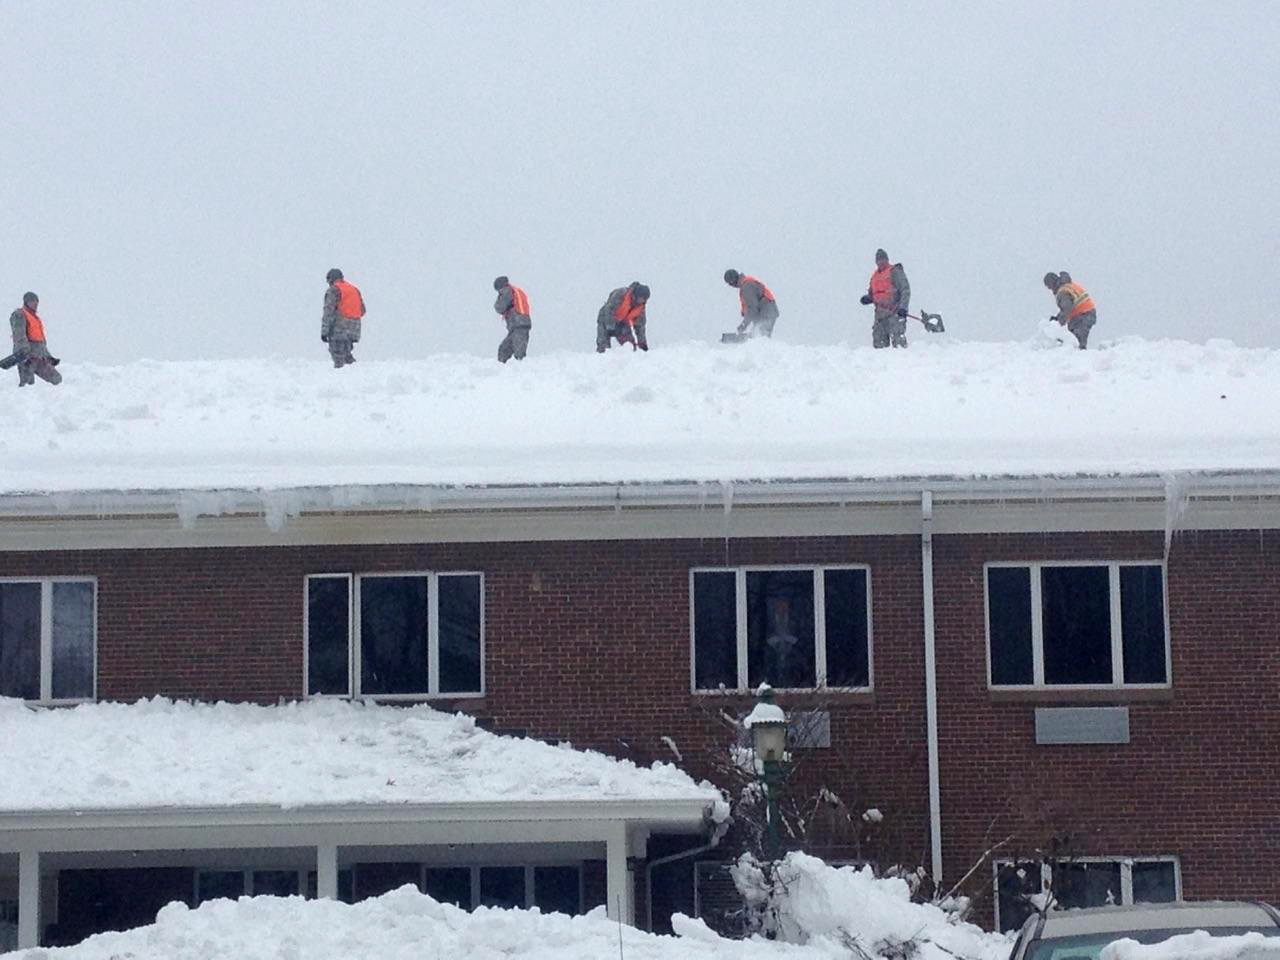
Original caption: "New York Army National Guard Soldiers from Company A, 427th Brigade Support Battalion, based in Rochester, assist in snow removal from the roof of the Absolut Care assisted living senior care center in Orchard Park, New York November 22 [2014]. " Photo source: New York National Guard on flickr (Creative Commons Attribution-NoDervis 2.0 Generic license).
Past climate of the northeastern U.S.
This section covers the climate of the northeastern U.S. through the Phanerozoic, from about 541 million years ago to the recent. For the climate on early Earth, see the Intro to Climate section.
Paleozoic (541 to 252 million years ago)
Cambrian to Ordovician (541 to 444 million years ago)
At the beginning of the Paleozoic era, climates across the world were warm, and North America was located in the low and warmer latitudes of the Southern Hemisphere. As the Cambrian progressed, North America moved northward; by about 480 million years ago, what would become much of the northeastern U.S. was located between the Tropic of Capricorn and the Equator. Marine invertebrate fossils reveal that most of the area was probably covered by warm, shallow seas from the Cambrian into the Ordovician.
Fossils of archaeocyathids, trilobites, brachiopods, and mollusks reveal that most of the area was probably covered by warm, shallow seas from the Cambrian into the Ordovician. In the late Ordovician (about 460 to 430 million years ago), the Earth fell into a brief but intense ice age. Although sea level dropped during this event, North America's position near the equator kept its climate relatively warm.
Silurian to Devonian (444 to 359 million years ago)
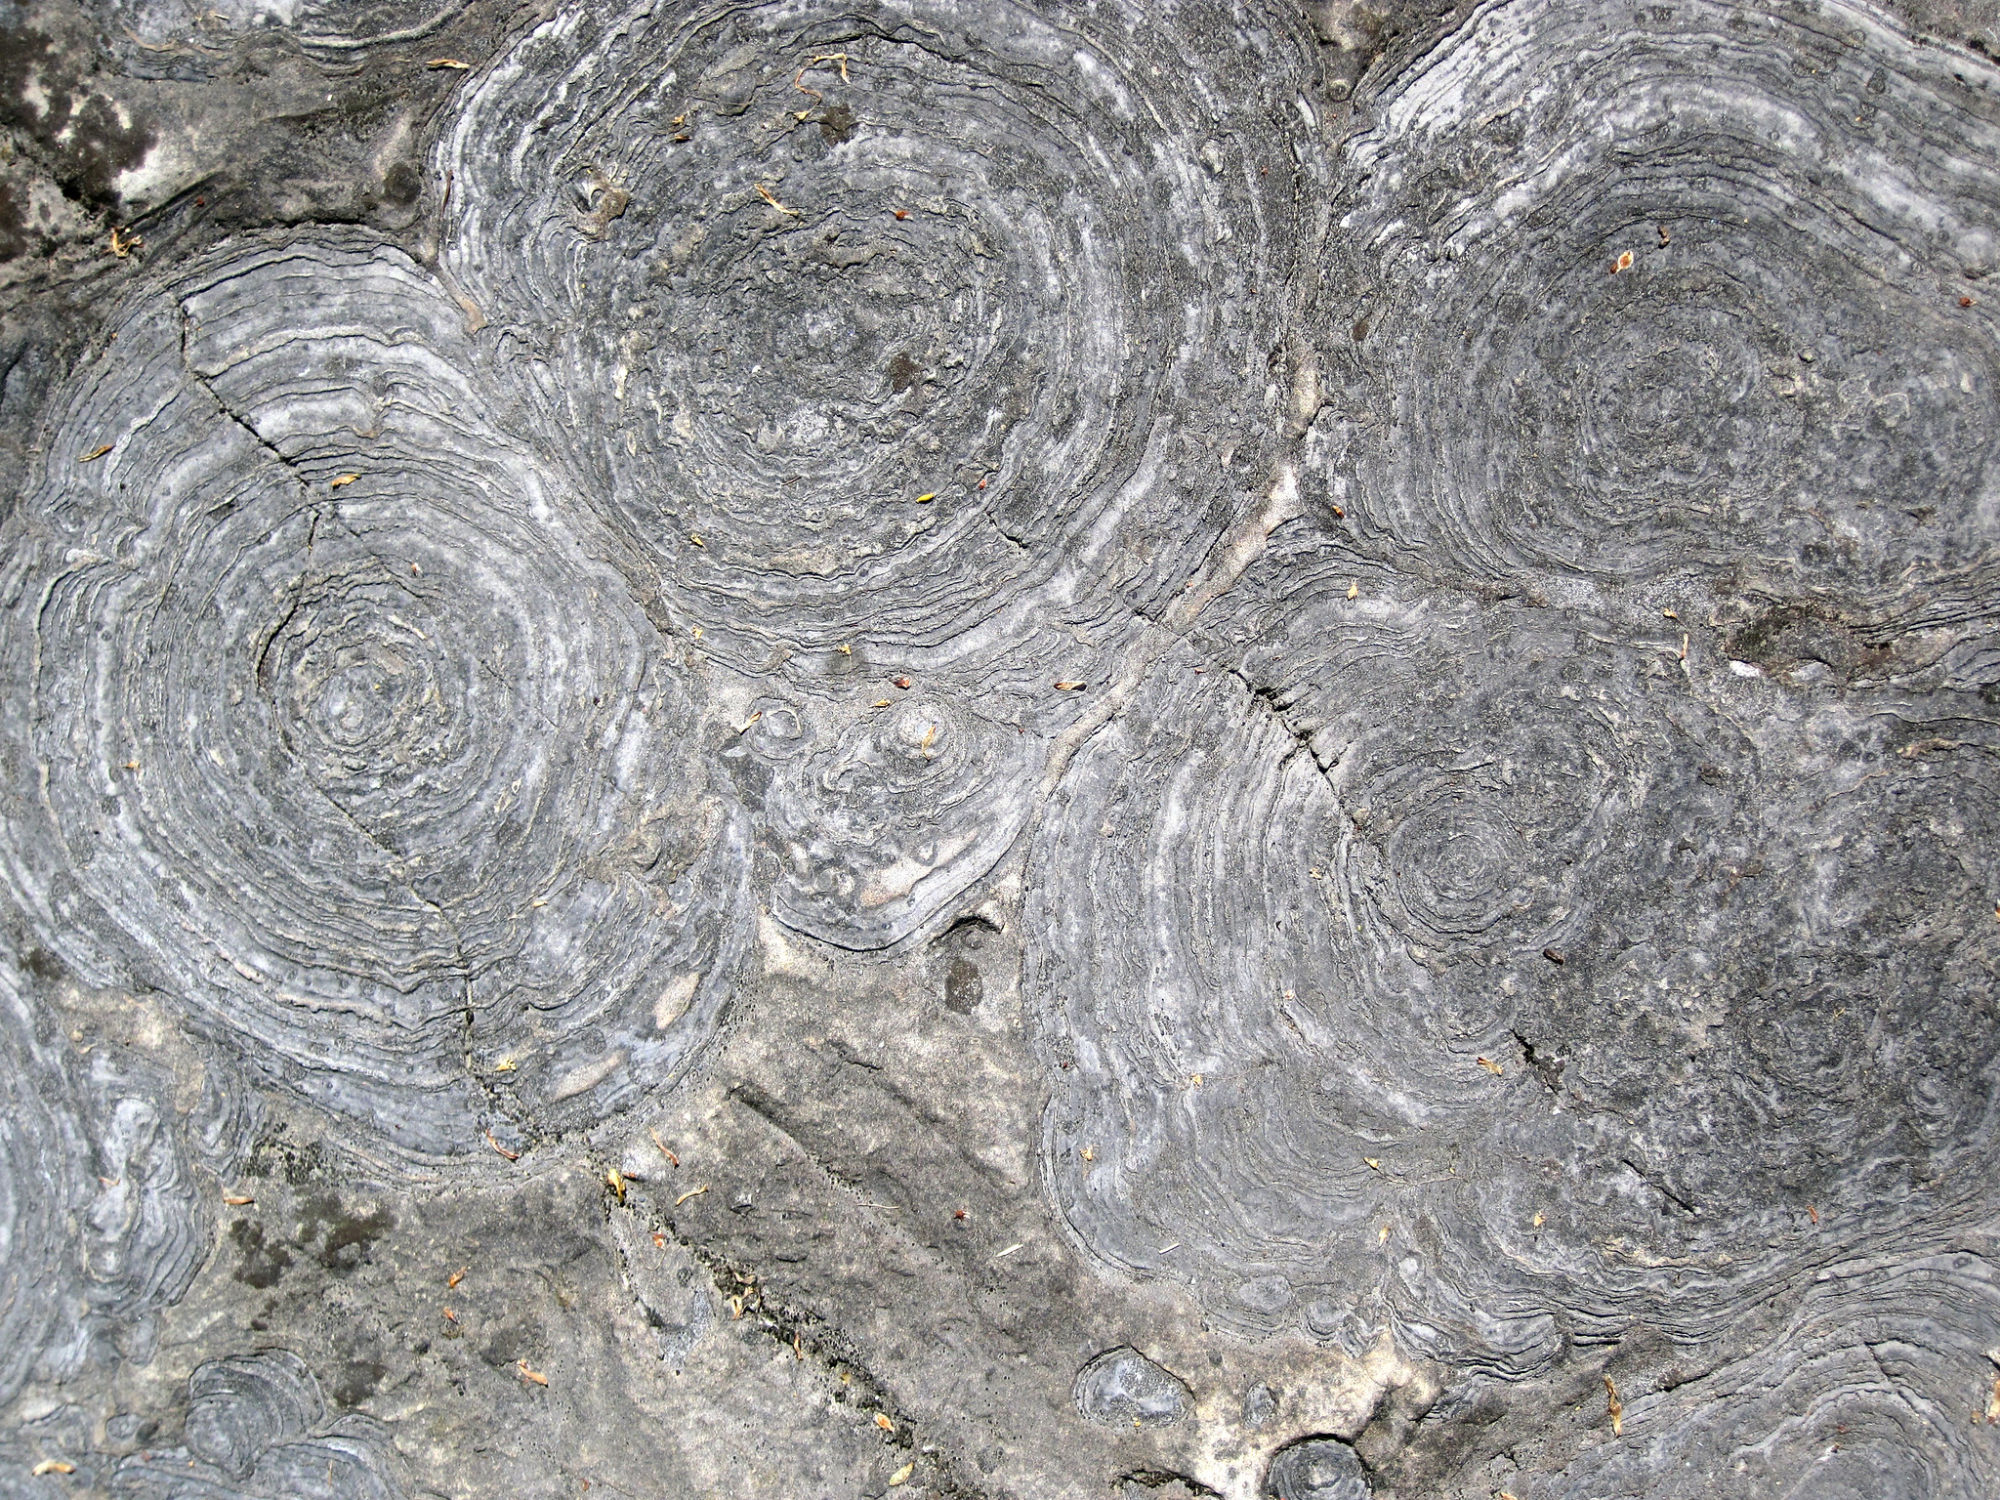
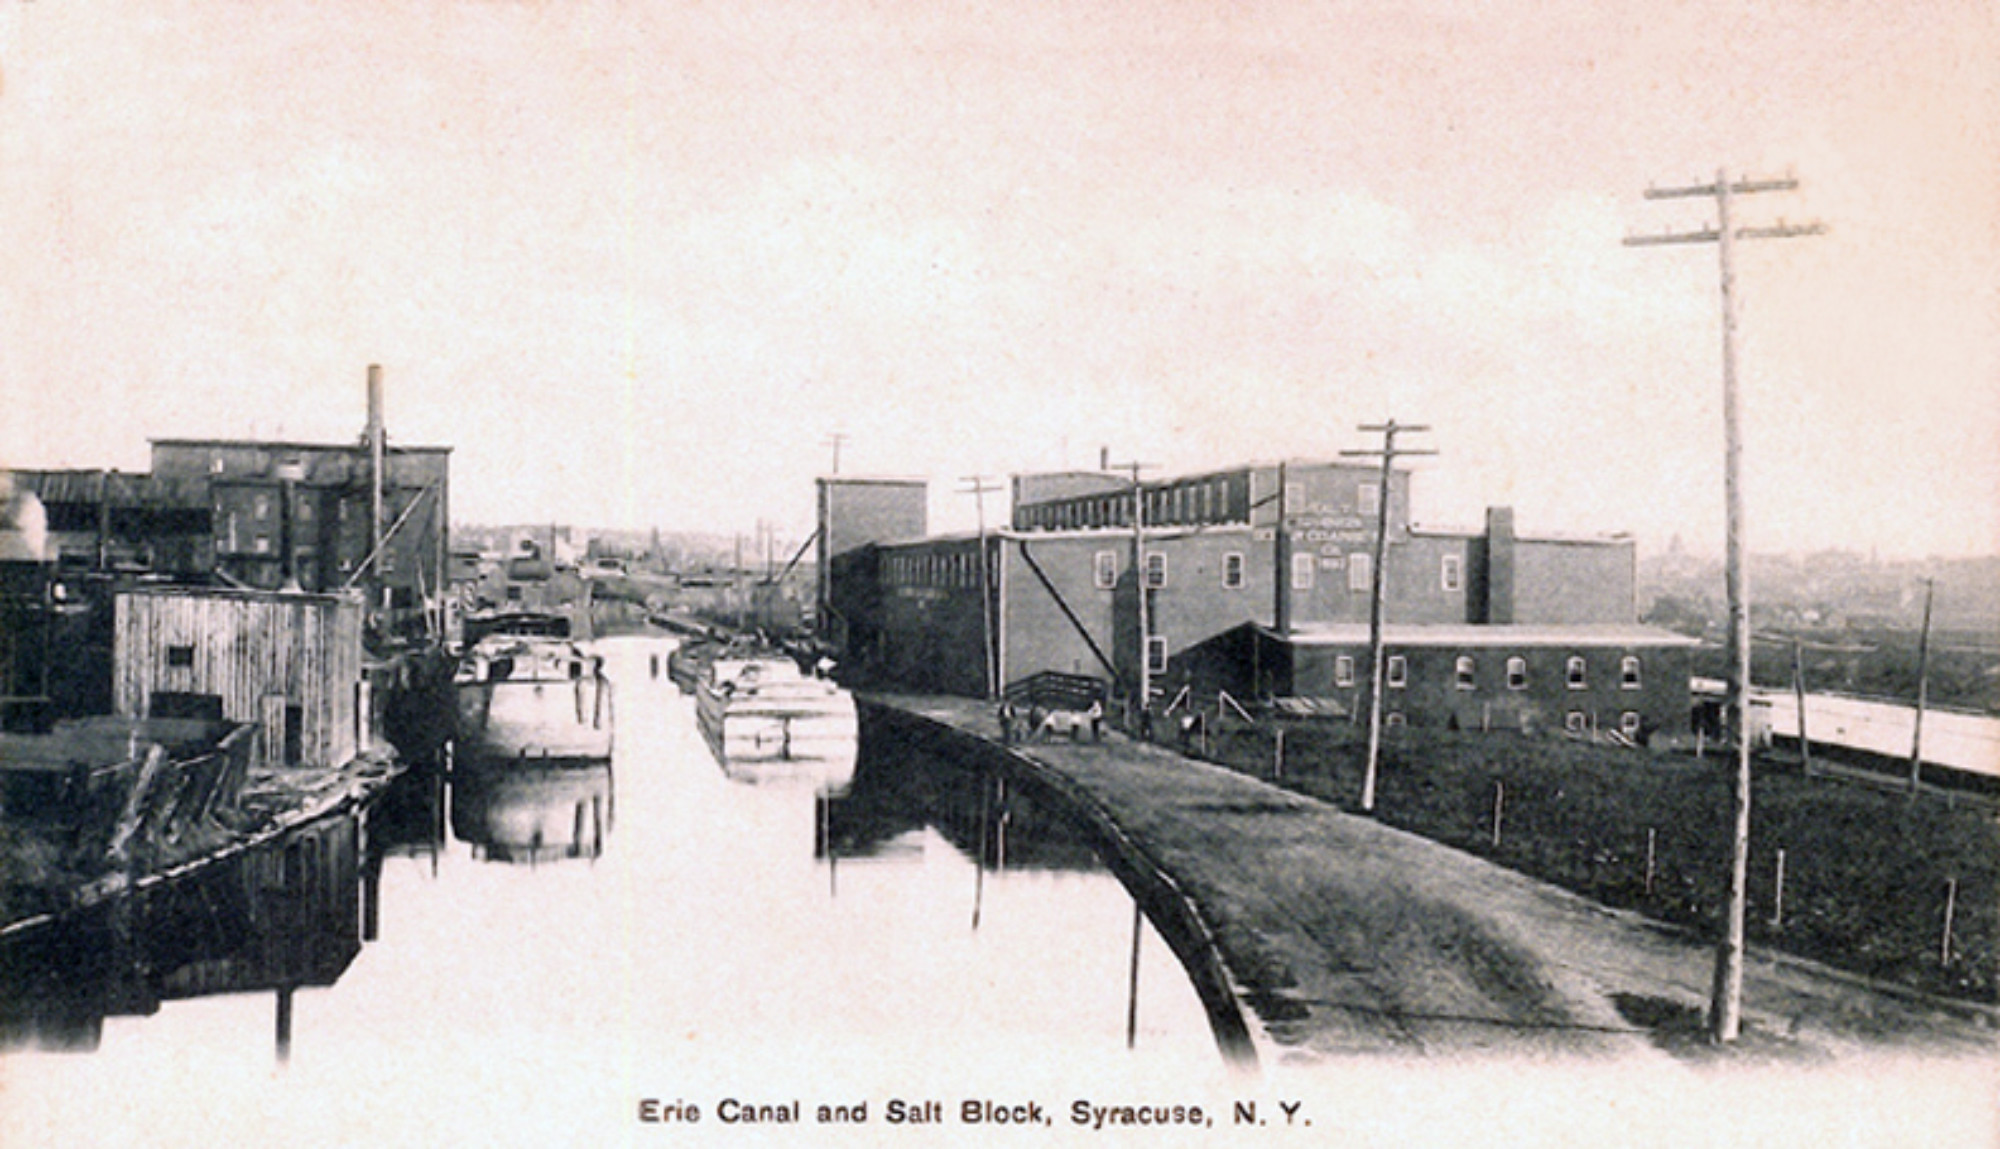
Silurian deposits of salt centered in the Northeast indicate that the North American climate experienced little precipitation during the warm period beginning 430 million years ago. Eventually, the salinity in the shallow seas of the ancient Northeast returned to normal in the Devonian, and a rich and diverse fauna occupied the sea floor, including reefs and other habitats. At the end of the Devonian, however, the fauna suffered a mass extinction that eliminated many of the important reef-builders and other animals that occupied the shallow seas. The causes of this mass extinction, which actually occurred in a series of steps, are still uncertain.
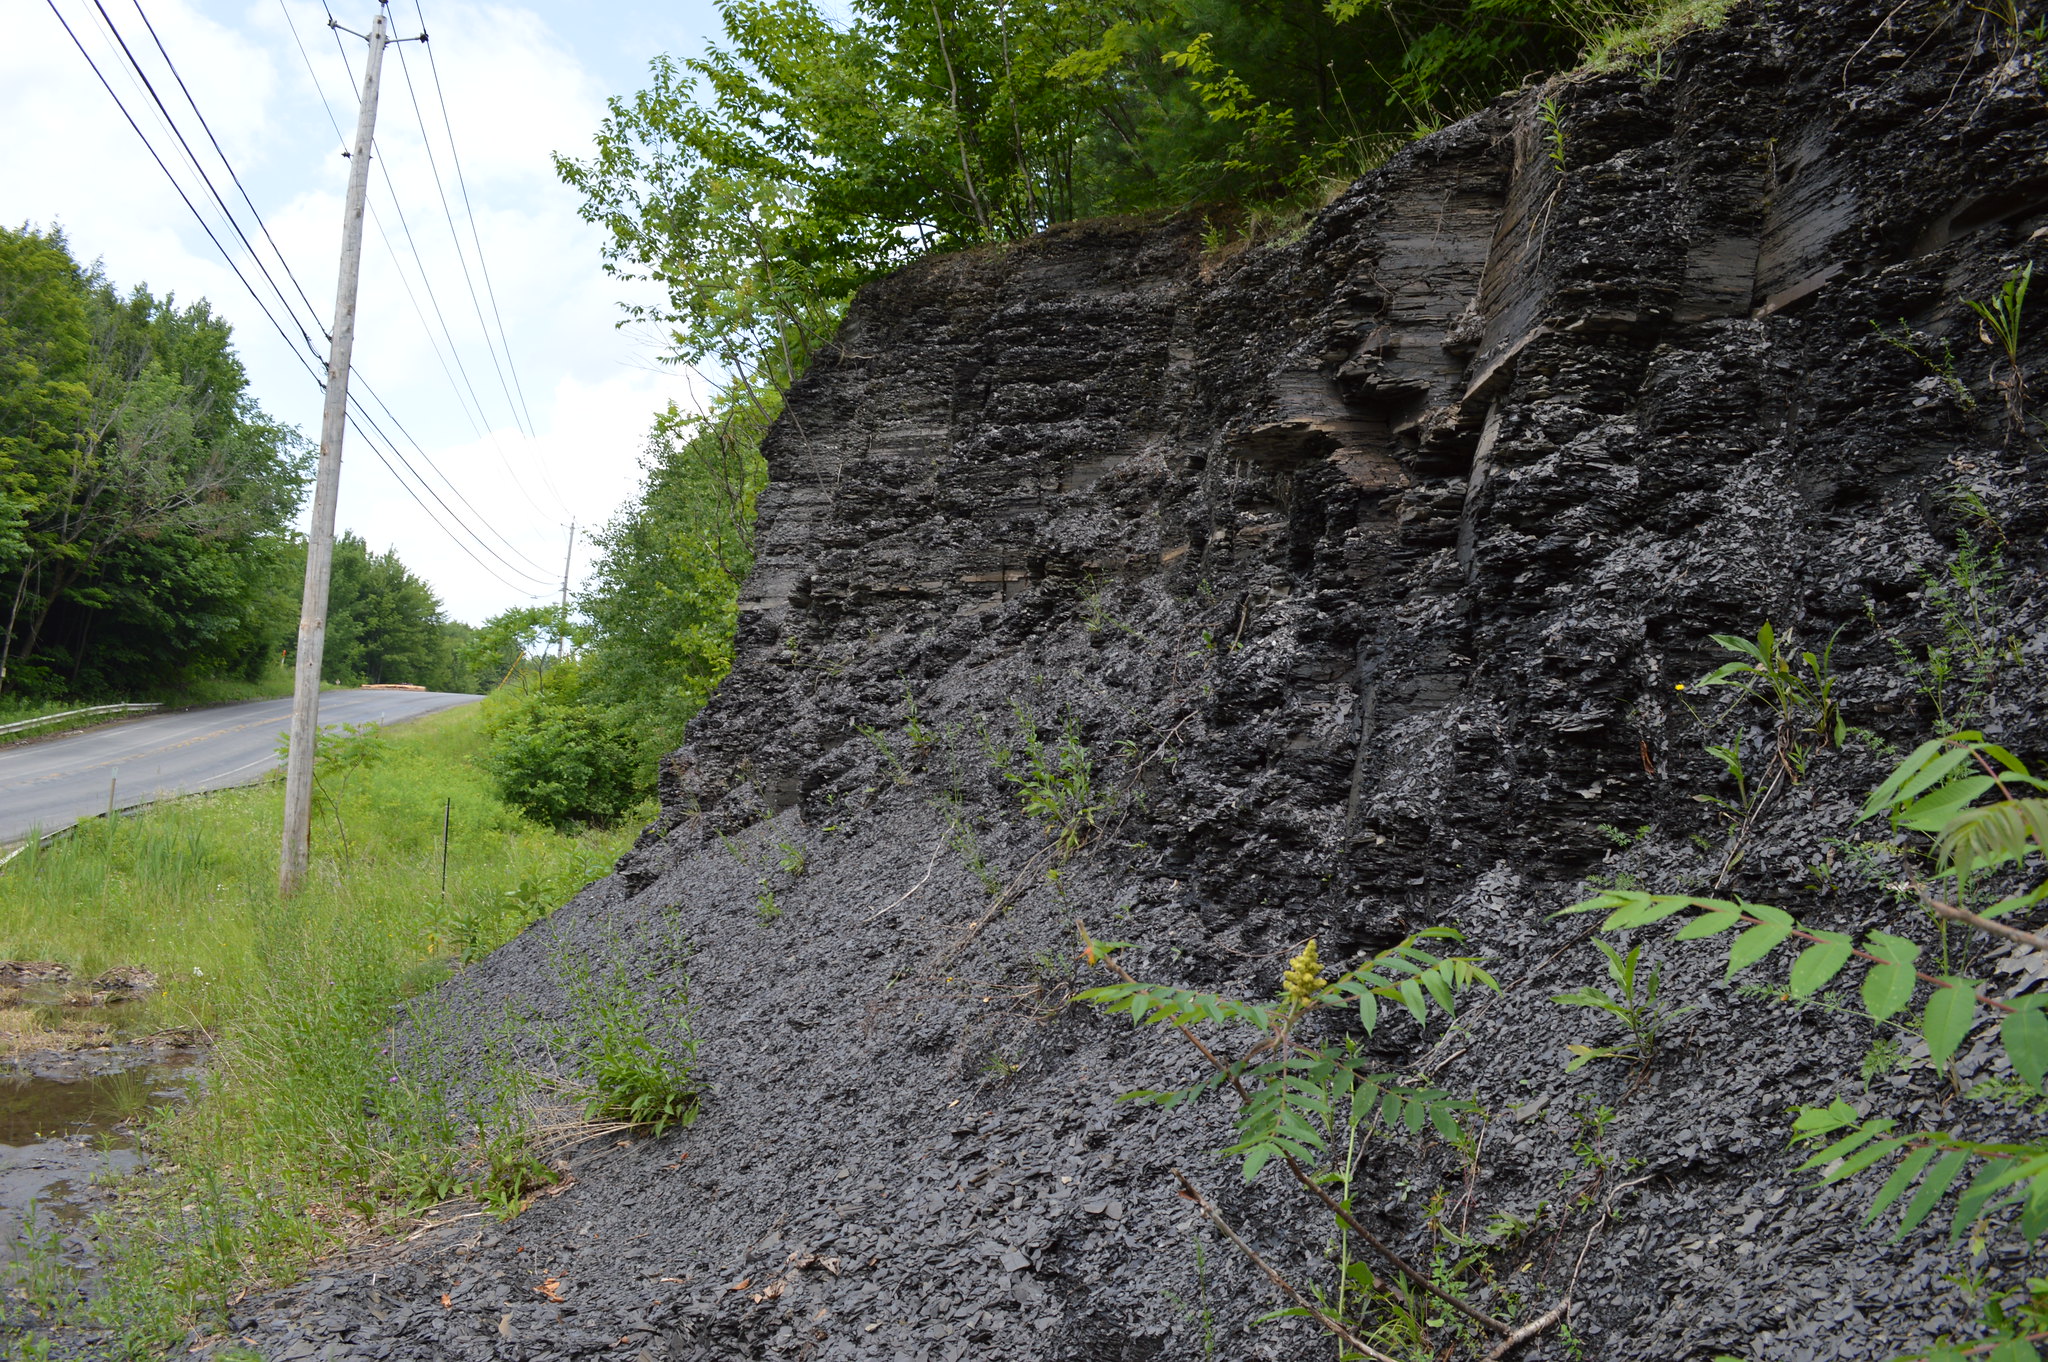
Rocks in the Northeast contain Silurian and Devonian fossils like trilobites, brachiopods, corals, and crinoids. These fossils indicate that the Northeast still contained warm, shallow seas through the late Devonian. These shallow seas were especially productive. In fact, plankton productivity grew so high that it depleted all the oxygen from the seafloor and sediments. The lack of oxygen allowed organic matter to accumulate instead of decay, leading to the deposition of black, carbon-rich shale. This shale occurs especially in New York and Pennsylvania.
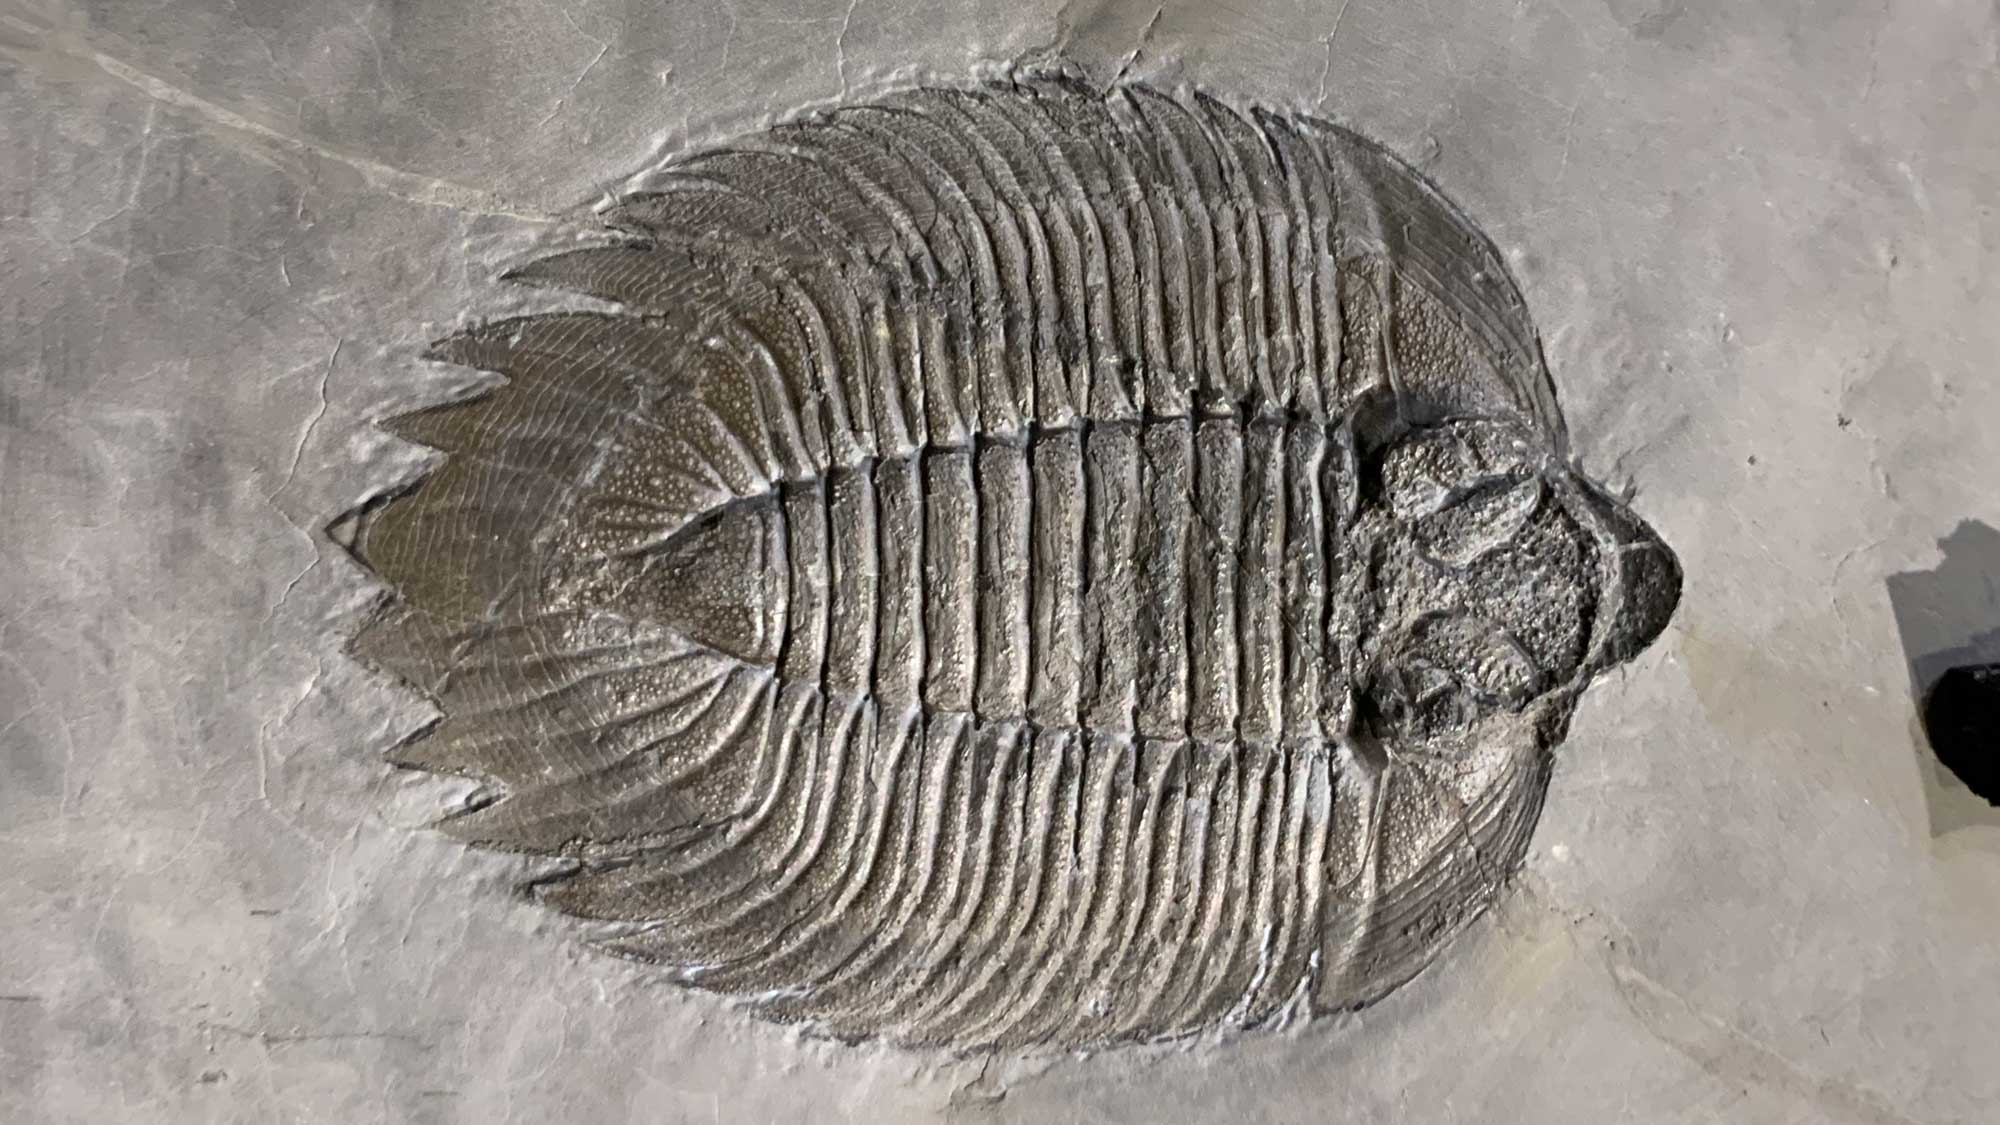
The Silurian trilobite Arctinurus boltoni, collected in Niagara County, New York. Specimen is on display at the Museum of the Earth, Ithaca, New York.
Carboniferous to Permian (359 to 252 million years ago)
As the continent continued across the Tropic of Capricorn and the Equator, the cycle of warming and cooling repeated yet again. By 360 million years ago, glaciers formed near the South Pole. Although the Earth’s temperature was falling during this time, the Northeast remained relatively warm.
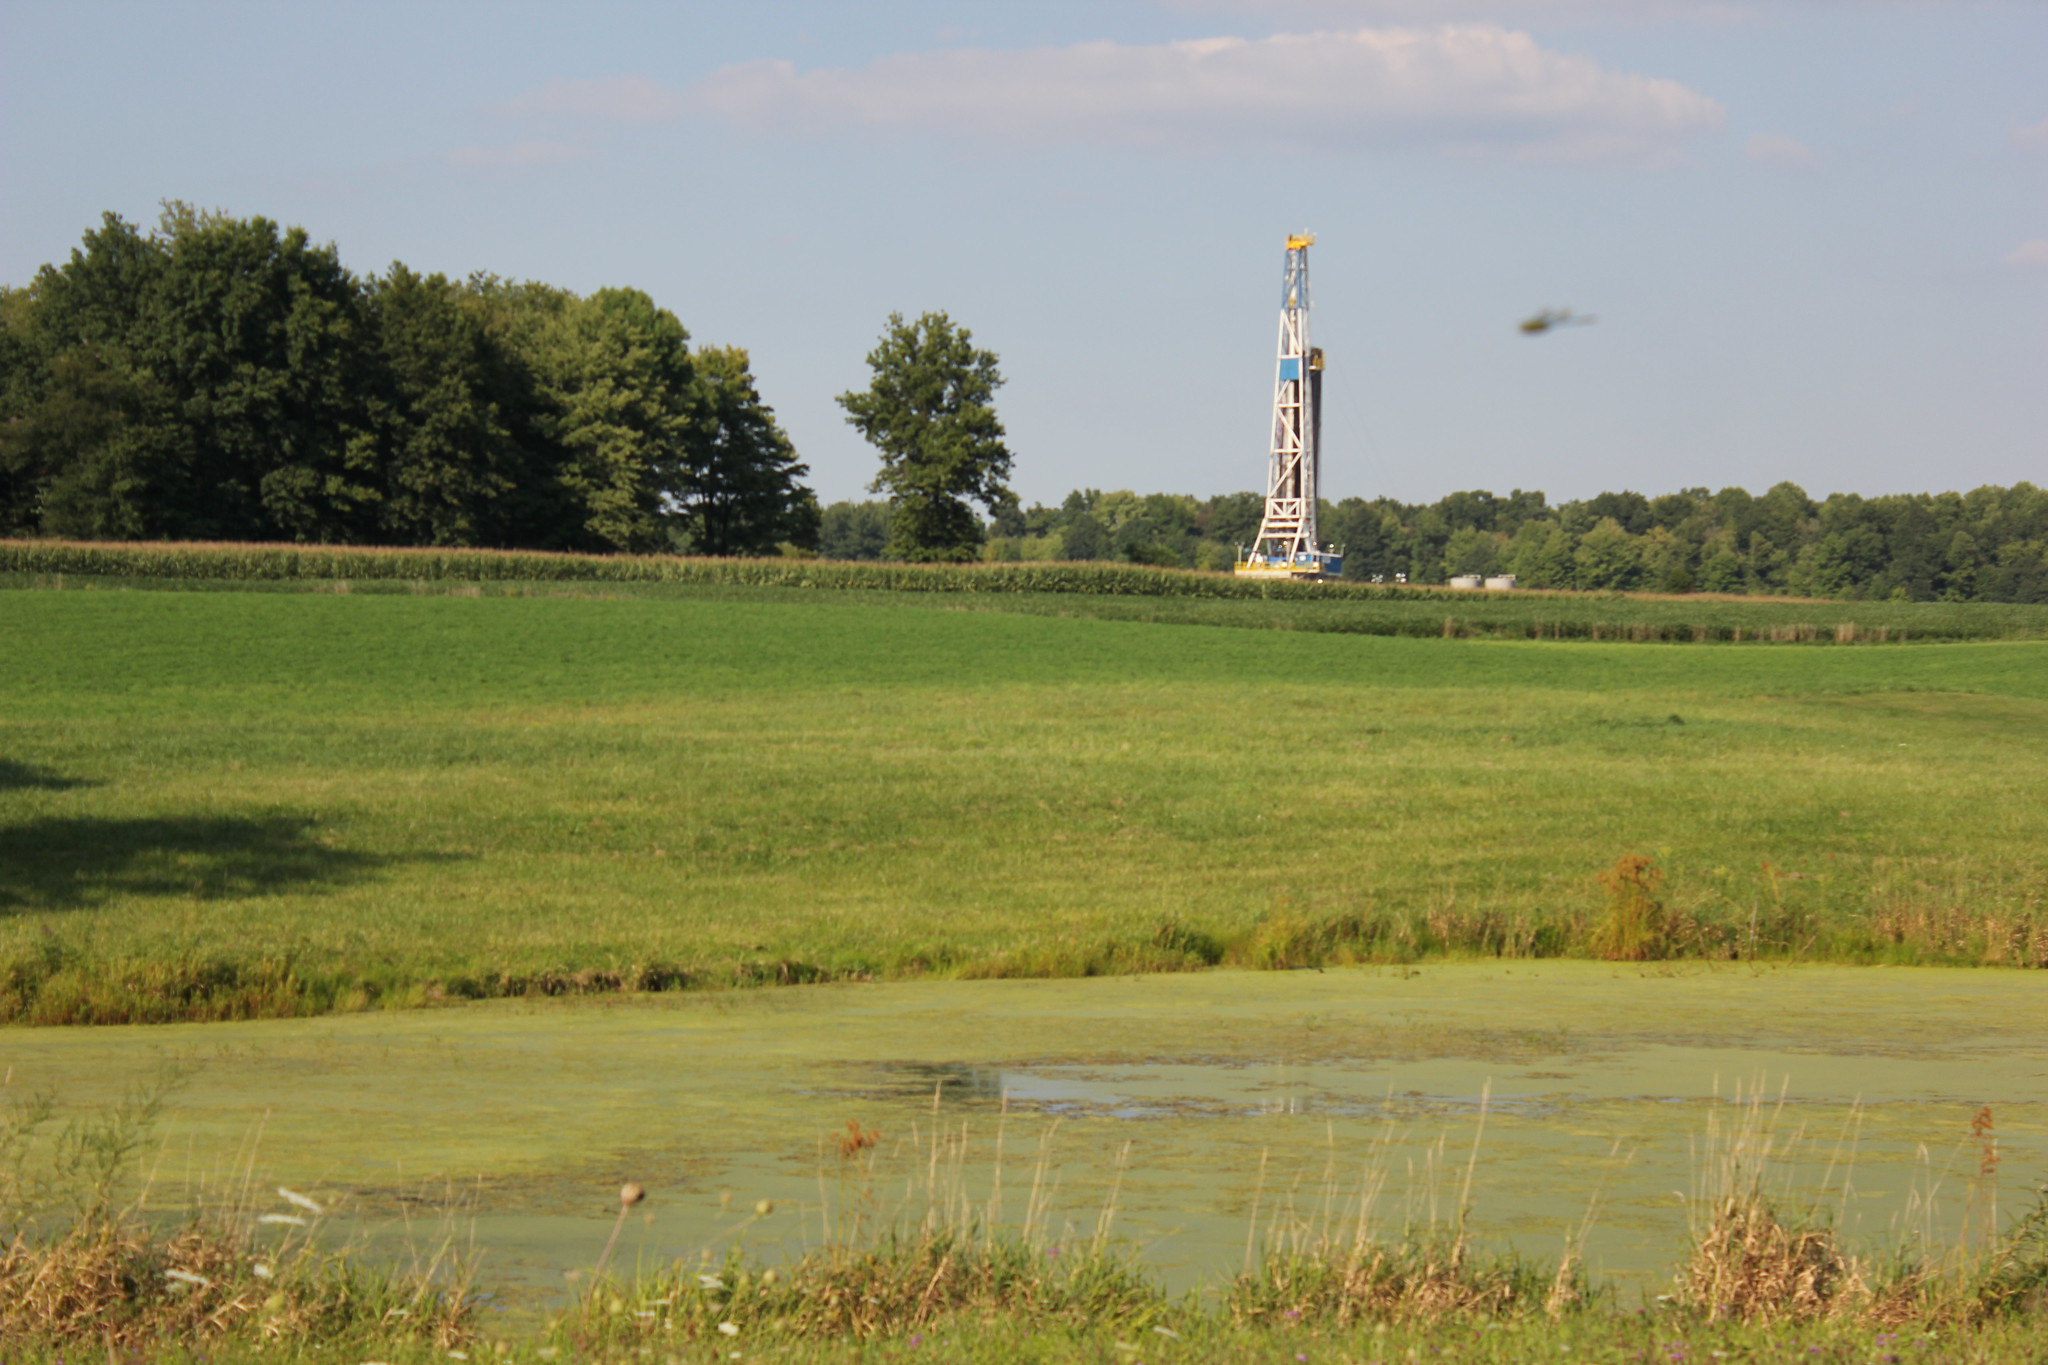
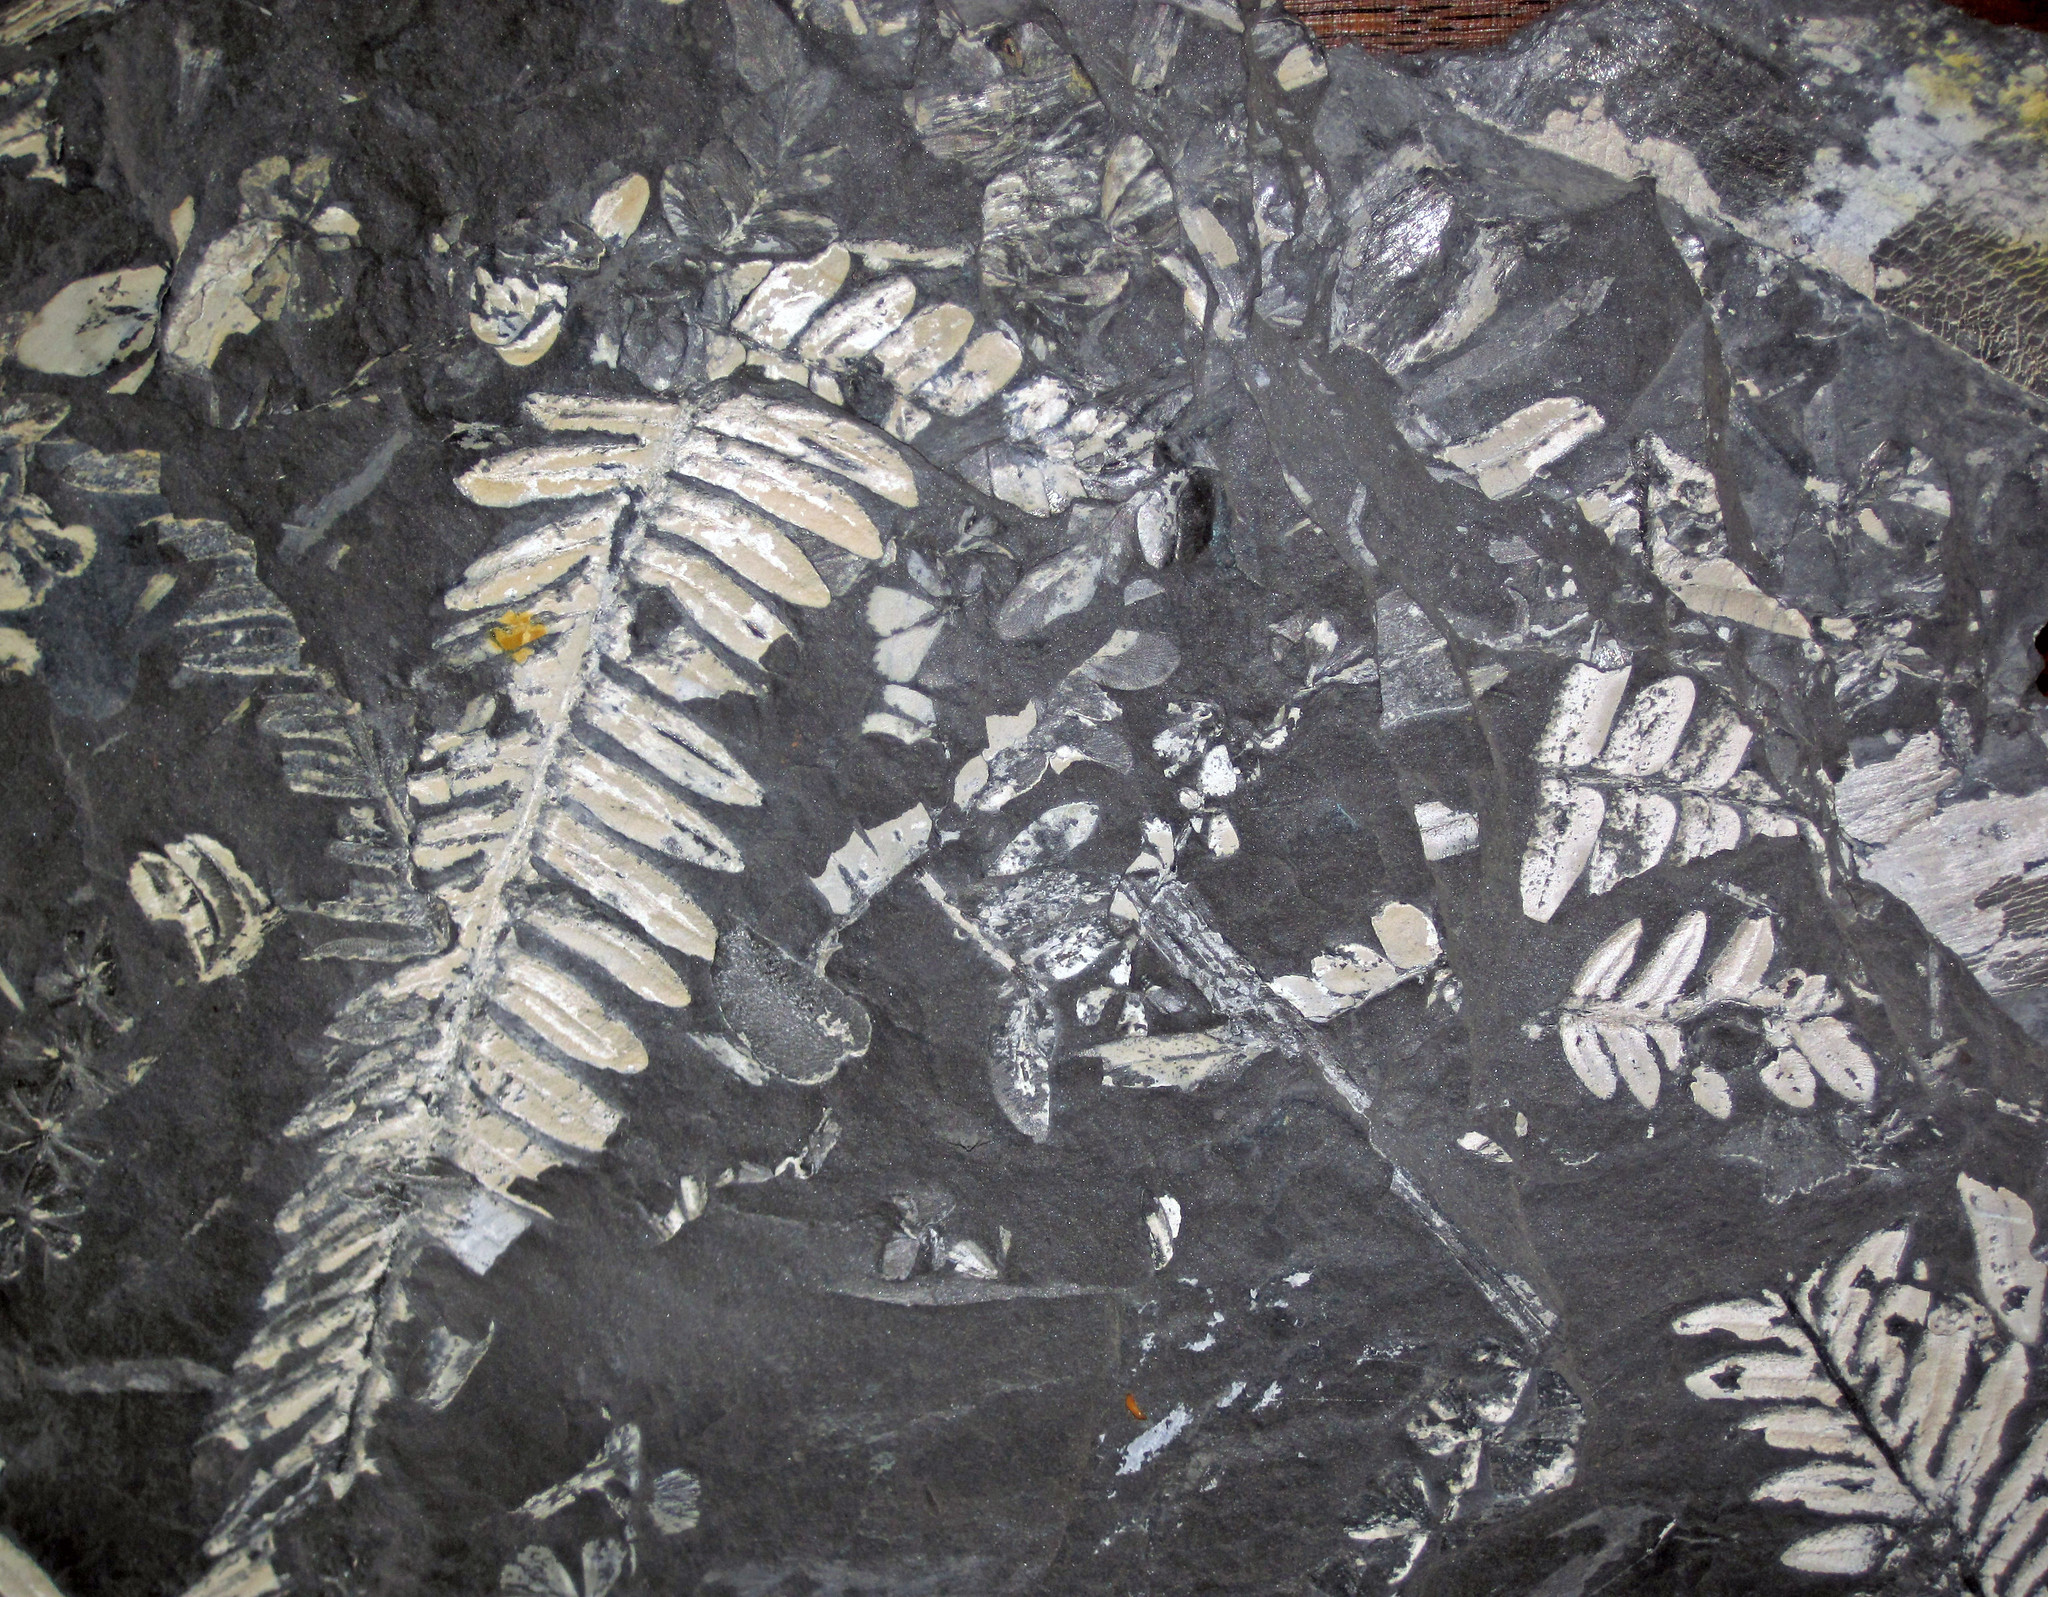
Shallow, tropical seas continued to cover most of the Northeast until sea level dropped in the middle of the Carboniferous. By this time, complex land plants had evolved and diversified; these plants rapidly colonized the newly exposed landscape. Terrestrial fossils from this time show that the climate was humid and supported swamp forests. These swamps eventually became the coal deposits of the southern Northeast, especially in Pennsylvania.
By the late Carboniferous (Pennsylvanian), North America had collided with Gondwana, advancing the formation of Pangaea. Pangaea was so large that it created a strong monsoonal climate, much as Asia has today. A monsoonal climate is a warm climate with wet and dry seasons. The monsoonal climate counteracted the effect to the rain shadow produced by the Central Pangaean Mountains (in North America, the Appalachian and Ouachita mountains) by bringing in moisture from the west.
Although global temperatures again declined as glaciers formed near the South Pole, temperatures in present-day eastern North America remained warm. Late Carboniferous fossils from the Inland Basin provide evidence of a warm climate with scale trees and other swamp plants. The large coal swamp forests that eventually formed the rich coal beds of Pennsylvania grew along broad floodplains.
The region experienced the repeated rising and falling of sea levels as the glaciers waxed and waned. This ice age lasted well into the Permian, ending about 260 million years ago, during which time the swamps dried out permanently.
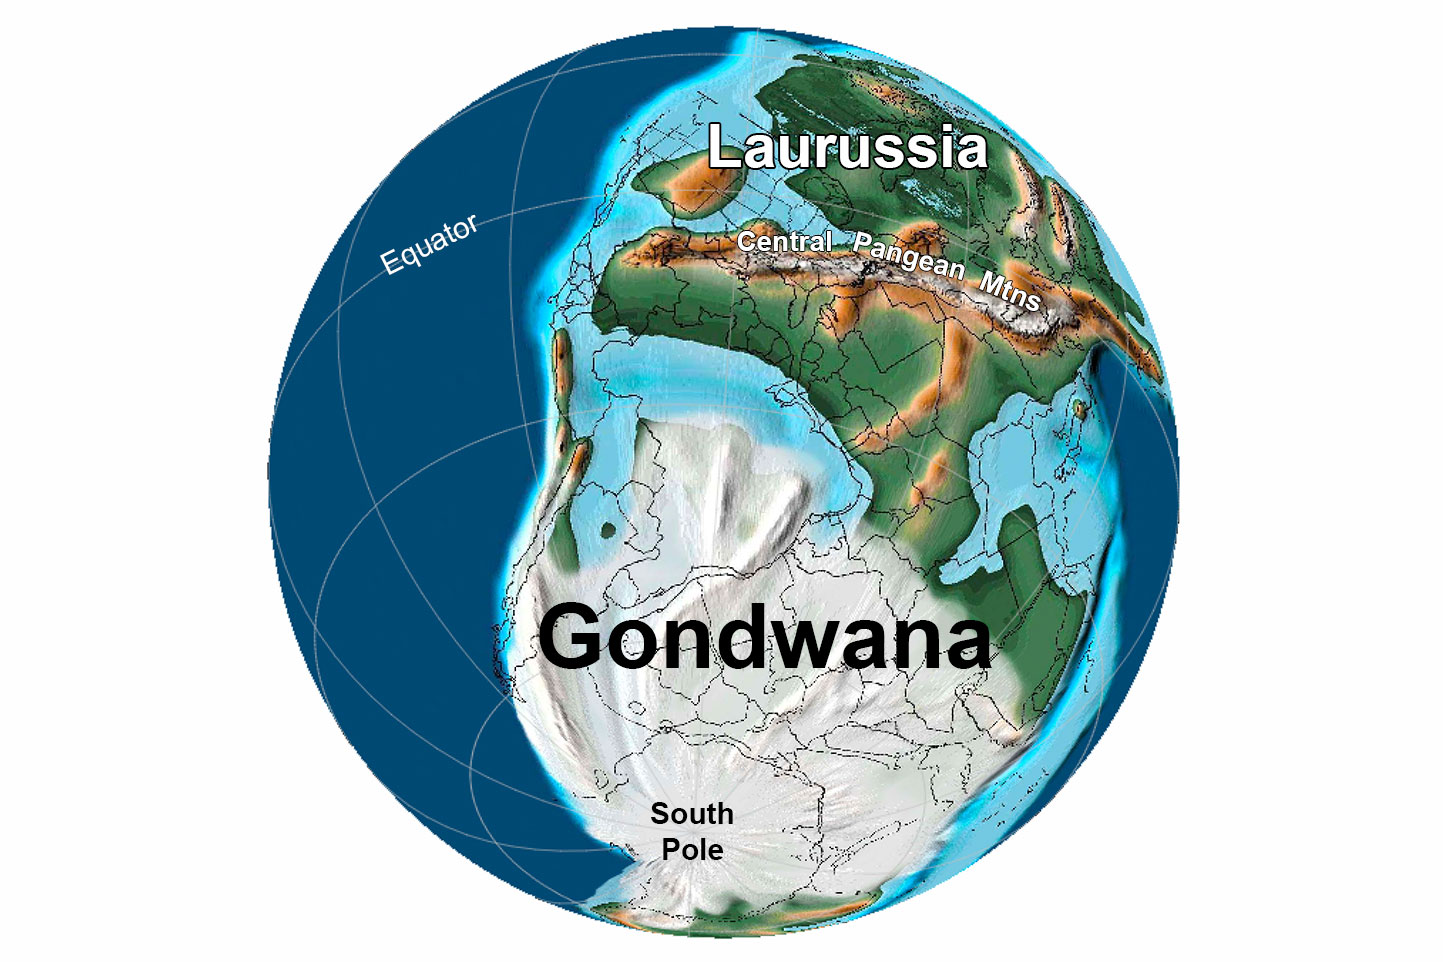
Earth 300 million years ago, during the end of the Carboniferous Period (Pennsylvanian). Pangaea was completed when North America finally collided with Gondwana. Reconstruction created using basemap from the PALEOMAP PaleoAtlas for GPlates and the PaleoData Plotter Program, PALEOMAP Project by C. R. Scotese (2016); map annotations by Jonathan R. Hendricks & Elizabeth J. Hermsen for PRI's Earth@Home project (CC BY-NC-SA 4.0 license).
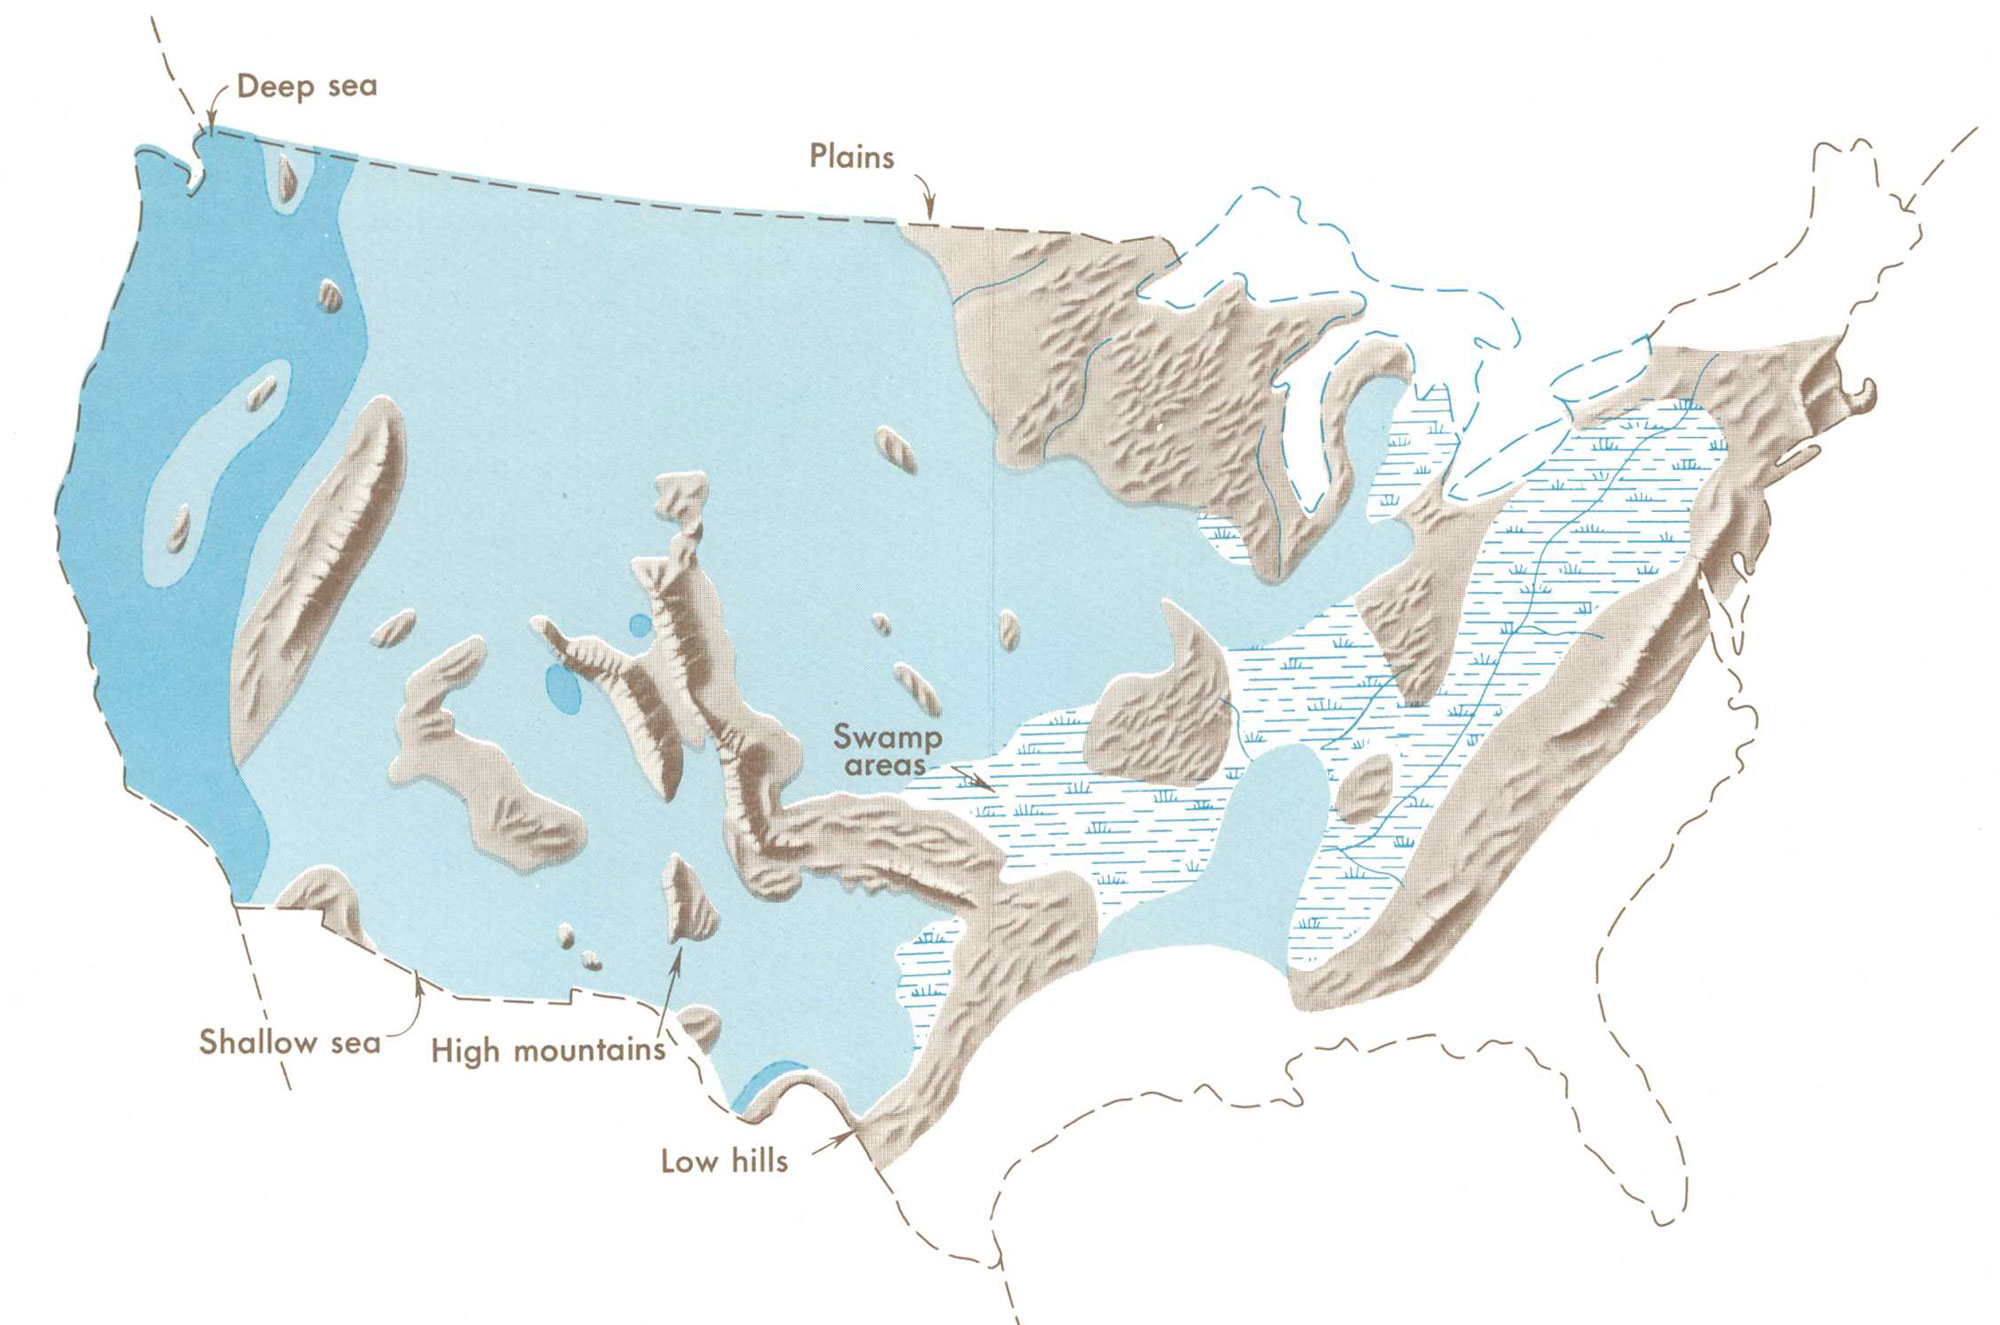
Distribution of Pennsylvanian swamps and highland areas relative to the outline of the modern United States. Map from Our changing continent, USGS Monograph, published 1969.
Mesozoic (252 to 66 million years ago)
Triassic to Jurassic (252 to 145 million years ago)
The Earth remained warm and ice-free at the poles through much of the Mesozoic era. After reaching its greatest size during the Triassic period, Pangaea began to rift apart, and the climate gradually shifted, becoming wetter and warmer. As the Triassic period began, the Northeast moved north from the equator. Triassic rocks are known from the rift basins extending from central Maryland to southeastern New York (Gettysburg and Newark basins), as well as in Connecticut and Massachusetts (Connecticut Valley). These basins contain a rich terrestrial and lake fauna of fishes, amphibians, dinosaurs, and other reptiles.
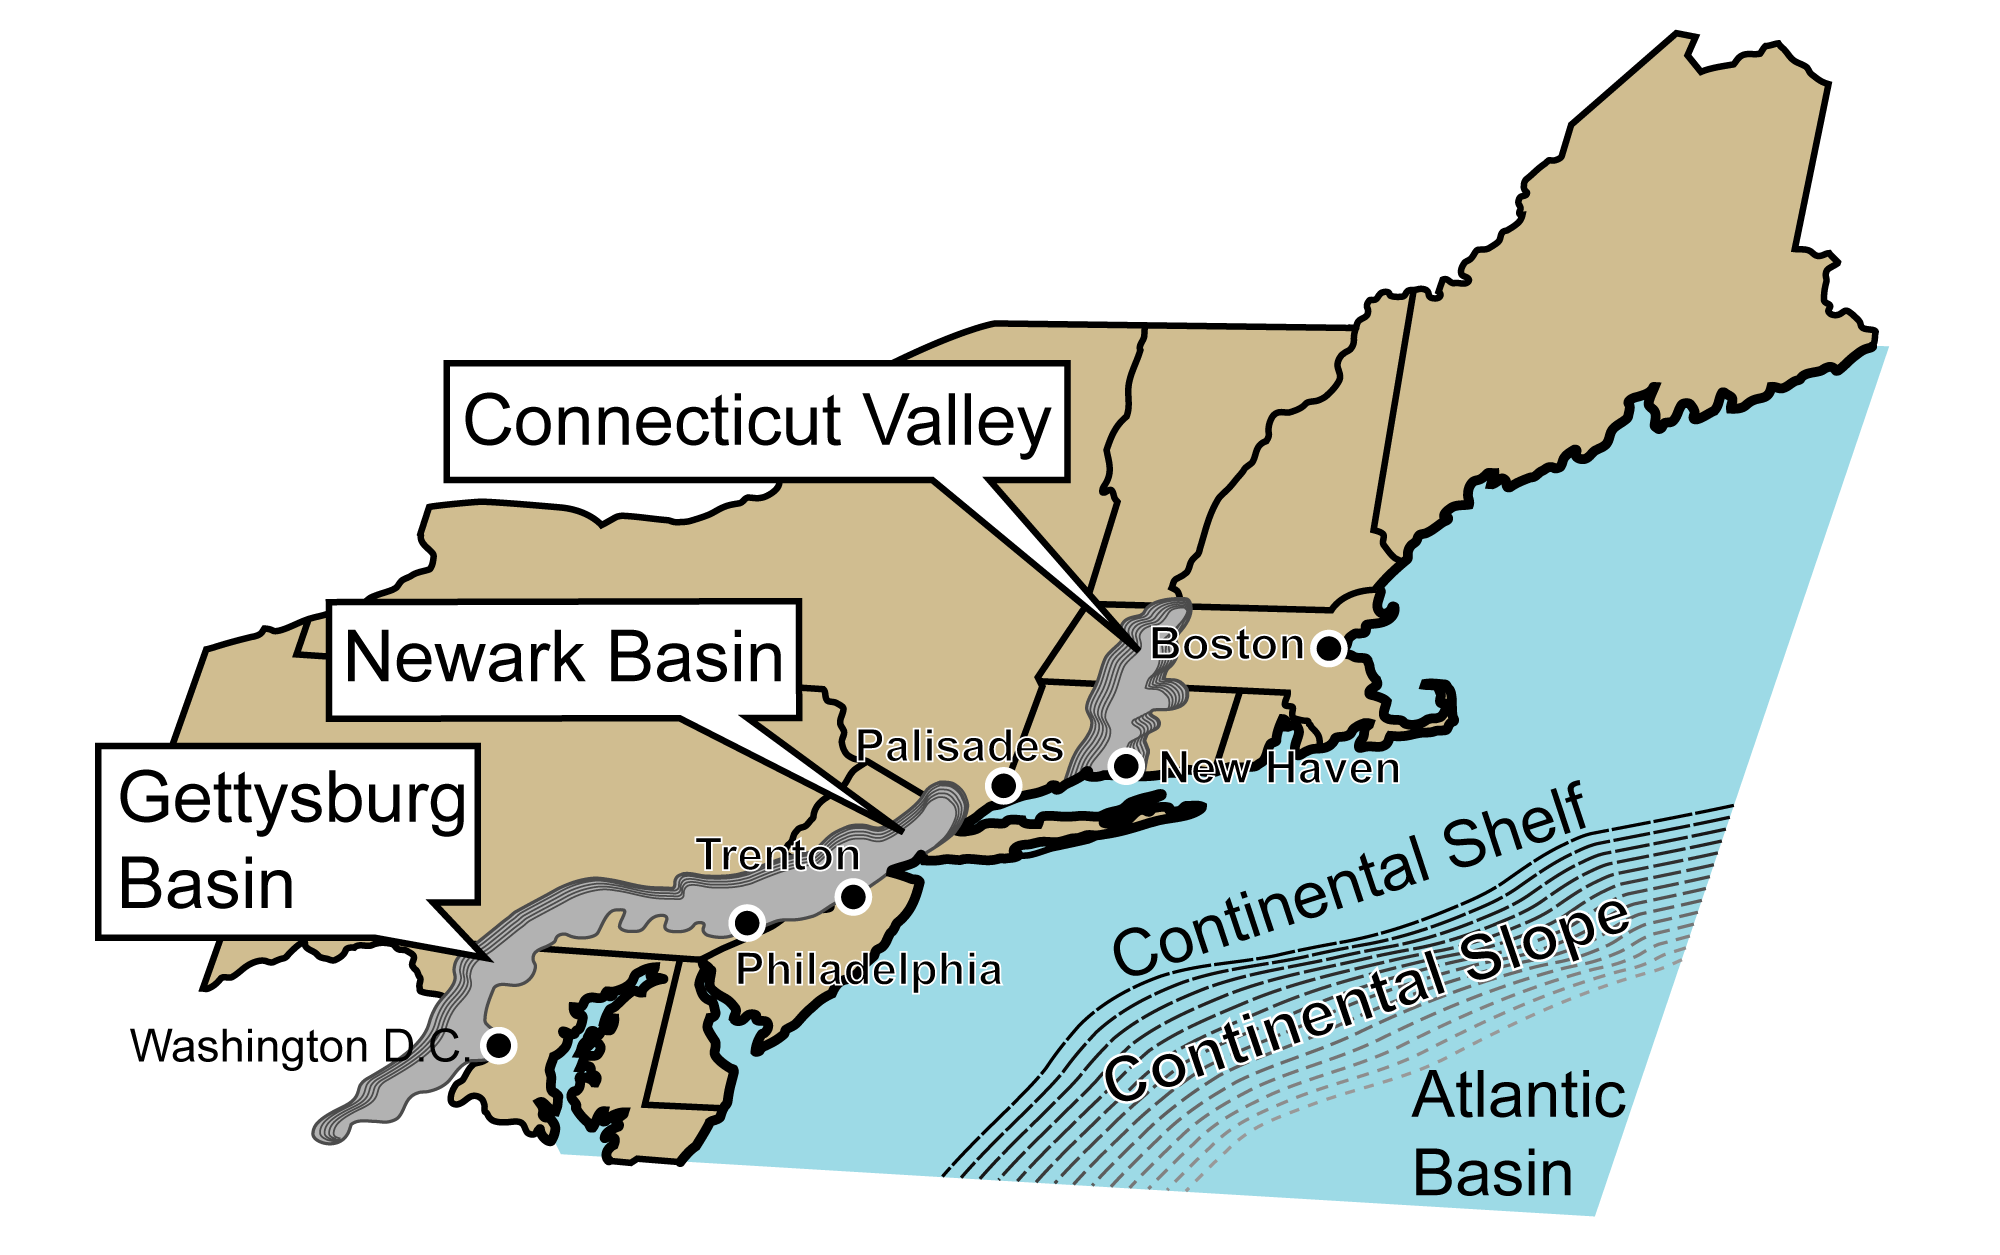
The Triassic Rift Basins of the Northeast formed as North America broke away from Pangaea during the Triassic and Jurassic. Image modified from original by J. Houghton first published in The Teacher-Friendly Guide to the Geology of the Northeastern U.S. by Jane Ansley (published by the Paleontological Research Institution) (CC BY-NC-SA 4.0 license).
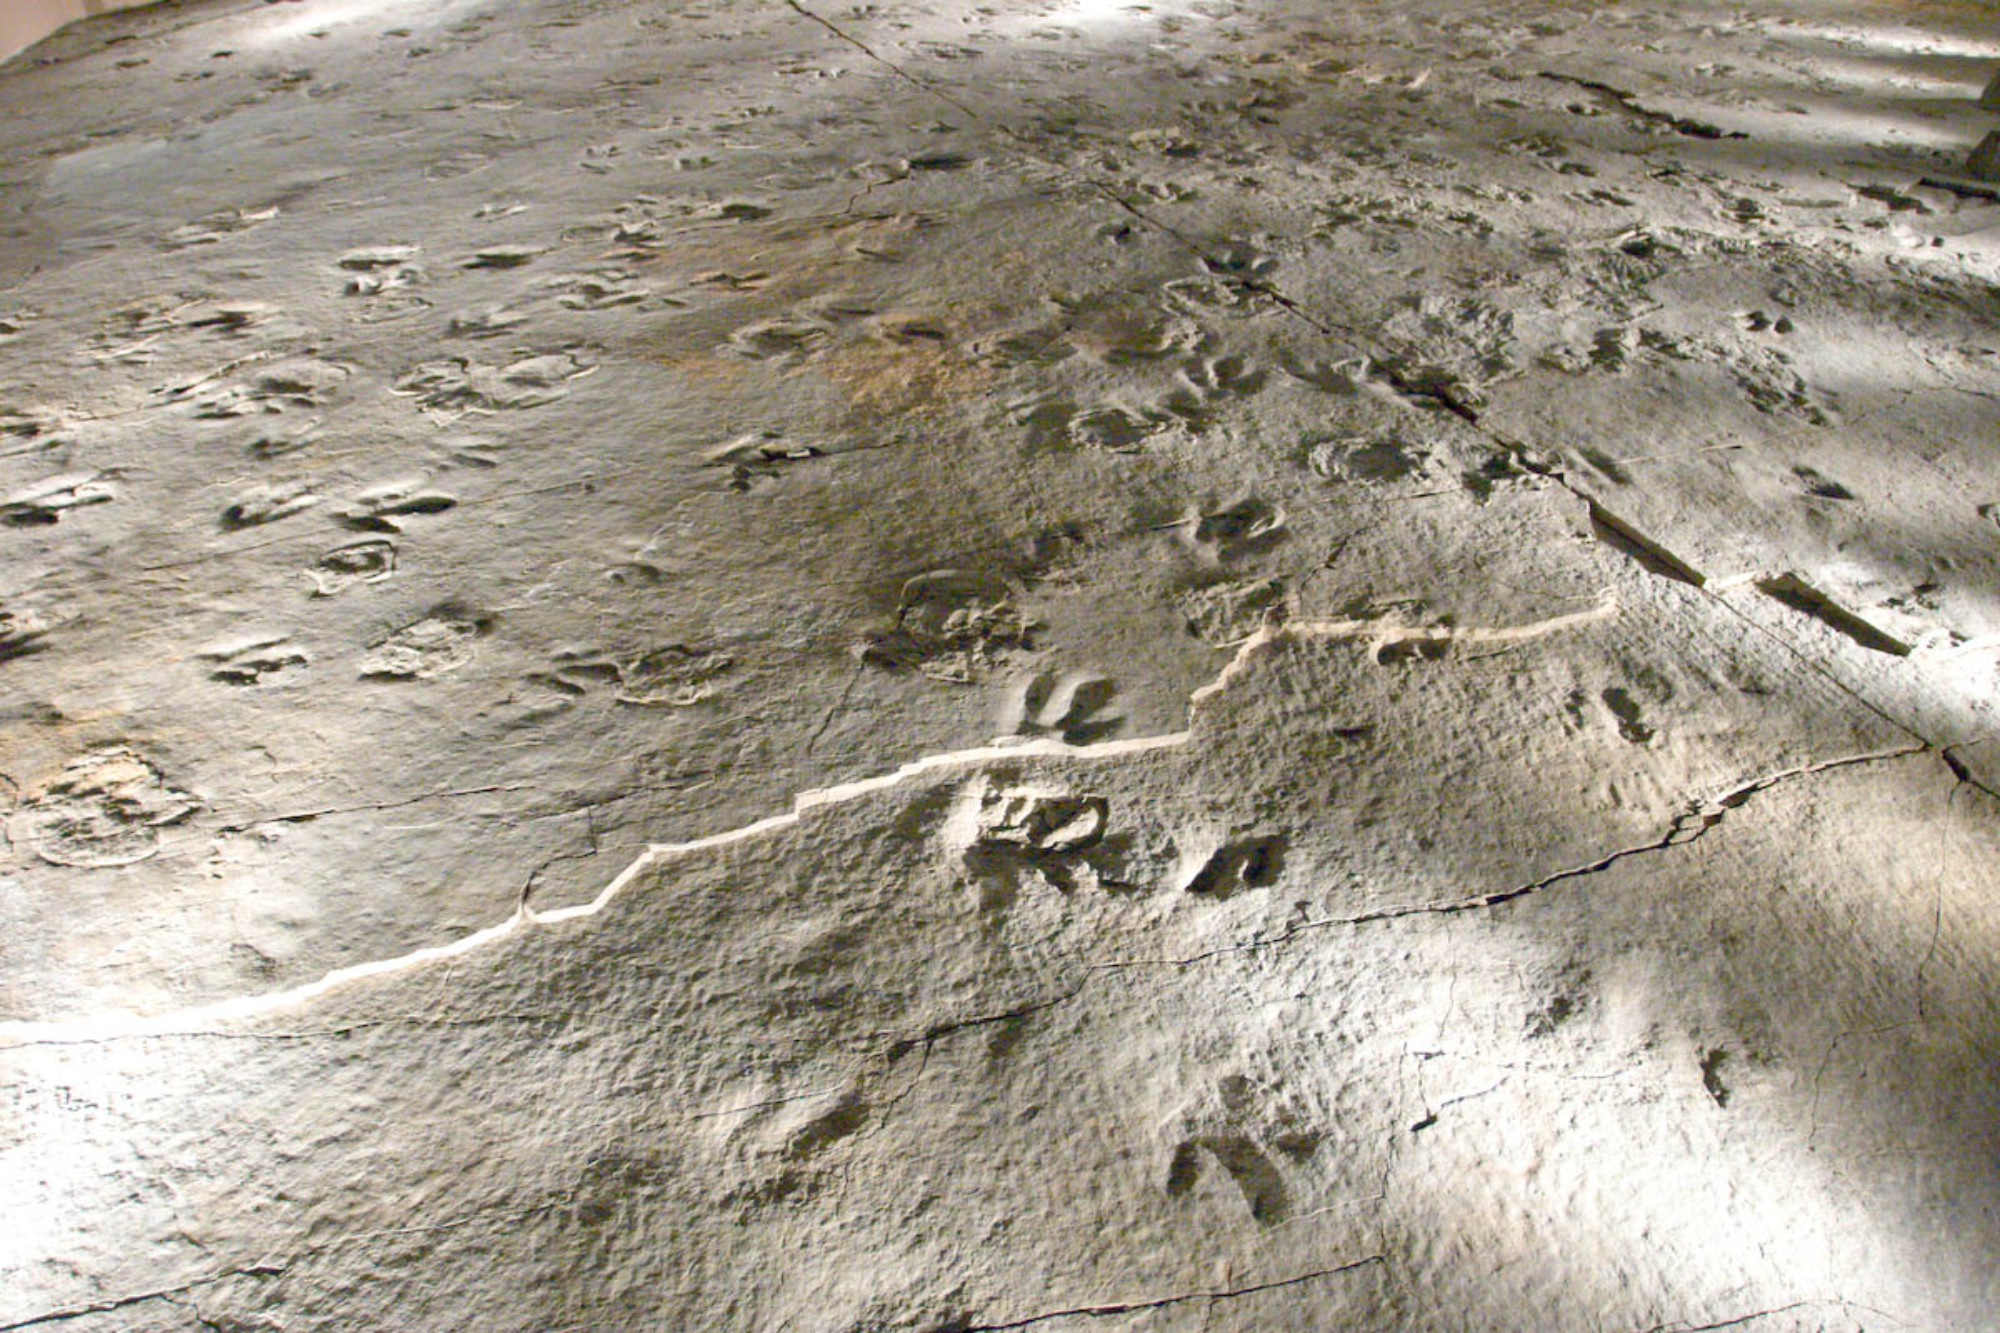
Eubrontes footprints at Dinosaur State Park in Connecticut. Photo by Ken Zirkel (CC BY-NC 2.0 license) via Flickr
During the Jurassic Period, the final break between North America, Gondwana, and Baltica occurred along what is now the Mid-Atlantic Ridge. Pangaea gradually fragmented into the modern continents, all slowly moving into their present positions.
The Atlantic Ocean began to widen as Africa separated from North America, and the Gulf of Mexico opened up as South America pulled away. The east coast of North America no longer experienced the strong tectonic activity associated with the compression and rifting of a plate margin; it once again became a passive margin.
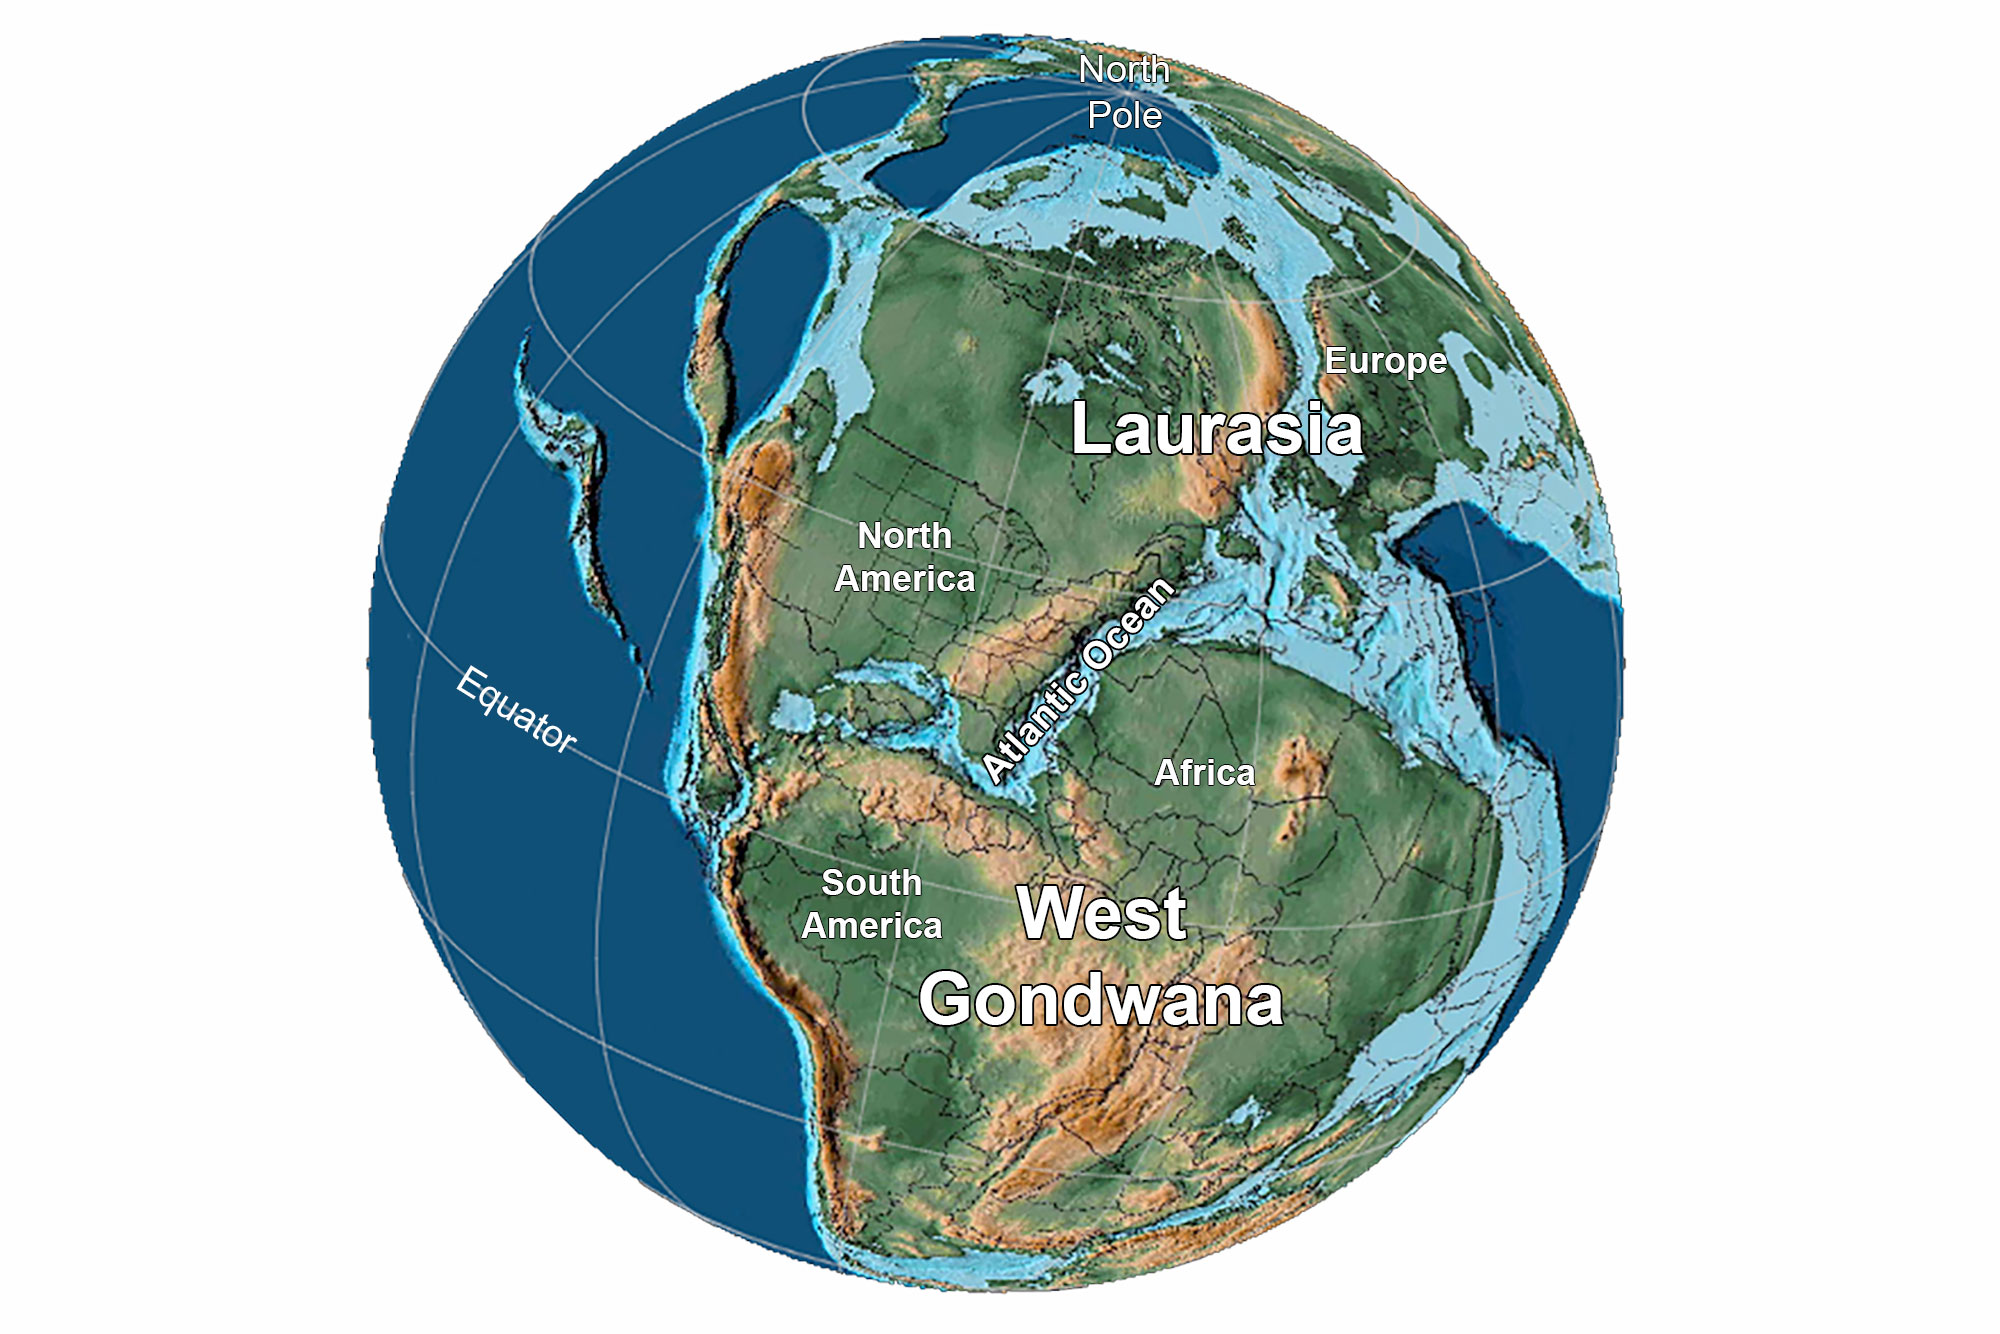
Earth 175 million years ago, during the Jurassic Period. Reconstruction created using Paleomap (by C. Scotese) for GPlates. Reconstruction created using basemap from the PALEOMAP PaleoAtlas for GPlates and the PaleoData Plotter Program, PALEOMAP Project by C. R. Scotese (2016); map annotations by Jonathan R. Hendricks for PRI's Earth@Home project (CC BY-NC-SA 4.0 license).
Cretaceous (145 to 66 million years ago)
Throughout the Cretaceous, sea level was as much as 100 meters (330 feet) higher than it is today. Shallow seaways spread over many of the continents. Global temperatures during the Cretaceous were very warm, as much as 10°C (18°F) above present. There was likely little or no glacial ice anywhere on Earth, and temperatures were highest in lower latitudes. By the start of the Late Cretaceous, North America was divided in two by an inland sea known as the Western Interior Seaway, and the Northeast experienced a warm and humid tropical climate.
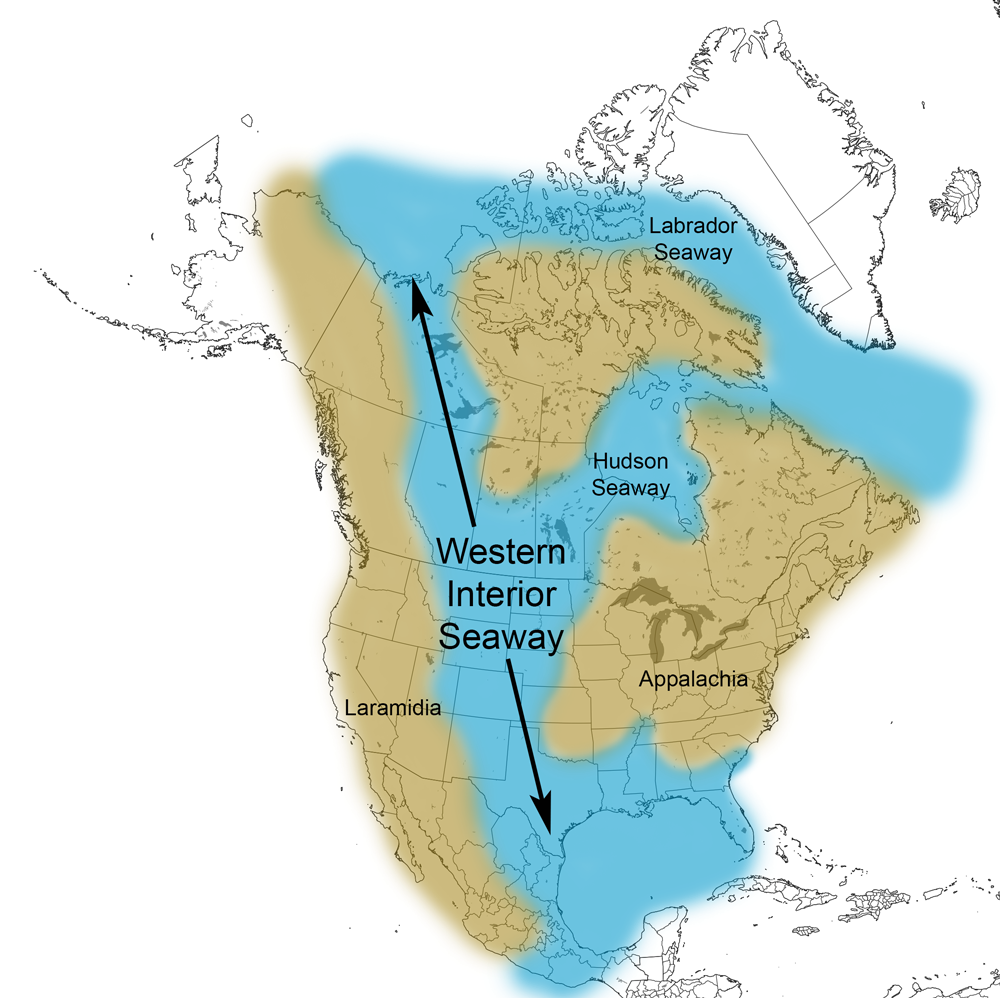
Extent of the Western Interior Seaway during the Cretaceous Period. Image from Cretaceous Atlas of Ancient Life: Western Interior Seaway (Creative Commons Attribution-NonCommercial-ShareAlike 4.0 International license).
At the very end of the Cretaceous, the Gulf Coast experienced an enormous disruption when an asteroid or comet collided with Earth in what is now the northern Yucatán Peninsula in Mexico. The impact vaporized both water and rock, blocking out sunlight for weeks to years, leading to a collapse of photosynthesis and food webs on land and in the oceans. After this event, the climate may have cooled briefly, but it soon rebounded to a warmer state.
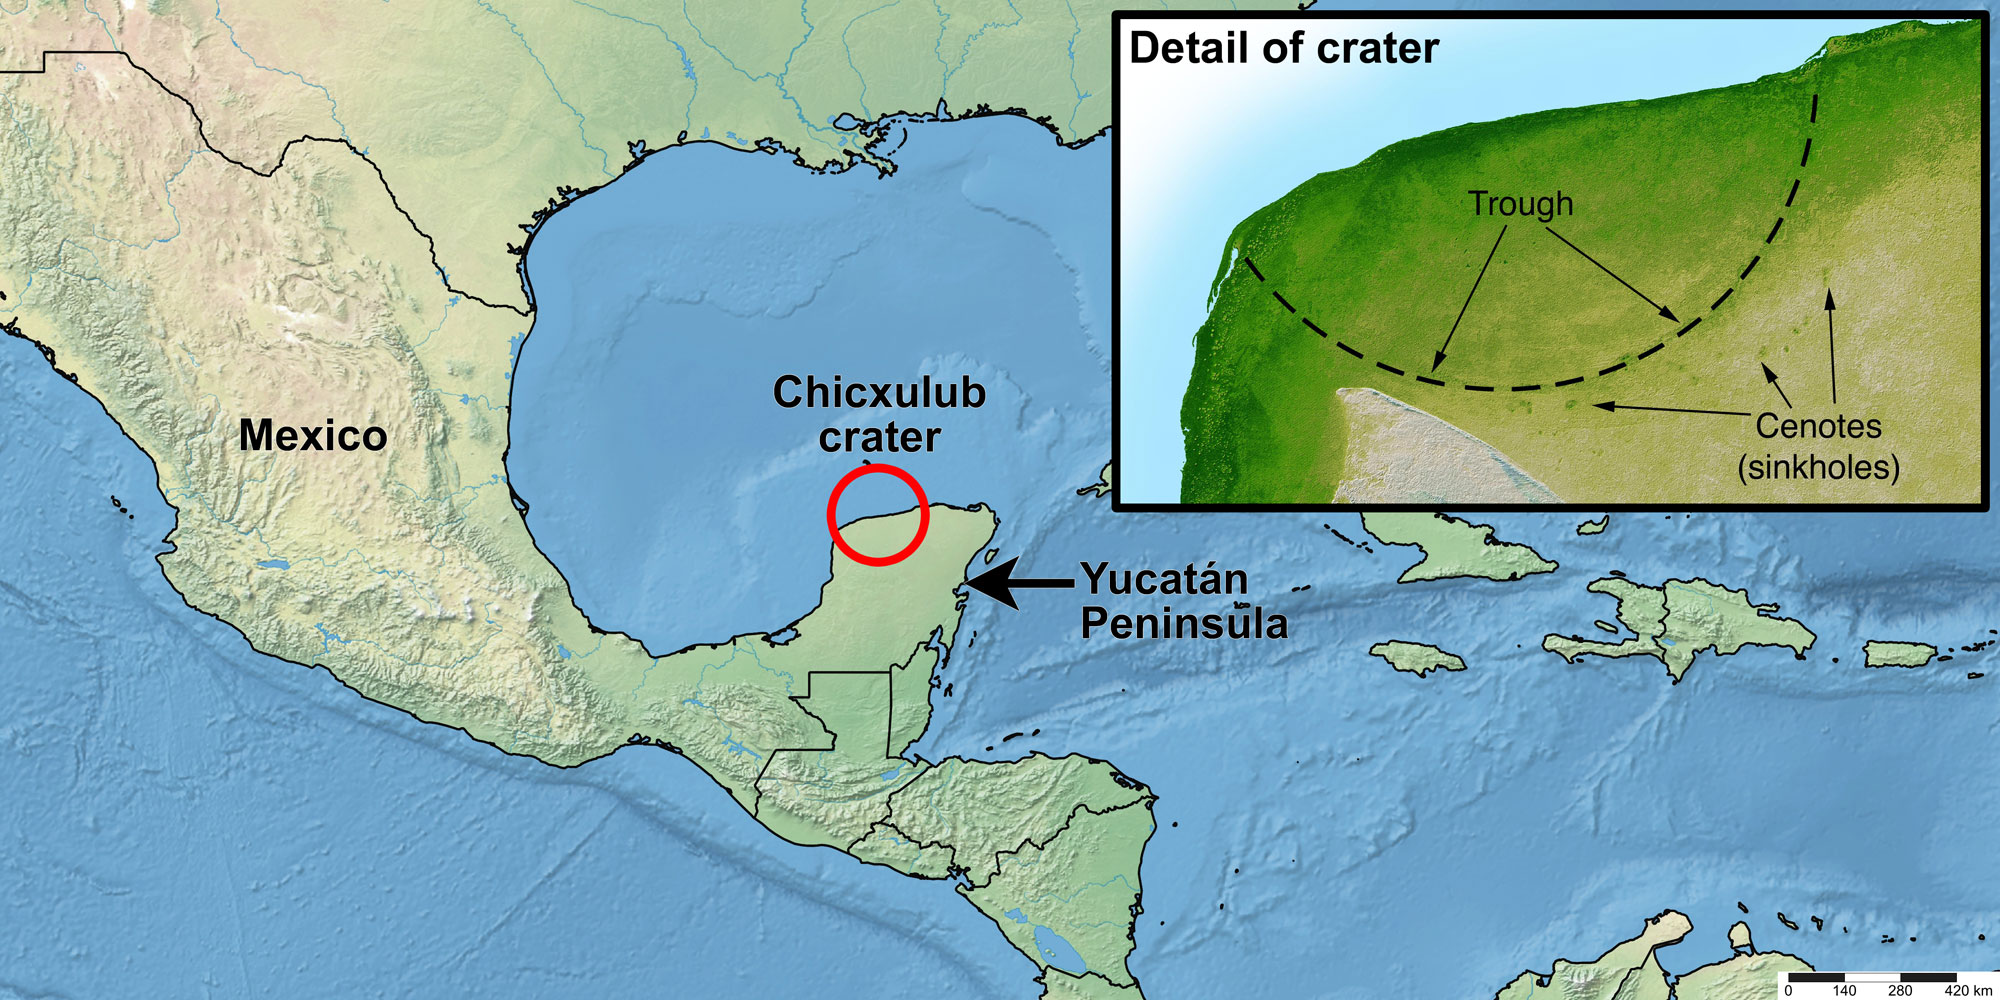
Map of the modern Yucatán Peninsula region showing the location of the Chicxulub impact crater. The inset image is a shaded relief image that shows the edge of the crater on the Yucatán Peninsula with sinkholes in the rock surrounding it. Map made by Elizabeth J. Hermsen using Simplemappr and modified in Photoshop. Inset image from the NASA Jet Propulsion Laboratory (PIA03397).
Cenozoic (66 million years ago to present)
Paleogene (66 to 23 million years ago)
As the Cenozoic era began, global temperatures rose even further into the early Eocene. At the boundary between the Paleocene and Eocene epochs (around 56 million years ago), temperatures spiked upward in what geologists call the Paleocene-Eocene Thermal Maximum (PETM). During this event, which lasted perhaps only around 10,000 years, the atmosphere and ocean warmed by as much as 8°C (14°F) in as little as 4000 years. This greenhouse effect persisted for 100,000 years. This warm interval reflected in the types of land plants and diversity of marine life—especially clams, snails, and echinoderms—represented by fossils in the Northeast Coastal Plain.
In the late Eocene, the Earth began cooling, and global temperatures fell sharply at the boundary between the Eocene and Oligocene epochs (around 35 million years ago).
Neogene (23 to 2.6 million years ago)
Climates warmed slightly during the Miocene, a change reflected in the diverse marine and terrestrial fossils of the Atlantic Coastal Plain from Maryland to Florida. Global temperatures again began to fall after a slight peak in the middle Miocene. These changes are also visible in the Northeast's fossil record, with species that had lived farther north retreating southward over time.
Around 3.5 million years ago, glacial ice began to form over the Arctic Ocean and on the northern parts of North America and Eurasia. A major contributing factor to this event was a geological change: the emergence of the Isthmus of Panama, which was formed by undersea volcanoes. The new dry-land isthmus blocked the warm ocean currents that had been flowing east-to-west from the Atlantic to the Pacific for more than 100 million years. These currents were diverted into the Gulf of Mexico and ultimately into the western Atlantic Gulf Stream.
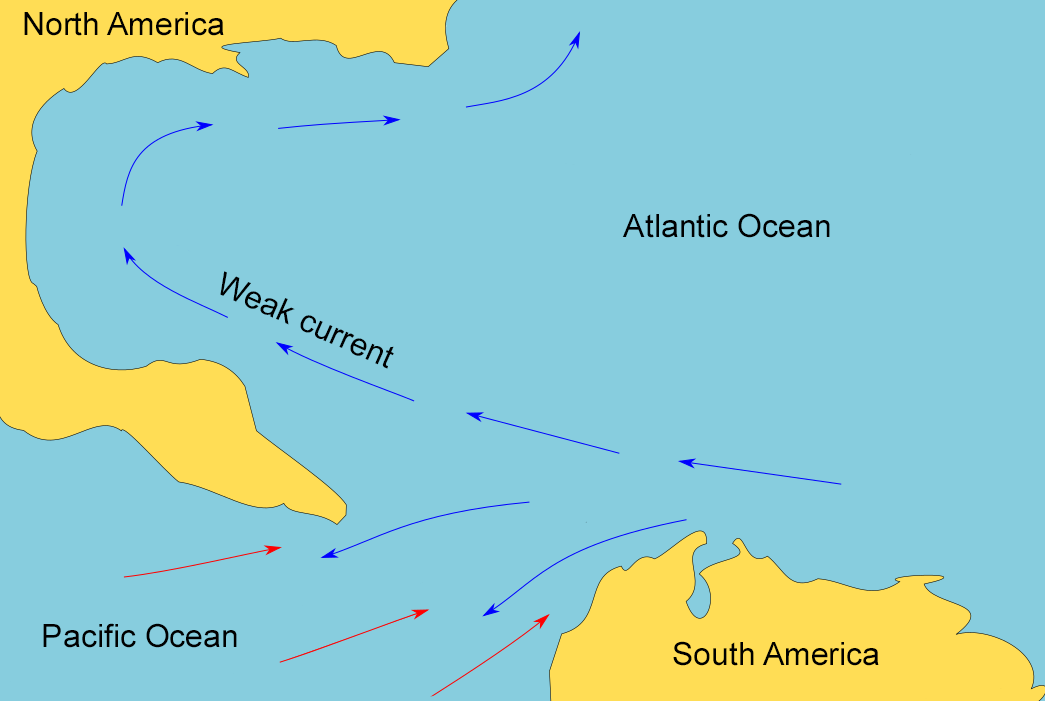
Map of the Gulf of Mexico region before the closure of the Isthmus of Panama. Before the Isthmus closed, the Atlantic and Pacific oceans were connected. Map modified from a map by Chiche Ojeda (Wikimedia Commons, Creative Commons Attribution-ShareAlike 4.0 International license, image cropped and modified).
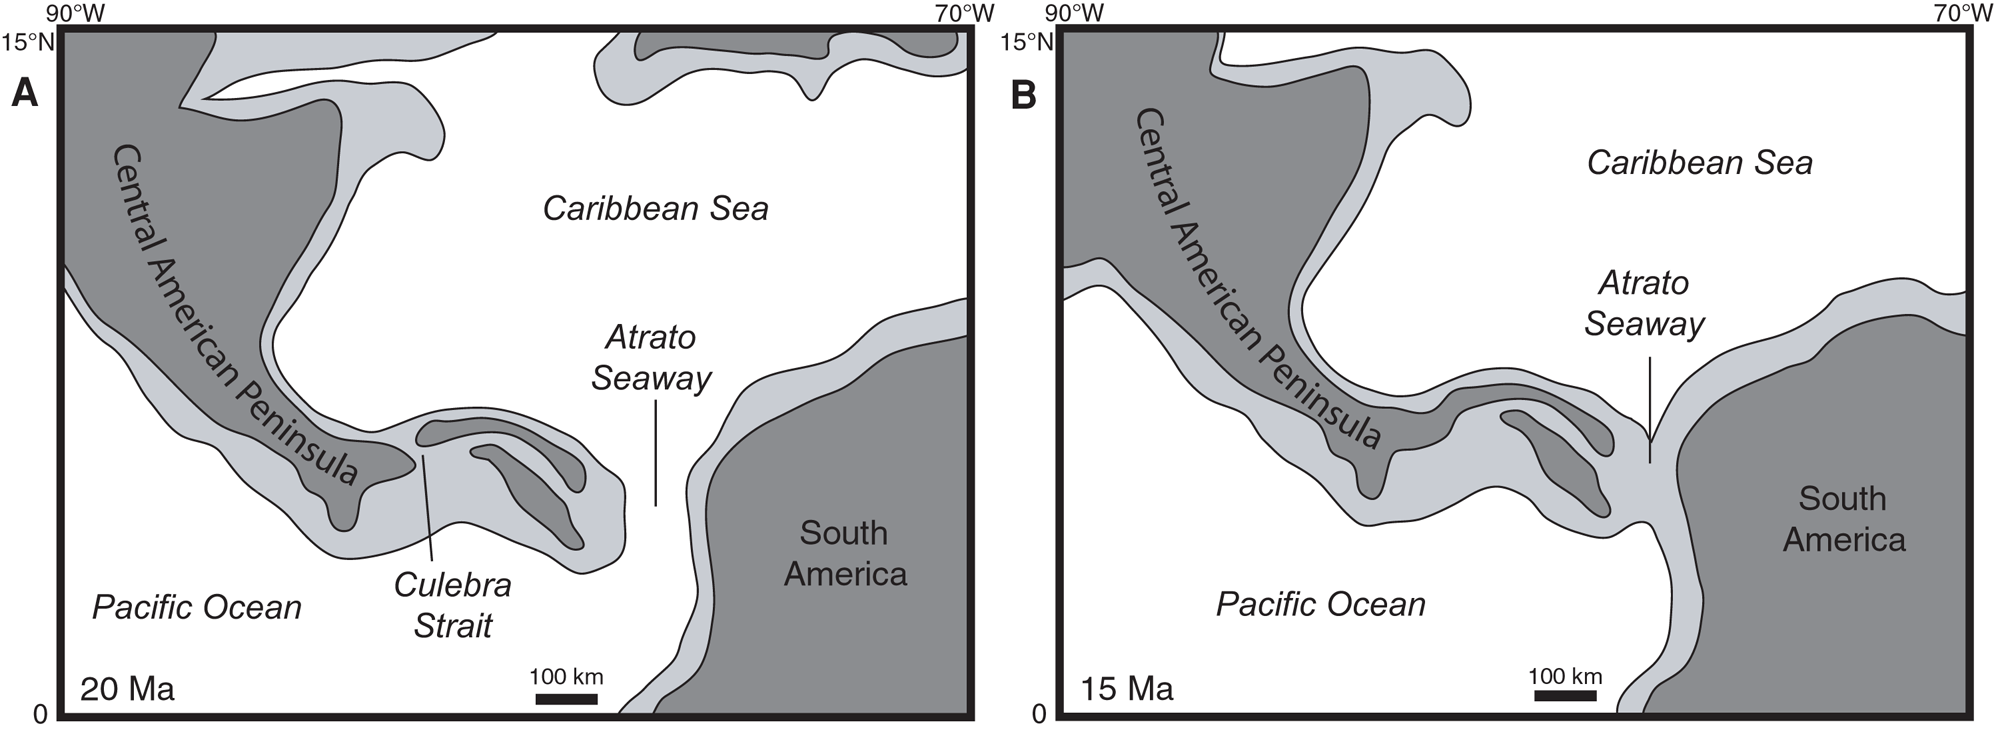
Maps showing the progressive closure of the Isthmus of Panama at 20 million years ago (A) and 15 million years ago (B). Dark gray is land, white and light gray are submerged areas. Modified from Figure 11 in Kirby et al. (2011) PLoS ONE 3(7): e2791 (Creative Commons Attribution license, image reorganized and resized).

Quaternary (2.6 million years ago to present)
Eventually, a sheet of sea ice formed over the Arctic, and ice sheets spread over northern Asia, Europe, and North America, signaling the start of the most recent ice age. Since 800,000 years ago, an equilibrium has been reached between warming and cooling, with the ice caps growing and retreating primarily due to the influence of astronomical forces (i.e., the combined gravitational effects of the Earth, Sun, moon, and planets). The ice sheets in the Northern Hemisphere covered much of the Northeast.
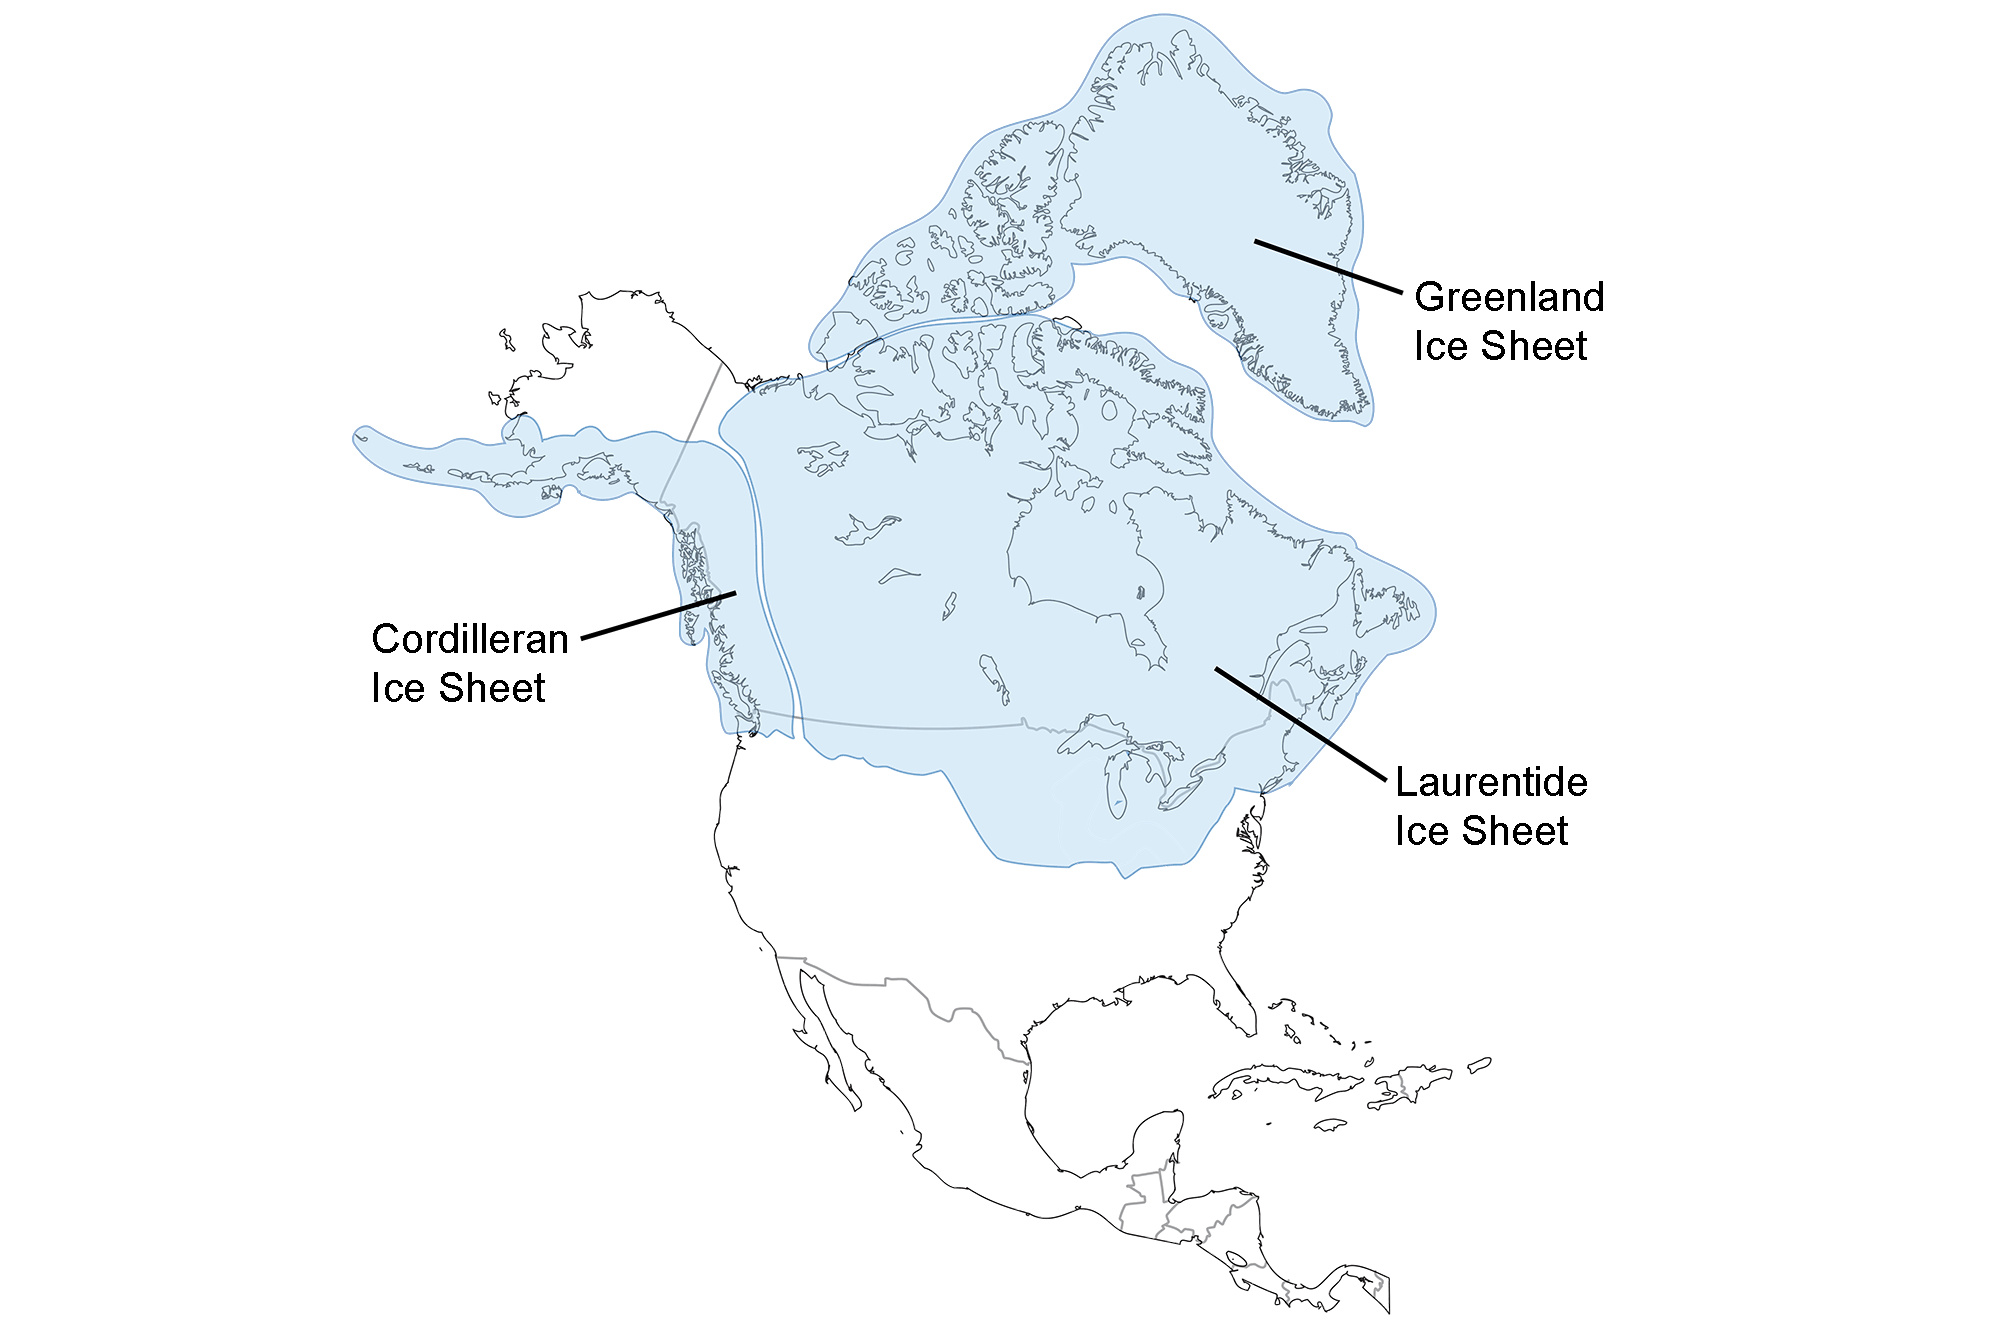
Extent of glaciation over North America at the Last Glacial Maximum. Image adapted from map by the USGS (public domain).
During the ice’s maximum extent, it reached from the North Pole to northern Pennsylvania, New Jersey, and Long Island, covering the northern states of the Northeast. The southern half of the Northeast was far colder than it is today. The temperatures in areas not covered in ice were moderated by the presence of ice. While the summers were much cooler, the winters were only a little cooler than they are today. The region was also somewhat wetter than it is today, with wetlands and forests covering much of what would later become grassland.
The glaciers last retreated from the Northeast around 10,000 years ago, leaving behind the Great Lakes, Lake Champlain, and many geologic features that define the landscape of the Northeast today, including eskers, kettles, thick deposits of sand and gravel, and even Long Island and Cape Cod, which are made up of moraine sediments. The climate grew warmer and slightly drier, much like that we experience today.
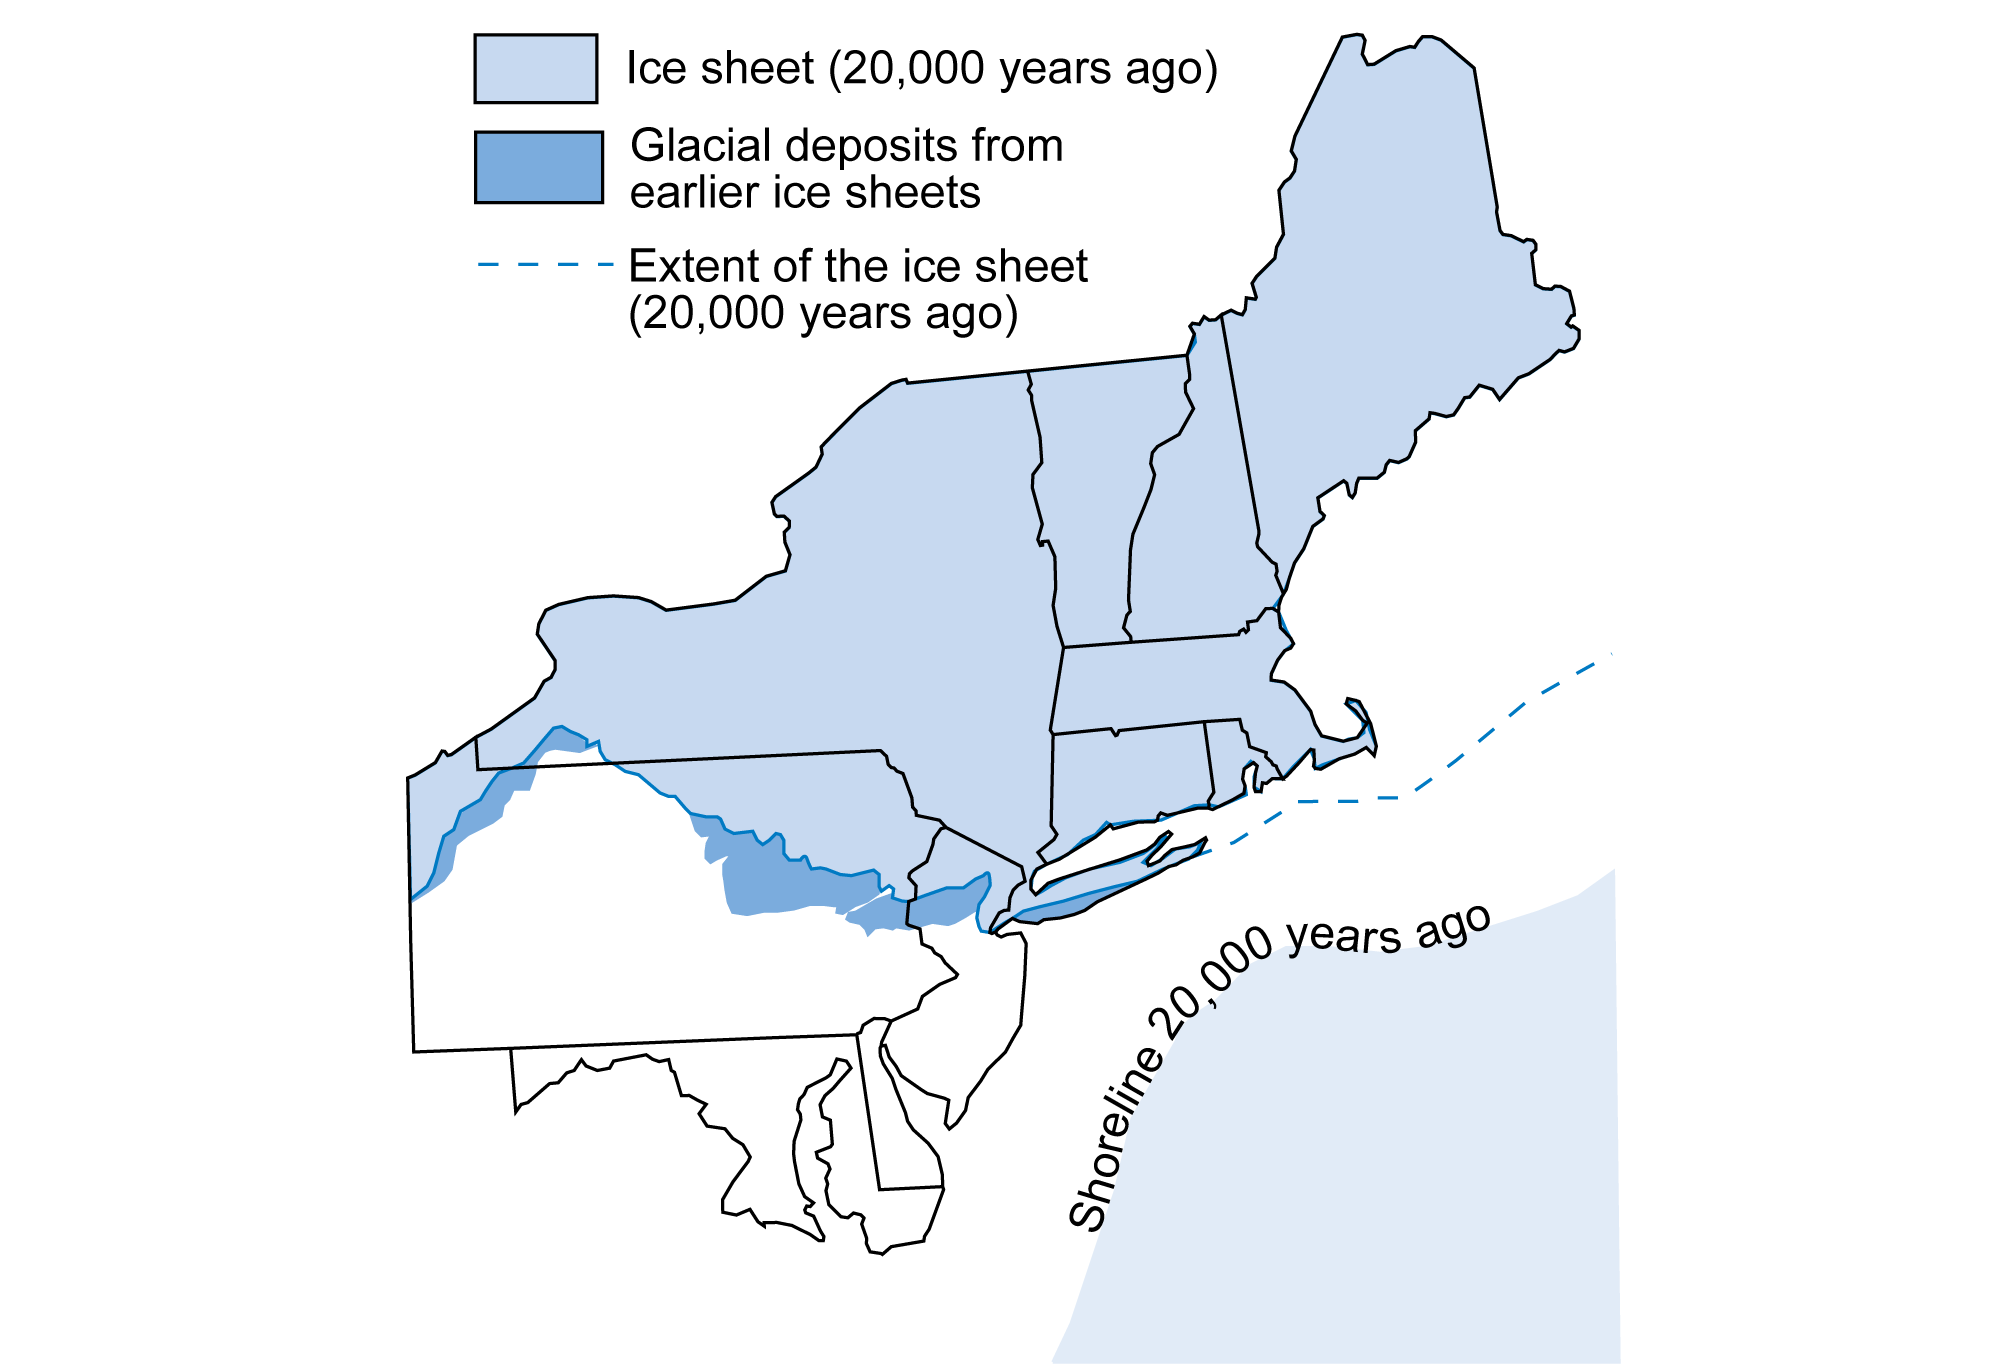
The approximate position of the ice sheet (light blue shading and blue line) about 20,000 years ago in the northeastern U.S. Medium blue areas are regions that were covered by earlier glacial deposits. Modified from figure 3.5 in The Teacher-Friendly Guide to the Geology of the Northeastern U.S. by J. E. Ansley (published in 2000 by the Paleontological Research Institution, reprinted in 2016).
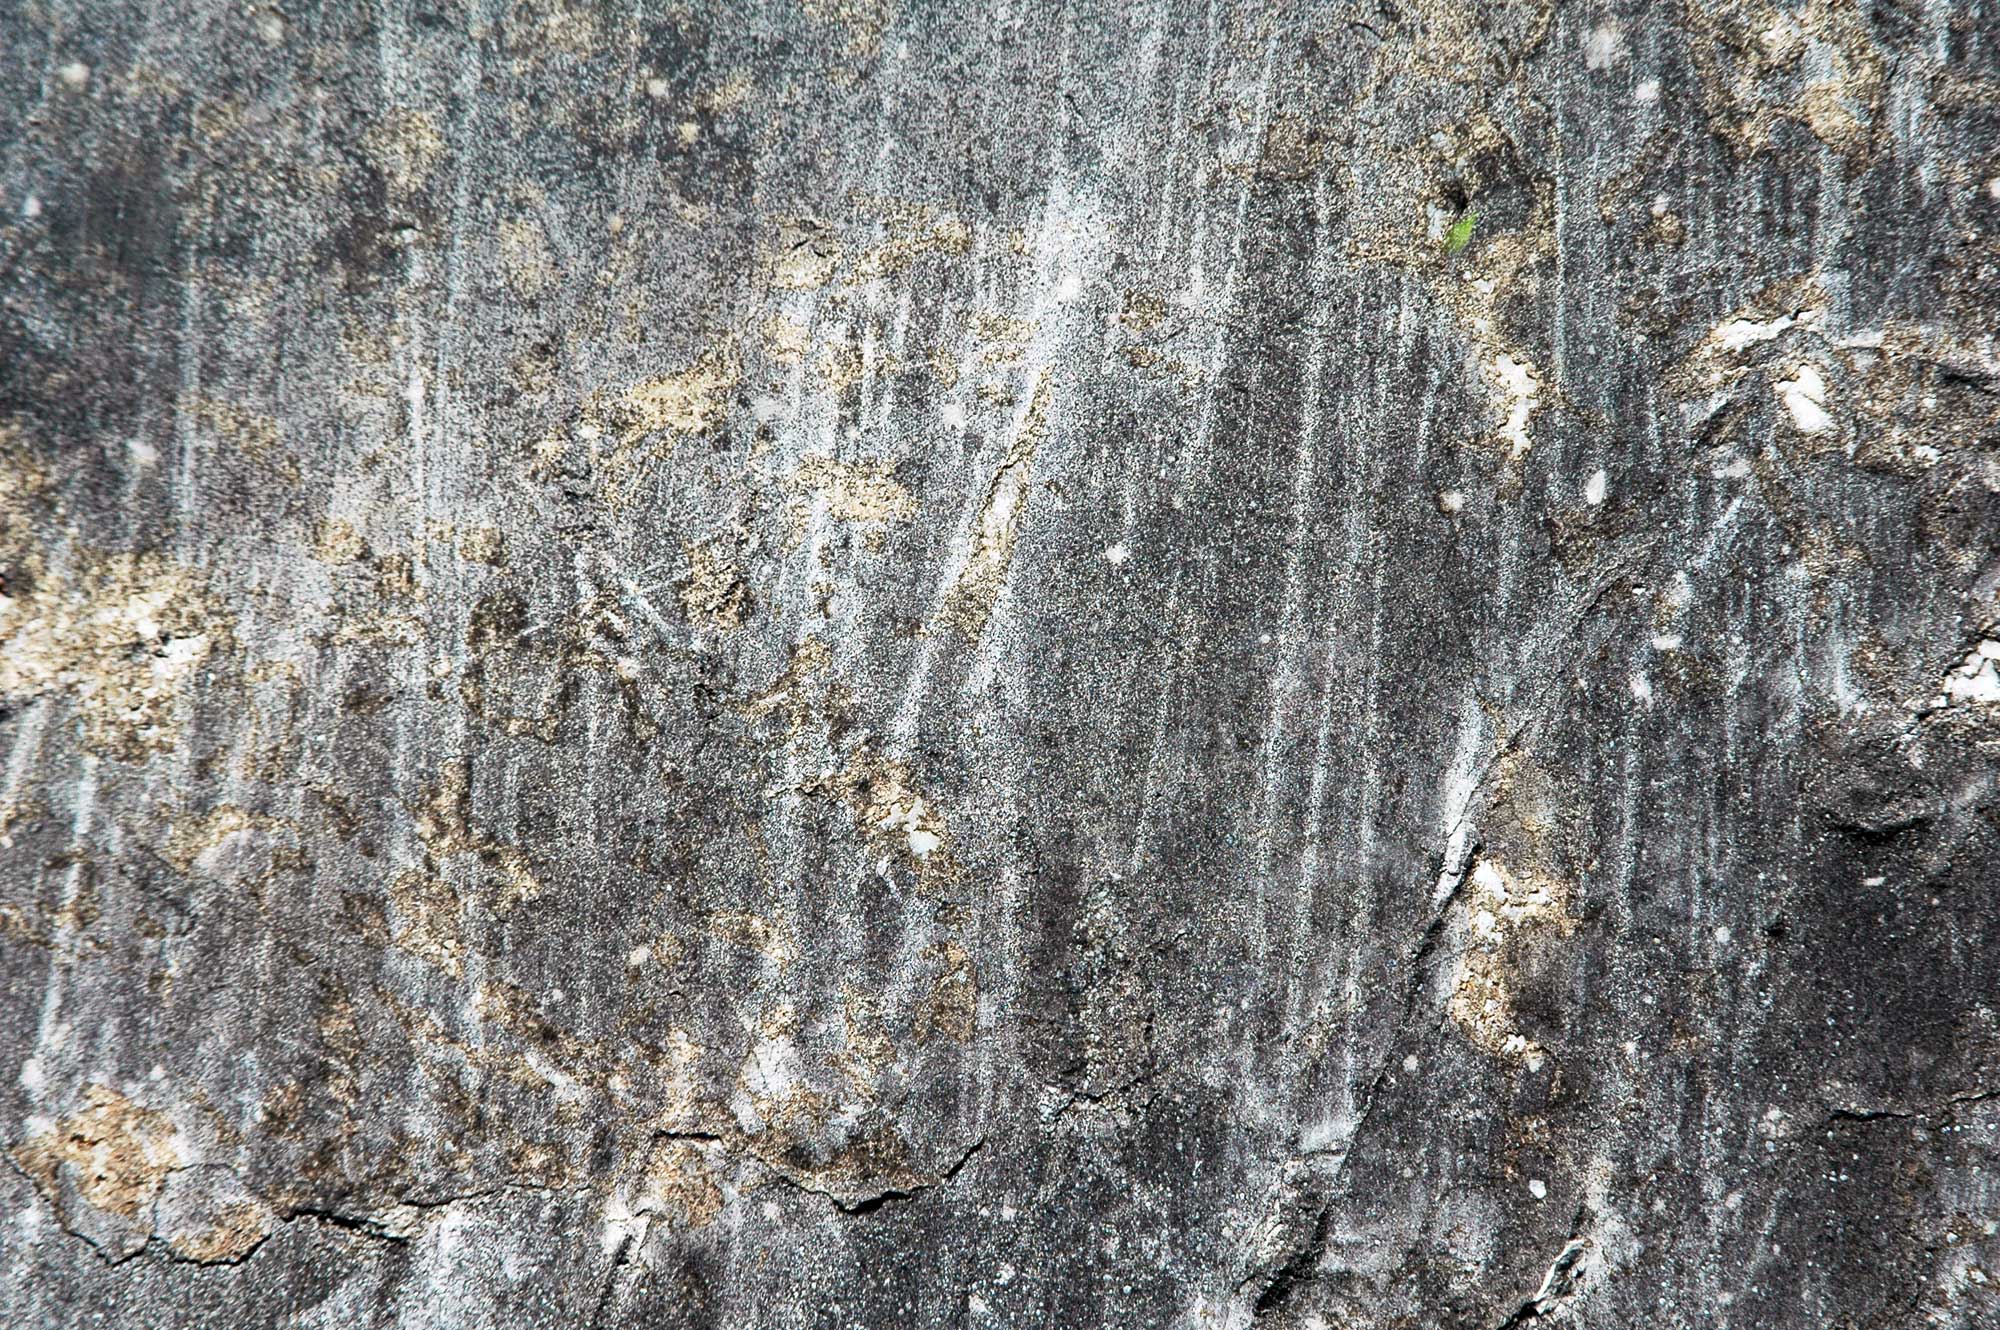
Glacial striations on dolomite, Chittenden County, Vermont. Photo by James St. John (flickr, Creative Commons Attribution 2.0 Generic license, image resized).
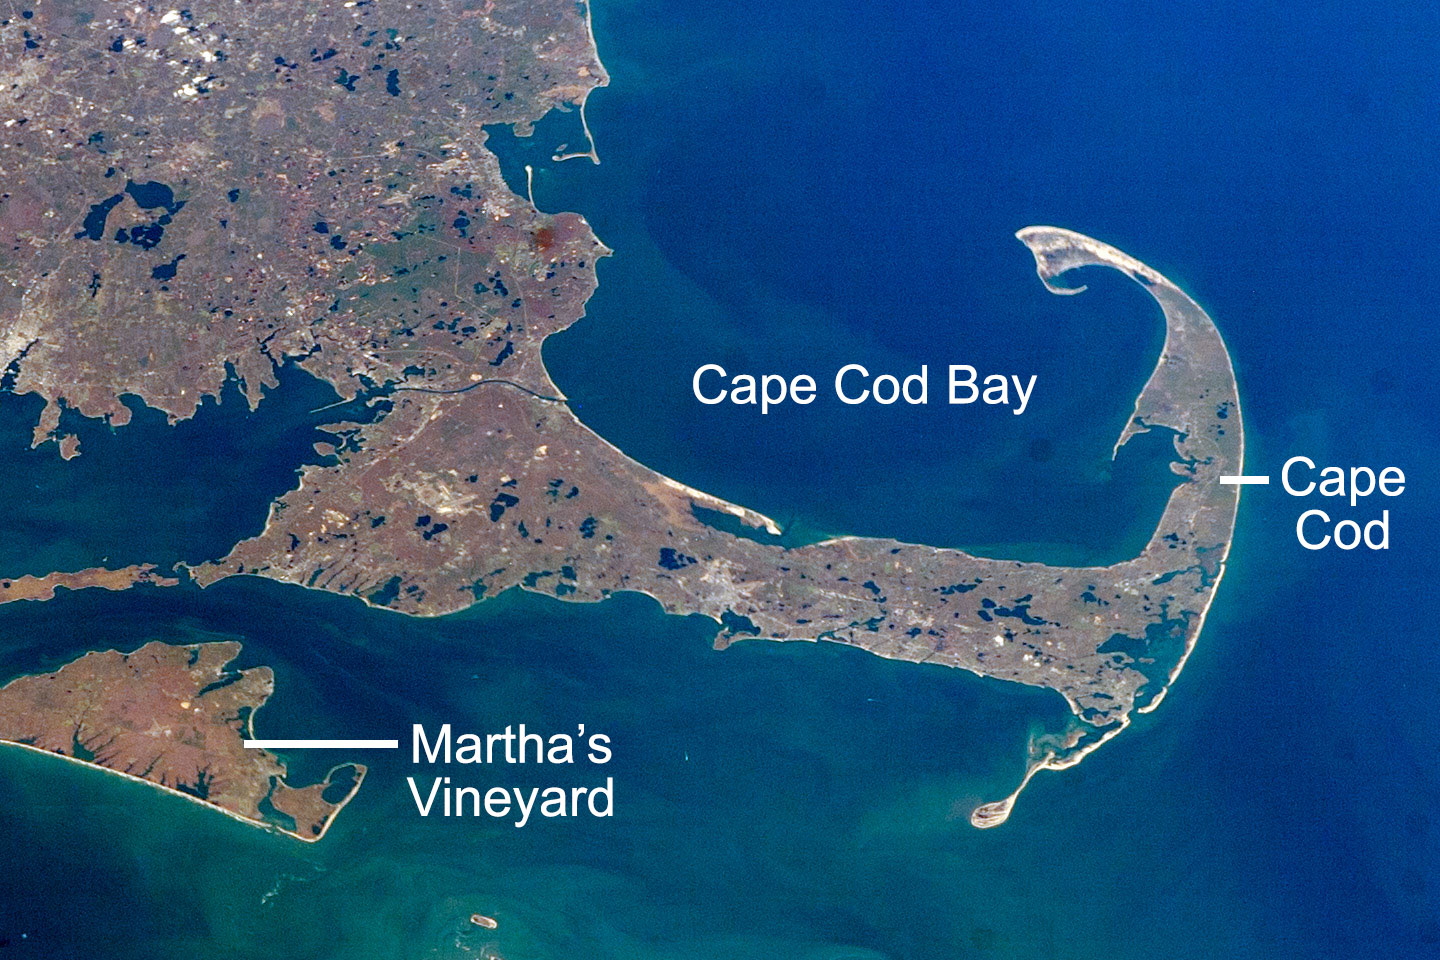
Satellite photo of Cape Cod, Massachusetts, and part fo Martha's Vineyard, November 7, 2007. These landforms are made up of moraines. Kettle lakes (discussed below) can be seen on Cape Cod and in mainland Massachusetts. Source: Astronaut photograph ISS016-E-10312, modified by NASA Earth Observatory (image used following NASA's image use policy).
Future climate of the northeastern U.S.
The Northeast contributes significantly to climate change. The population of any industrialized, and particularly wealthy, country produces pollution. The more than 60 million residents of the Northeast use electricity, transportation, and products that come from carbon-rich fossil fuels. The Northeast is also also a major center for agriculture, manufacturing, and coal, gas, and biofuel production, each of which release greenhouse gases. A final major reason for fossil fuel consumption in the Northeast is to generate heat for buildings during the winter (in other words, burning fuels to run furnaces and boilers). Heating systems in the Northeast may use coal, natural gas, propane, heating oil, pellets, wood, or other fuels.
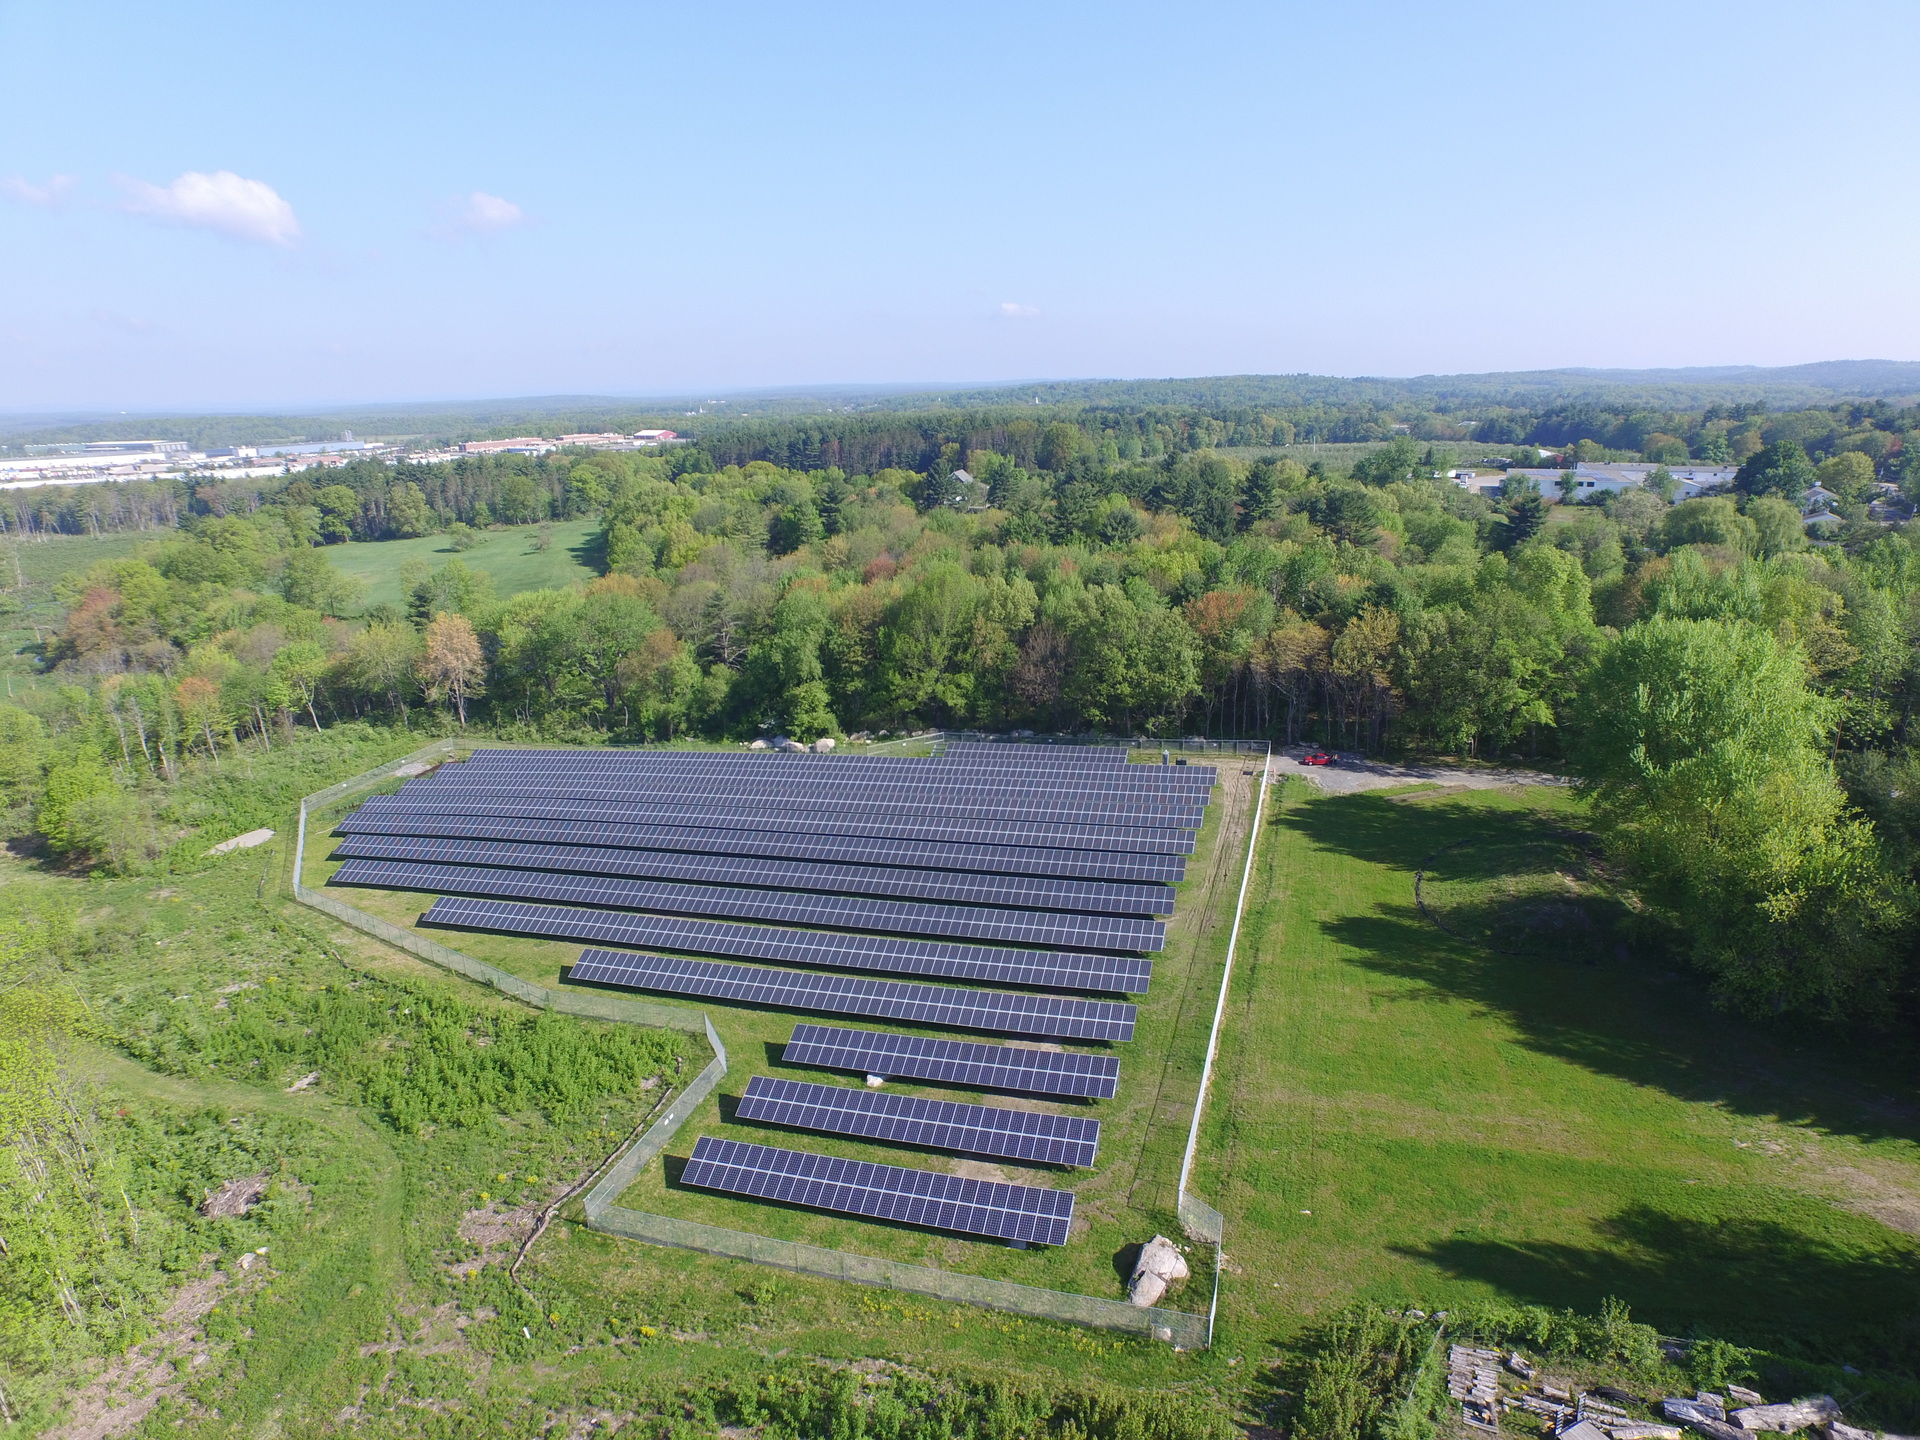
On the other hand, changes have taken and are continuing to take place in the Northeast to reduce the impact of humans on the climate. The height of deforestation in the Northeast took place in the 19th century, and forests that sequester carbon through the woody mass of tree trunks have returned significantly since then. Large northeastern cities, while still encouraging too much car travel, have extensive and well-used public transportation systems. In 2019, New York State passed the Climate Leadership and Community Protection Act, which calls for 100% zero-emissions electricity by 2040 and an 85% reduction (from 1990 levels) in greenhouse gas emissions by 2050. States, cities, towns, businesses, and individuals are working to reduce their greenhouse gas emissions.

Studies show that the Northeast’s climate is changing right now, and that change has accelerated in the latter part of the 20th century. These changes include the following:
- Average annual temperature increased at a rate of 0.3°C (0.6°F) per decade from 1970-2021.
- Average winter temperatures increased at a faster rate, 0.5°C (0.9°F) per decade from 1970-2021. Over this approximately 50-year time period, that amounts to a 2.5°C (4.5°F) rise.
- In New York State, average annual rainfall is up more than eight centimeters (three inches) since 1970.
- As of 2005, lilacs, apple trees, and grape vines were blooming four to nine days earlier than they did in the 1960s.
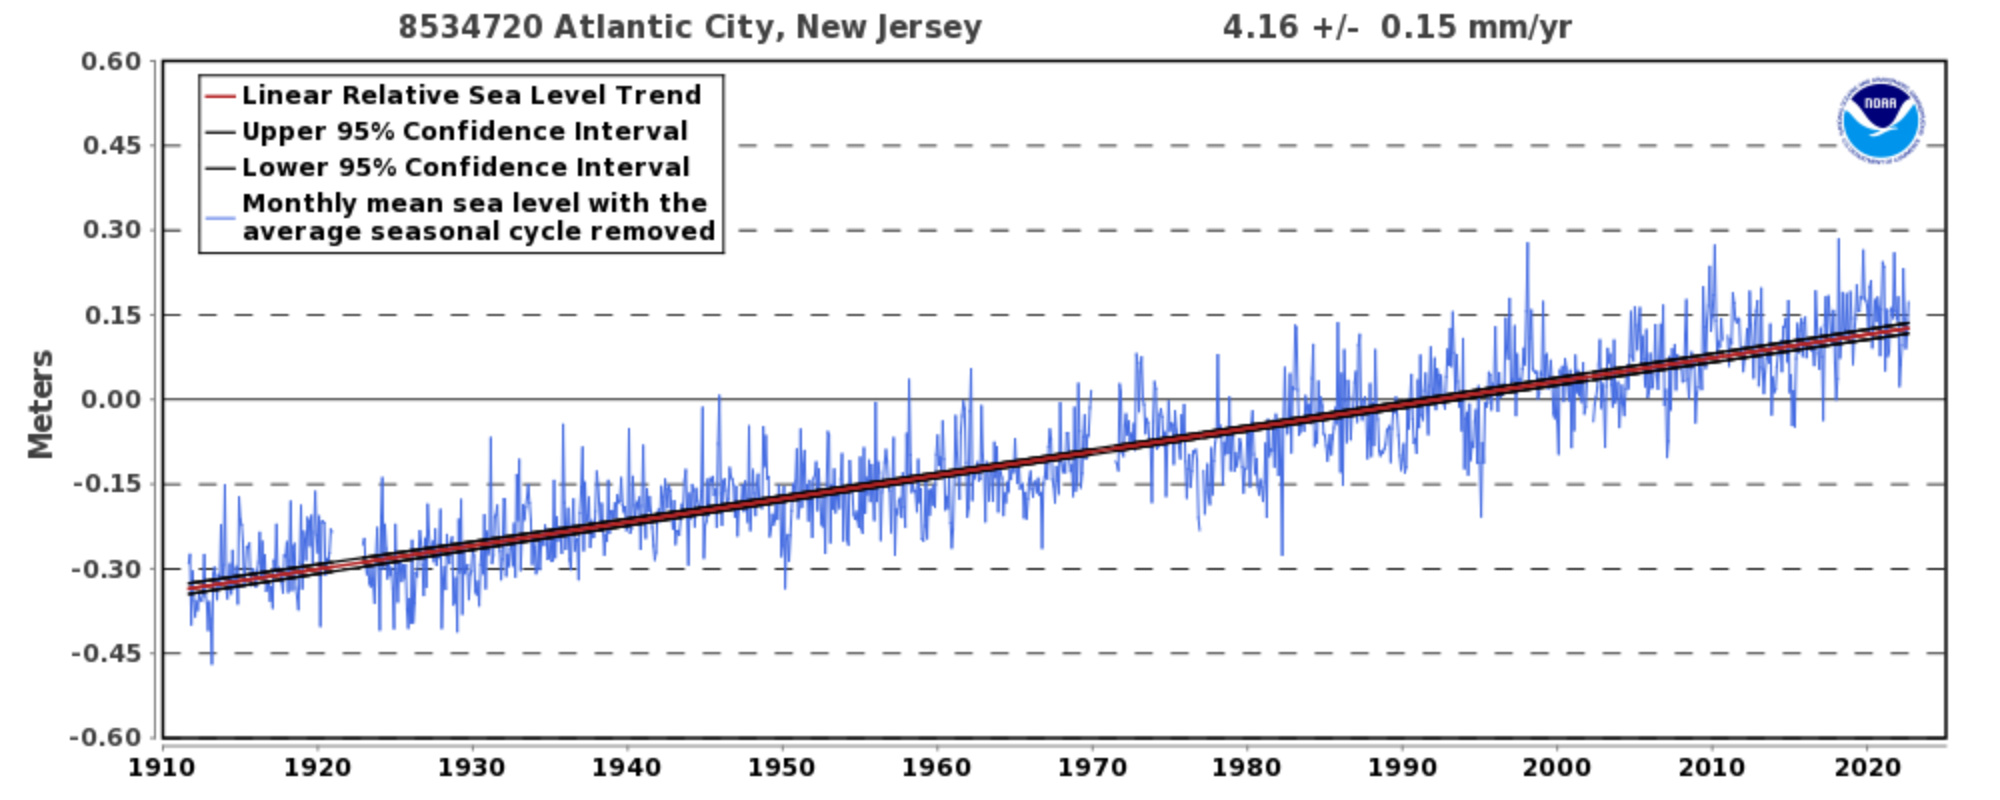
- Sea level on the coast rose three centimeters (1.2 inches) per decade on average in the 20th century.
- Sea level is rising three to four times faster on the East Coast than it is worldwide.
Future temperature
Climate models predict that the Northeast’s average annual temperature will rise 2.5°C to 5.5°C (4.5°F to 10°F) by the 2080s if carbon emissions remain high, and 1.7°C to 3.3°C (3°F to 6°F) by the 2080s if carbon emissions are reduced dramatically. By the latter part of 21st century, rising temperatures and increased humidity mean that summers in New Hampshire are likely to feel more like summers today in Virginia, North Carolina, or Georgia. More intense heat waves are a concern for the populations of large cities, dairy farmers, and anglers. In the last few decades, winters have been warming more rapidly than summers have, but models suggest that whether this trend continues will depend on future greenhouse gas emissions.
Future precipitation
Winter precipitation is projected to increase by about 5% to 20% across the Northeast by the end of the 21st century. Because of warming temperatures, a bigger fraction of winter precipitation will fall as rain rather than snow. Heavy downpours have been increasing in frequency, a trend that is expected to continue. Increases in extreme rain have been greater in the Northeast than in any other region of the U.S.
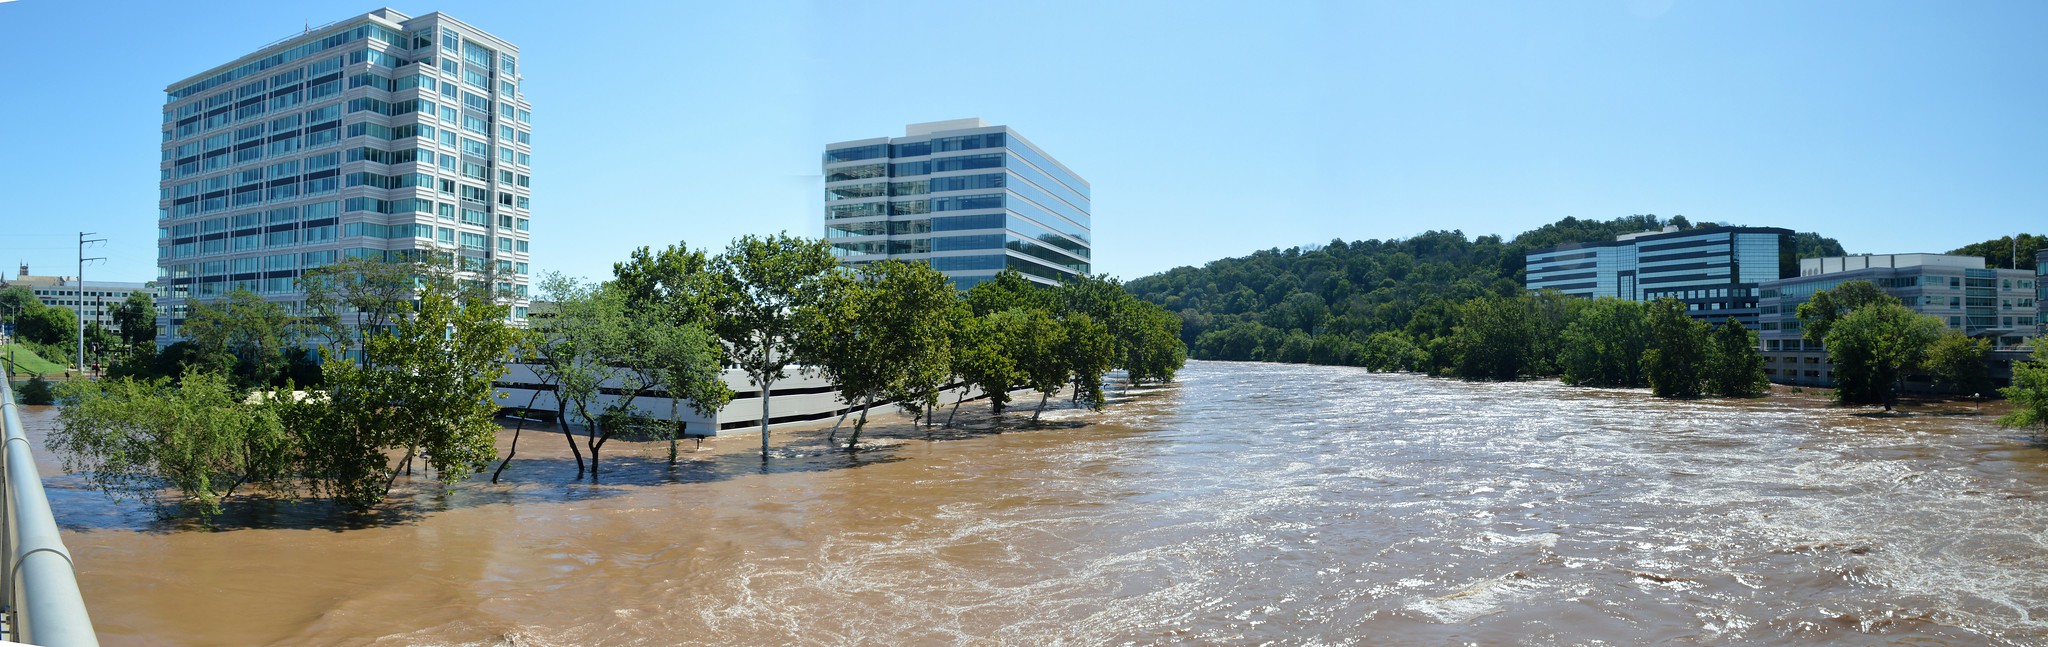
Flooding from the remains of Hurricane Ida in Montgomery County, PA, 2021. Photo: Michael Stokes (CC BY 2.0 license) via Flickr.
Snow cover, a common winter feature across much of the Northeast, has been decreasing and will likely continue to do so. Changes in snowmelt and rainfall will change the flow of water in streams, affecting fish and other wildlife as well as human communities subject to flooding. Short-term droughts—lasting one to three months—caused by warmer temperatures leading to more evaporation of soil moisture and less and earlier snow melt are likely to become more common, especially in the Adirondack and Catskill mountains and in New England.
Sea level rise
Sea level rise is a great concern in the Northeast, with its extensive coastline and many vulnerable low-lying areas, especially in big cities. A rising sea leads to loss of wetlands, coastal erosion and property damage, larger and more damaging storm surges, inundation of populated areas, and stresses on municipal water and sewer systems.
Sea level has risen steadily in the 20th century and is projected to continue rising as the world’s glaciers and ice sheets melt and a warmer ocean undergoes thermal expansion. By the year 2100, sea level may rise by 38 to 191 centimeters (15 to 75 inches) along New York’s coast, depending on the greenhouse gas emissions resulting from the choices we make.

A house in Seaford, New York, being raised following Hurricane Sandy in an attempt to limit damage during future hurricanes. Photo by Howard Greenblatt/FEMA (National Archives identifier 24473381, unrestricted use).
Resources
Resources from the Paleontological Research Institution
Books
Zabel, I.H.H., D. Haas, and R.M. Ross. 2017. The Teacher-Friendly Guide to Climate Change. Paleontological Research Institution Special Publication 53, Ithaca, NY, 294 pp. Find updated, digital versions of the chapters of this book on Earth@Home Climate.
Allmon, W. D., T. A. Smrecak, and R. M. Ross. 2010. Climate change—past, present & future: a very short guide. Paleontological Research Institution Special Publication 38, Ithaca, NY, 200 pp.
Websites
Earth@Home Climate: https://climate.earthathome.org/
Earth@Home: Quick guides & FAQ: Climate and Energy: https://earthathome.org/quick-faqs/#climate
Earth@Home: Here on Earth: Introduction to Climate: https://earthathome.org/hoe/climate/