

Page snapshot: Introduction to the climate of the southeastern U.S., including present, past, and future climate.
Topics covered on this page: Present climate of the southeastern U.S.; Present temperature; Present Precipitation; Severe Weather; Regional climate variation; Past climate of the Southeastern US; Paleozoic; Mesozoic; Cenozoic; Future climate of the southeastern U.S.; Resources.
Credits: Most of the text of this page is derived from "Climate of the Southeastern US" by Ingrid H.H. Zabel, J.T. Parish, and D. Haas, chapter 8 in The Teacher-Friendly Guide to the Earth Science of the Southeastern US, 2nd. ed., edited by Andrielle N. Swaby, Mark D. Lucas, and Robert M. Ross (published in 2016 by the Paleontological Research Institution; currently out of print). The book was adapted for the web by Elizabeth J. Hermsen and Jonathan R. Hendricks in 2021–2022. Changes include formatting and revisions to the text and images. Credits for individual images are given in figure captions.
Updates: Page last updated September 28, 2022.
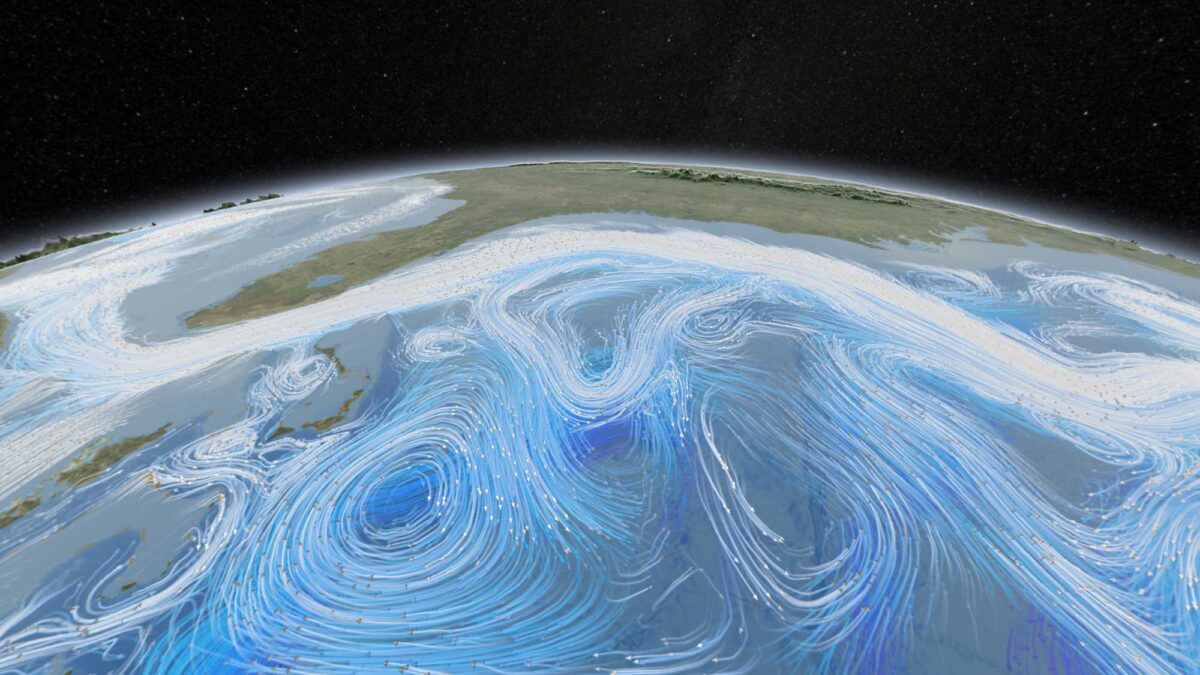
Image above: Depiction of ocean currents swirling off the Atlantic coast of the southeastern United States. Image by NASA (Flickr; Creative Commons Attribution 2.0 Generic license).
Present climate of the southeastern U.S.
The location of the Southeast and its direct relationship to the Gulf of Mexico and Atlantic Ocean strongly influence the area's weather. Since it encompasses locations along the coast as well as areas farther inland, the Southeast experiences nearly every variety of extreme weather. Heat waves and cold snaps, droughts, floods, blizzards, tornados, and hurricanes all affect the Southeast.
Although much of the Southeast falls within the category of a warm temperate zone, using a single label to describe the Southeast's climate obscures its diversity. The main features that influence the Southeast's climate are latitude, the presence of the Atlantic Ocean and the Gulf of Mexico, and regional topography. For example, the Florida peninsula has a distinct summer rainy season, while other inland areas receive uniform precipitation throughout the year. The highest elevations in North Carolina and Tennessee can receive as much snow as parts of New England.
Temperature
Average temperatures in the Southeast tend to decrease northward, which is simply the influence of latitude; lower latitudes receive more heat from the sun over the course of a year. The warmest temperatures are found in Florida, Georgia, and Mississippi, while the coolest are found in West Virginia and Virginia. The Southeast's overall average high temperature of 22°C (72°F) and average low of 9°C (48°F) reflect, on the whole, a more uniform climate than that found in most other parts of the United States. By comparison, the average high and low temperatures for the entire United States are 17°C (63°F) and 5°C (41°F), respectively.
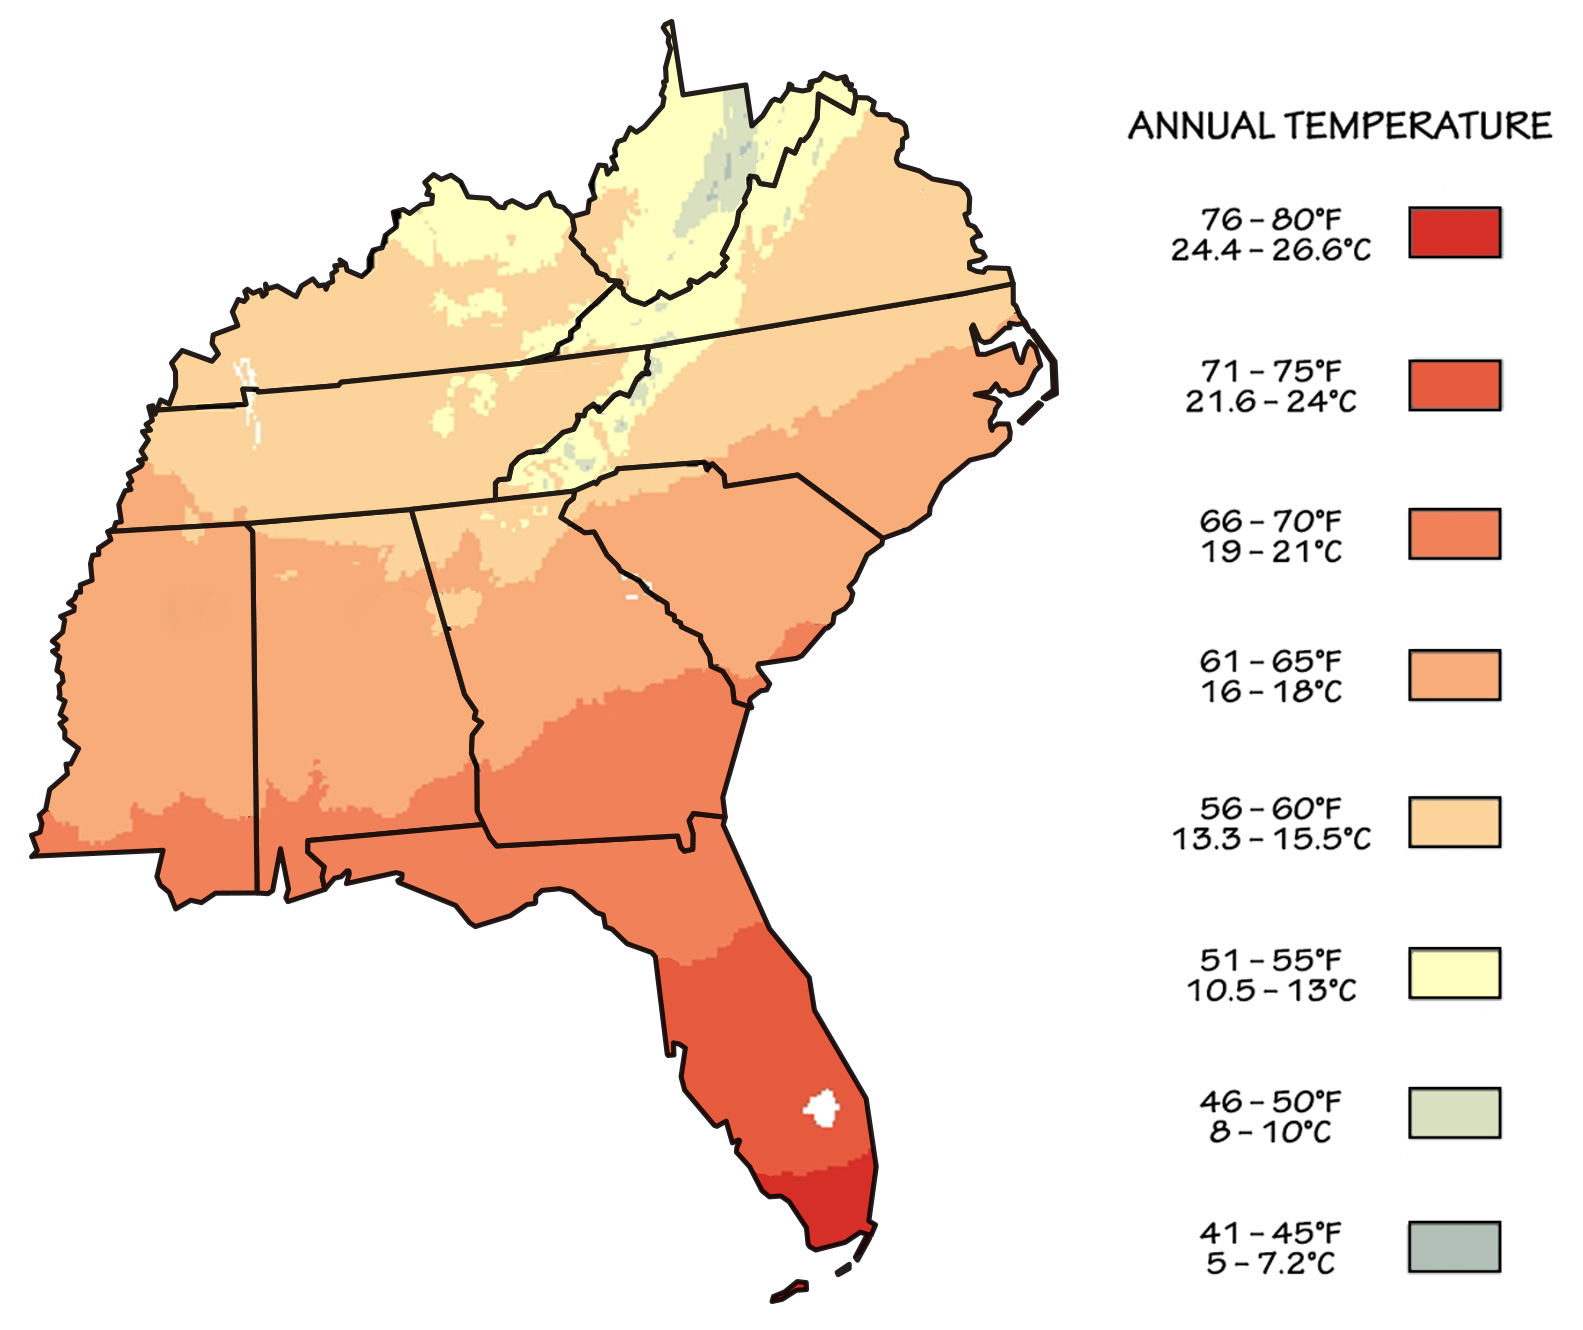
Another factor besides latitude that influences temperature in the Southeast is proximity to the ocean, which has a moderating influence. Air masses that have passed the Gulf of Mexico rarely get either extremely hot or extremely cold, and the Gulf Stream current that travels northward past the Atlantic seaboard carries warm tropical water with it, influencing temperatures on land. Thus, the most extreme temperatures in the Southeast are found toward the center of the continent.
The record for highest temperature in the Southeast is held by Mississippi, which has experienced a high of 46°C (115°F). The record low temperature of −38°C (−37°F) is shared by Kentucky and West Virginia. Of course, major temperature fluctuations can occur in every state. In July, average daily maximum temperatures range from 35°C (95°F) in southern Georgia and Florida to 24°C (75°F) in mountainous parts of West Virginia. Wintertime has a broader range of temperatures, with average daily minimums in January varying from around −7°C (20°F) in northern Kentucky to 16°C (60°F) in South Florida. Although the Southeast's climate is subtropical, it can get cold. Subfreezing temperatures are sometimes a concern for Florida orange growers, since oranges are particularly sensitive to damage in freezing conditions.
Average Annual Temperatures in the Southeastern United States
| Florida | 22.0°C (71.6°F) | 16.7°C (62.1°F) | 27.5°C (81.5°F) |
| Georgia | 17.3°C (63.1°F) | 11.0°C (51.8°F) | 23.7°C (74.7°F) |
| Mississippi | 17.2°C (63.0°F) | 10.9°C (51.6°F) | 23.4°C (74.1°F) |
| South Carolina | 16.9°C (62.4°F) | 10.6°C (51.1°F) | 23.2°C (73.8°F) |
| Alabama | 15.8°C (60.4°F) | 9.7°C (49.5°F) | 22.1°C (71.8°F) |
| North Carolina | 14.6°C (58.3°F) | 8.5°C (47.3°F) | 20.8°C (69.4°F) |
| Tennessee | 14.2°C (57.6°F) | 7.9°C (46.2°F) | 20.5°C (68.9°F) |
| Kentucky | 13.3°C (55.9°F) | 7.0°C (44.6°F) | 19.6°C (67.3°F) |
| Virginia | 12.3°C (54.1°F) | 6.2°C (43.2°F) | 18.5°C (65.3°F) |
| West Virginia | 10.9°C (51.6°F) | 4.5°C (40.1°F) | 17.0°C (62.6°F) |
Precipitation
The average amount of precipitation for the United States is 85.6 centimeters (33.7 inches). In the Southeast, however, average annual precipitation typically ranges from about 100 to 125 centimeters (40 to 50 inches) inland to over 150 centimeters (60 inches) along the Gulf Coast of Mississippi, Alabama, and the Florida Panhandle. High annual precipitation in near the Gulf Coast demonstrates the impact of moisture carried inland from the adjacent Gulf of Mexico. Some pockets of high precipitation also occur in the Appalachian Mountains along the Eastern Continental Divide, a topographical high point where air is forced upward from both sides of the mountain range. High precipitation also occurs along the Atlantic coast.
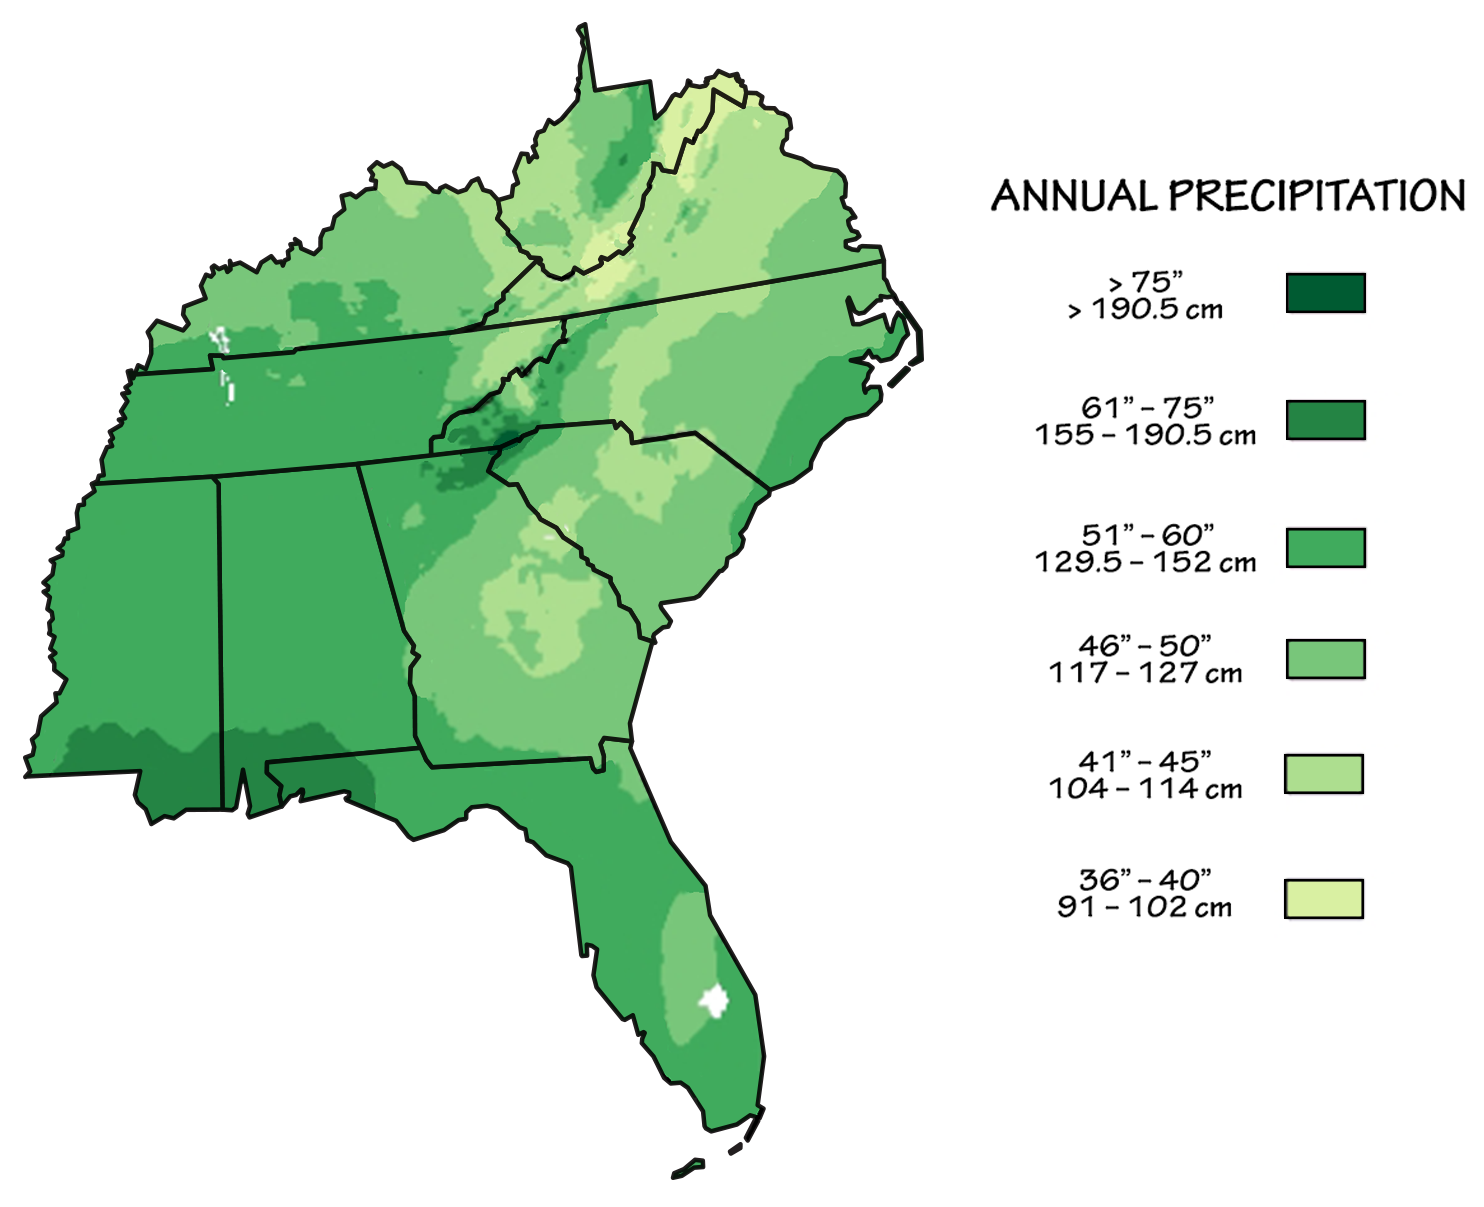
Average annual preciptiation for the southeastern U.S. Image adapted from an image by Scenarios for Climate Assessment and Adaptation, first published in The Teacher-Friendly Guide to the Earth Science of the Southeastern US, 2nd ed., edited by Andrielle N. Swaby, Mark D. Lucas, and Robert M. Ross (published by the Paleontological Research Institution) (CC BY-NC-SA 4.0 license).
Severe Weather
Hurricanes
In the summer and fall tropical cyclones (hurricanes) often bring heavy rains to the Gulf and Atlantic coasts. Some of these cyclones, such as Hurricane Andrew in 1992, are extremely powerful and have devastated communities in the Southeast. Thousand-year weather events, referring to the 1-in-1000 chance of intense events happening in a given year, have increased in frequency in recent years, and climate models predict a continuation of that increase. One such event occurred in the fall of 2015 when heavy rains associated with Hurricane Joaquin (but not actually part of the hurricane) brought over 50 centimeters (20 inches) of rain to parts of South Carolina, causing over one billion dollars in damage.
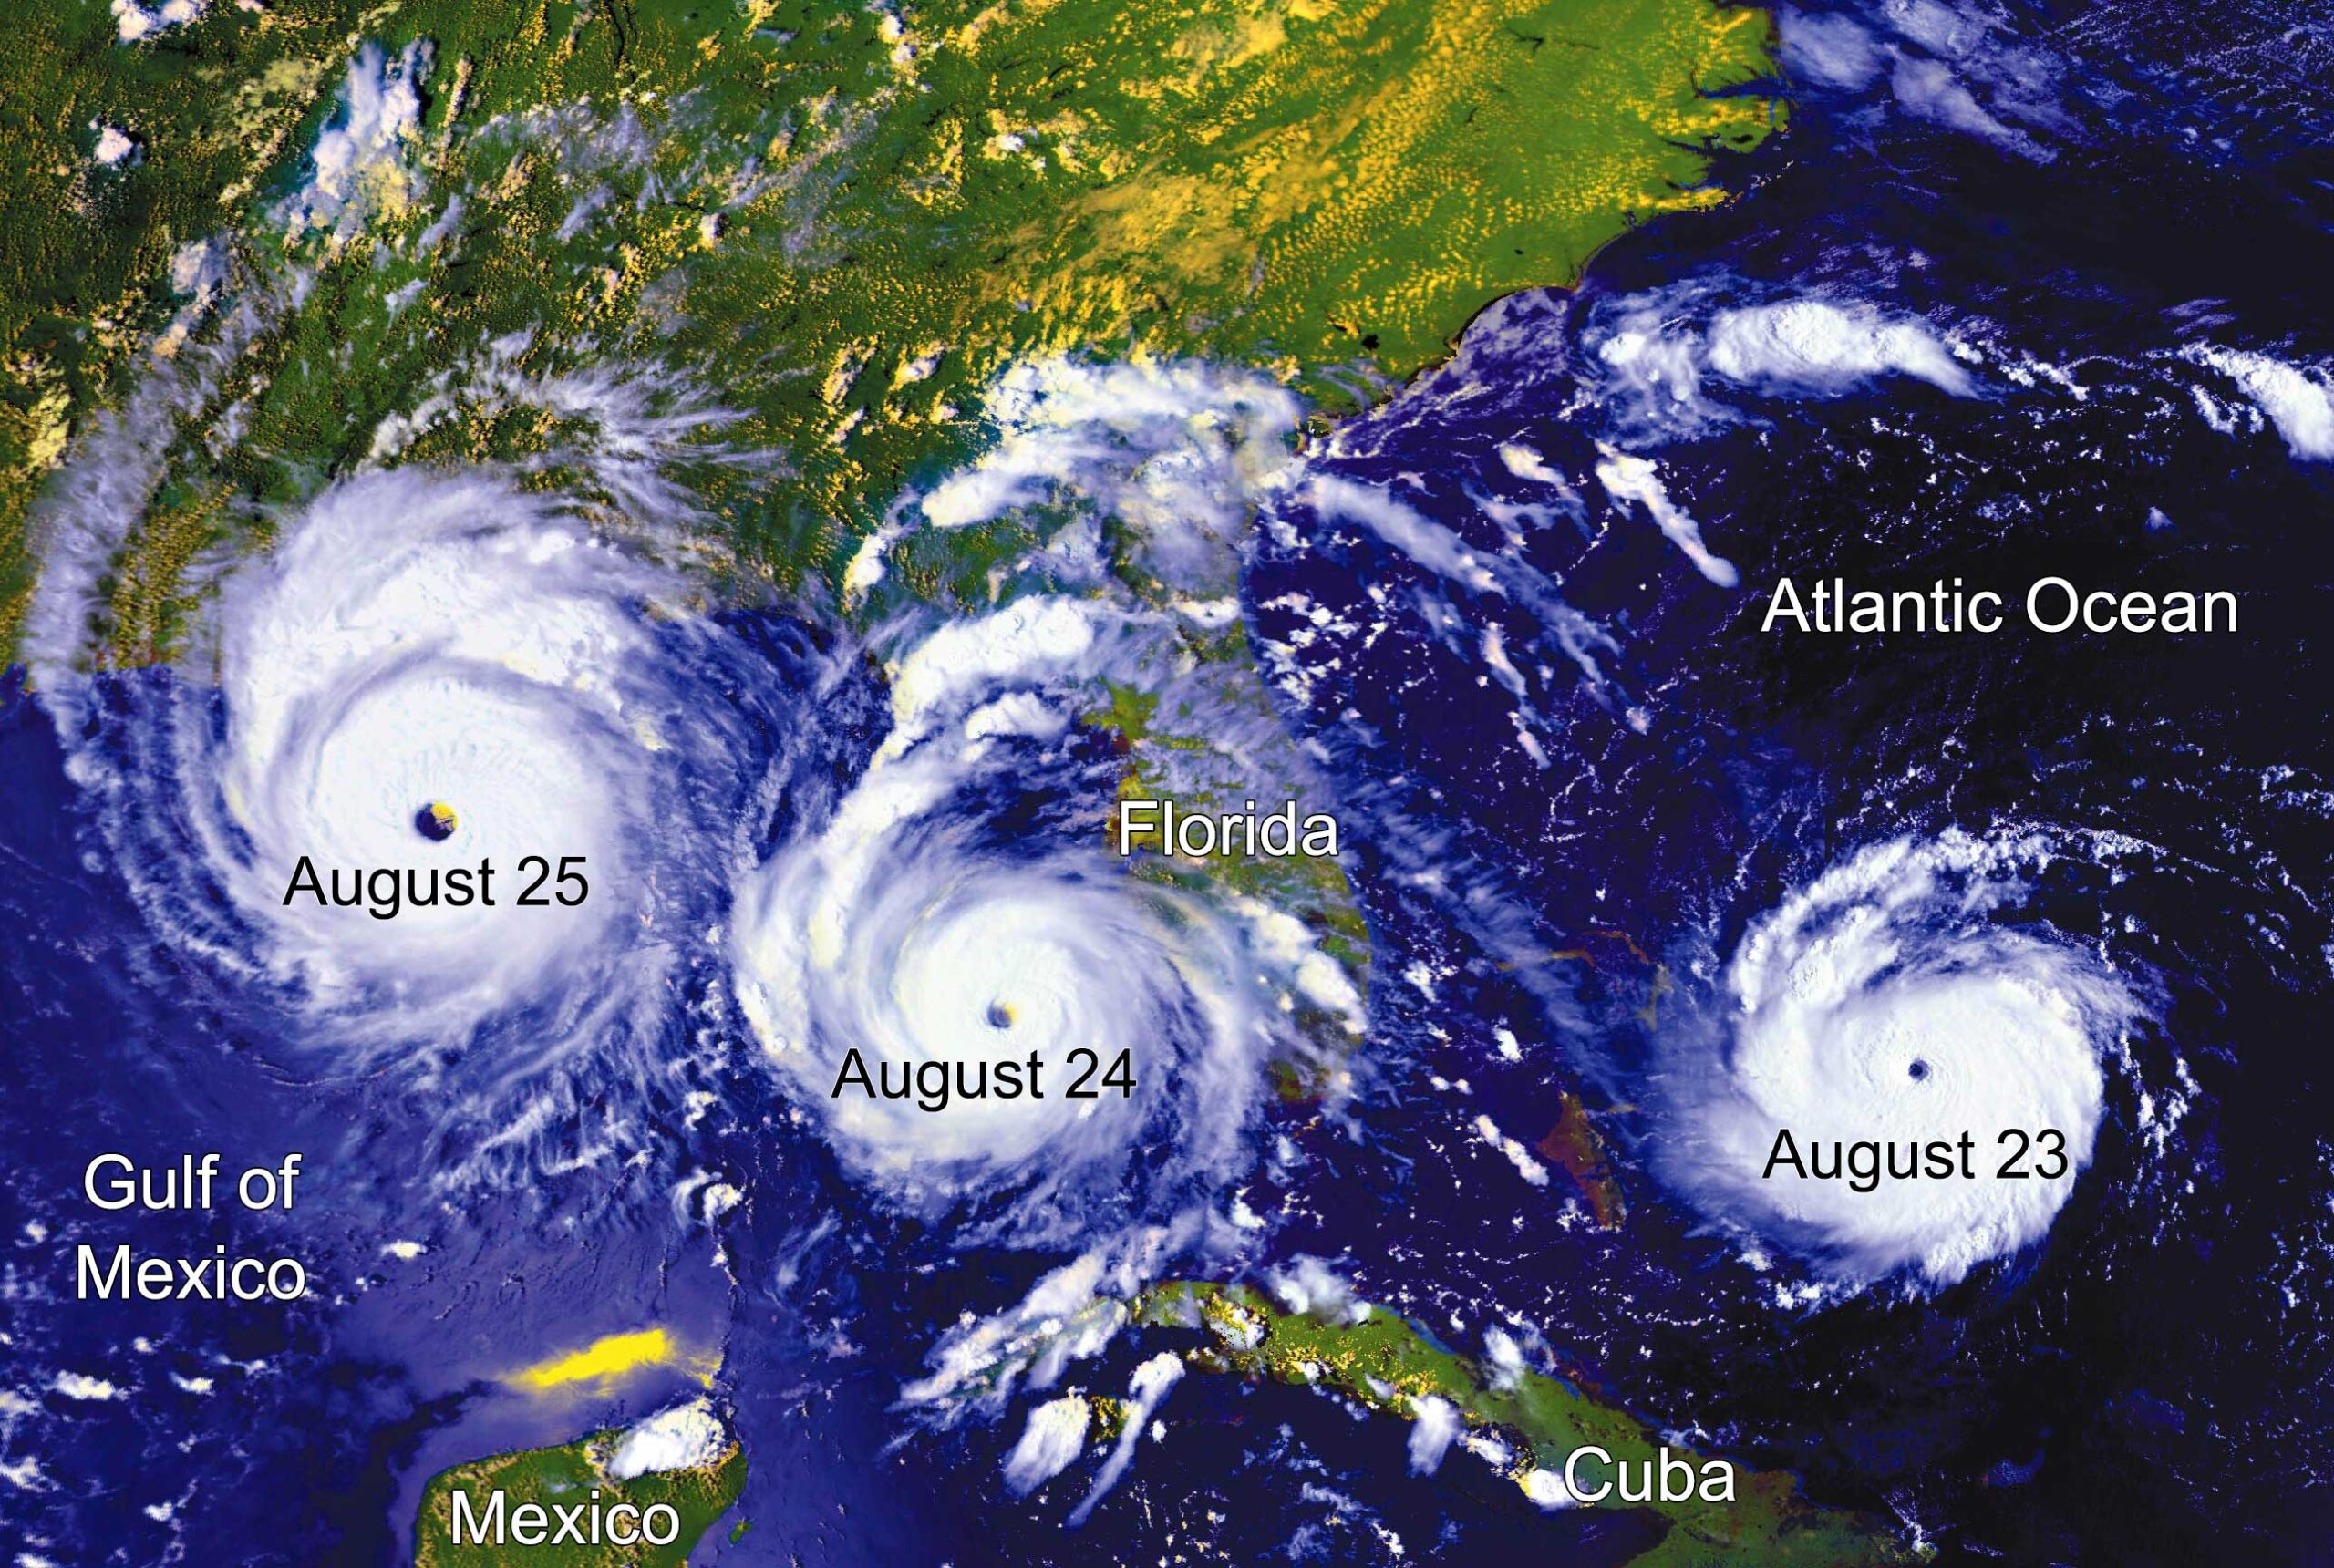
Time series of satellite images showing Hurricane Andrew moving from the Atlantic Ocean, west over the tip of the Florida Peninsula, and into the Gulf of Mexico over the course of three days in 1992. Hurricane Andrew was a Category 5 storm when it hit Florida, meaning that it had sustained winds of at least 252 kilometers per hour (157 miles per hour) and was capable of catastrophic damage. Image modified from "Remembering Hurricane Andrew," NASA Earth Observatory.
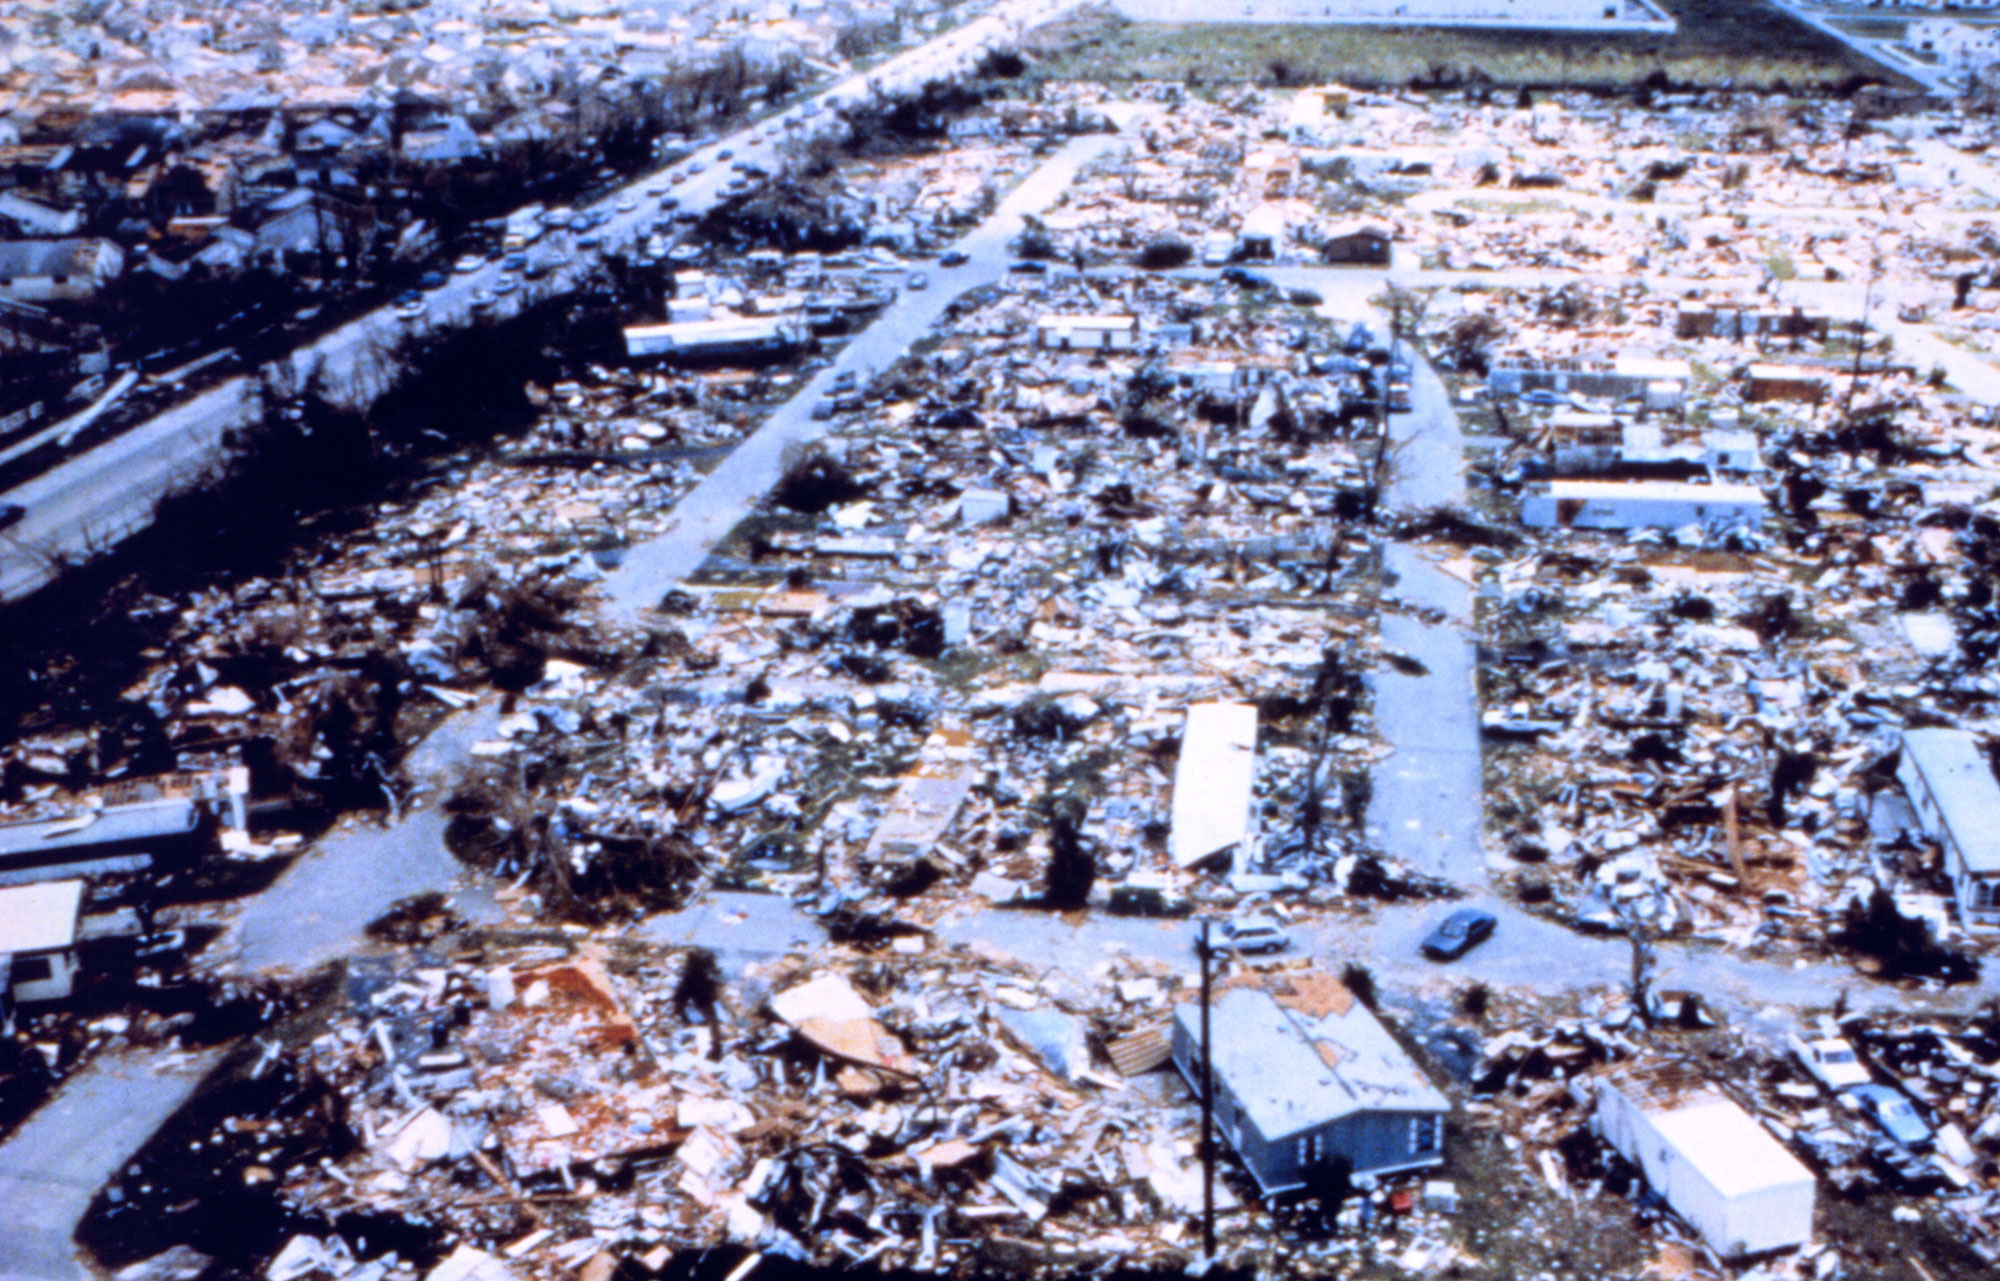
Dadeland Mobile Home Park following Hurricane Andrew. Photo from NOAA Photo Library (flickr, Creative Commons Attribution 2.0 Generic license, image resized).
Thunderstorms and tornados
The geography and climate of the Southeast are nearly ideal for their formation of thunderstorms and tornados, especially in the summer.
Storms form when there is strong convection in the atmosphere. Convection occurs when buoyant warm air rises (moves up) while denser cool air sinks (moves down). Convective mixing forces the moisture in warm air to condense as it comes into contact with cool air, forming vapor (clouds) and precipitation (for example, rain or hail). A strong difference in air temperature at different heights creates instability; the warmer the air near the surface is relative to the air above it, the more potential (stored) energy the warm air has to move up, and the more potential for a storm. The final ingredient is wind. Wind moves the air, promoting mixing. The formation of precipitation also causes electrical charging of particles in the atmosphere, which in turn produces lightning.
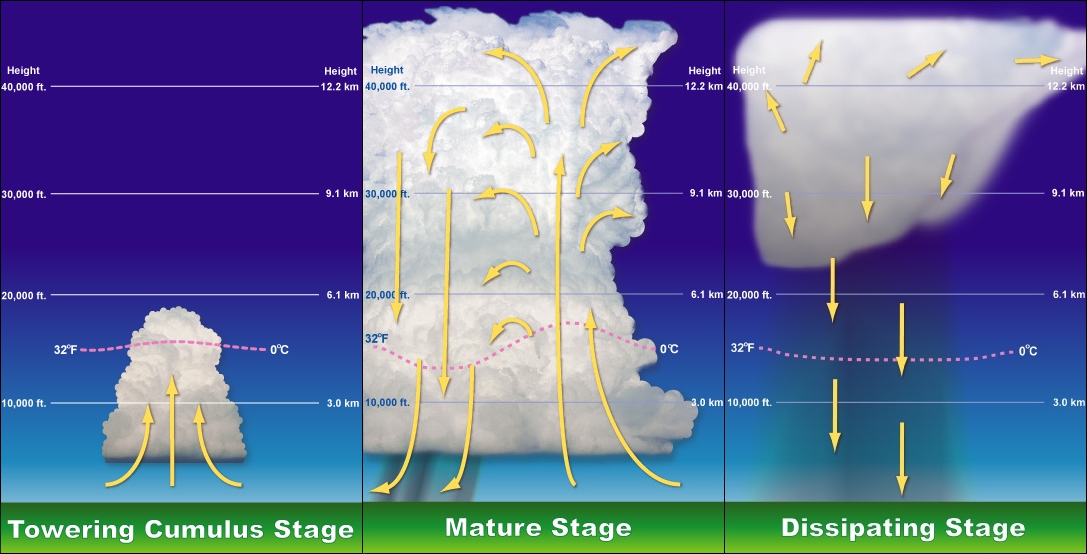
Stages in the formation of a thunderstorm. Left: Warm air rises. Moisture condenses out of the warm air as it comes into contact with cool air, forming clouds. Center: As warm air rises, cool air sinks. Precipitation forms. Right: As the vertical column of air turns over, with warm air at the top and cool air at the bottom, the storm begins to dissipate. Image by The High Fin Sperm Whale, created from images by NOAA National Weather Service training material (Wikimedia Commons, public domain).
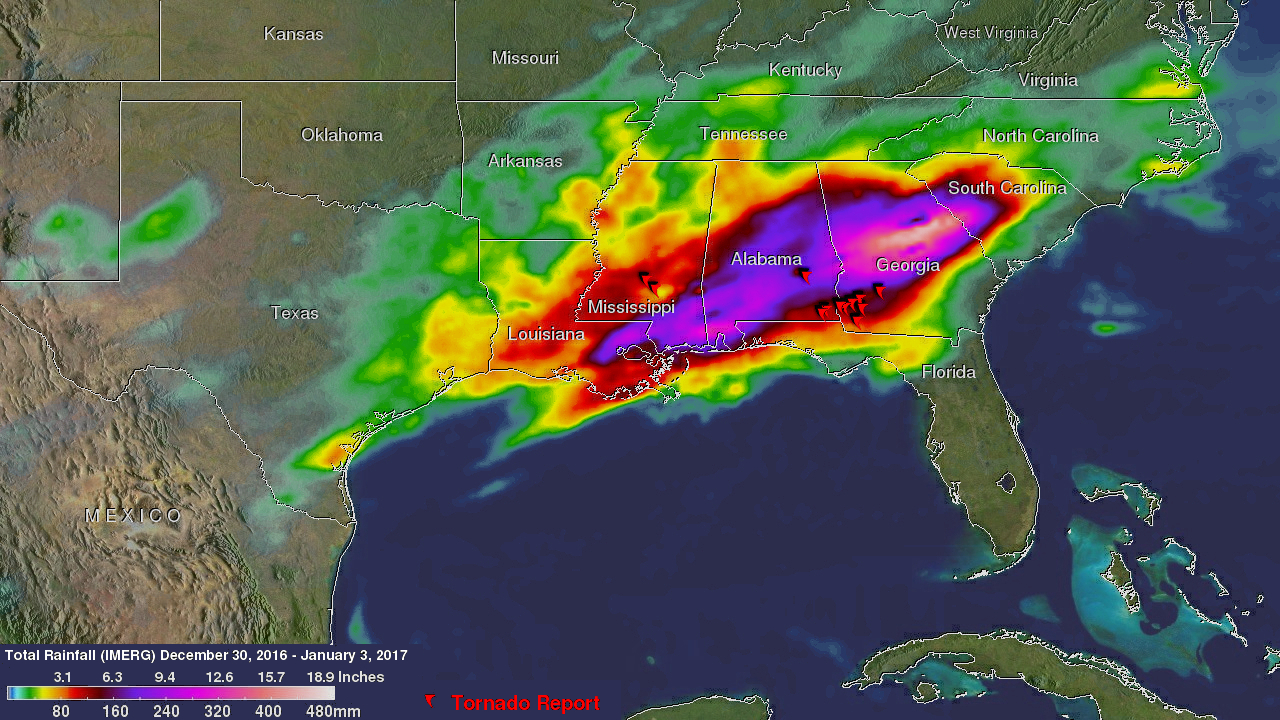
This map shows the results of a severe storm event that affected the Southeast from December 30, 2016 to January 3, 2017. During that time, over 30.5 centimeters (12 inches) of rain fell in the most severely affected areas (pink to nearly white on the map). Red flags mark tornados. Photo from NASA/JAXA, Hal Pierce.
Typically, a storm blows itself out once the warm air has moved up and the cool air has moved down. Convective mixing stops because the vertical column of air has turned over so that the cool air is at the bottom and the warm air is at the top. The directions of air currents in the Southeast, however, promote mixing. The Southeast receives warm, moist air from the Gulf of Mexico, and cold, dry air from the Rocky Mountains and the northern US. The warmer, lower air from the Gulf is moving north, constantly adding more heat and moisture. The colder, higher air is moving west. Where these air masses meet, vigorous mixing causes storms. The inputs of warm, dry air from the Gulf of Mexico allow these storms to persist and strengthen.
This movement in different directions is also the reason for the Southeast's unusually high incidence of powerful tornados. Only Kansas has more tornados per square mile than Florida, and several other southeastern states rank in the top ten for tornado frequency. Tornados often accompany severe thunderstorms, so where thunderstorms occur, tornados are likely.
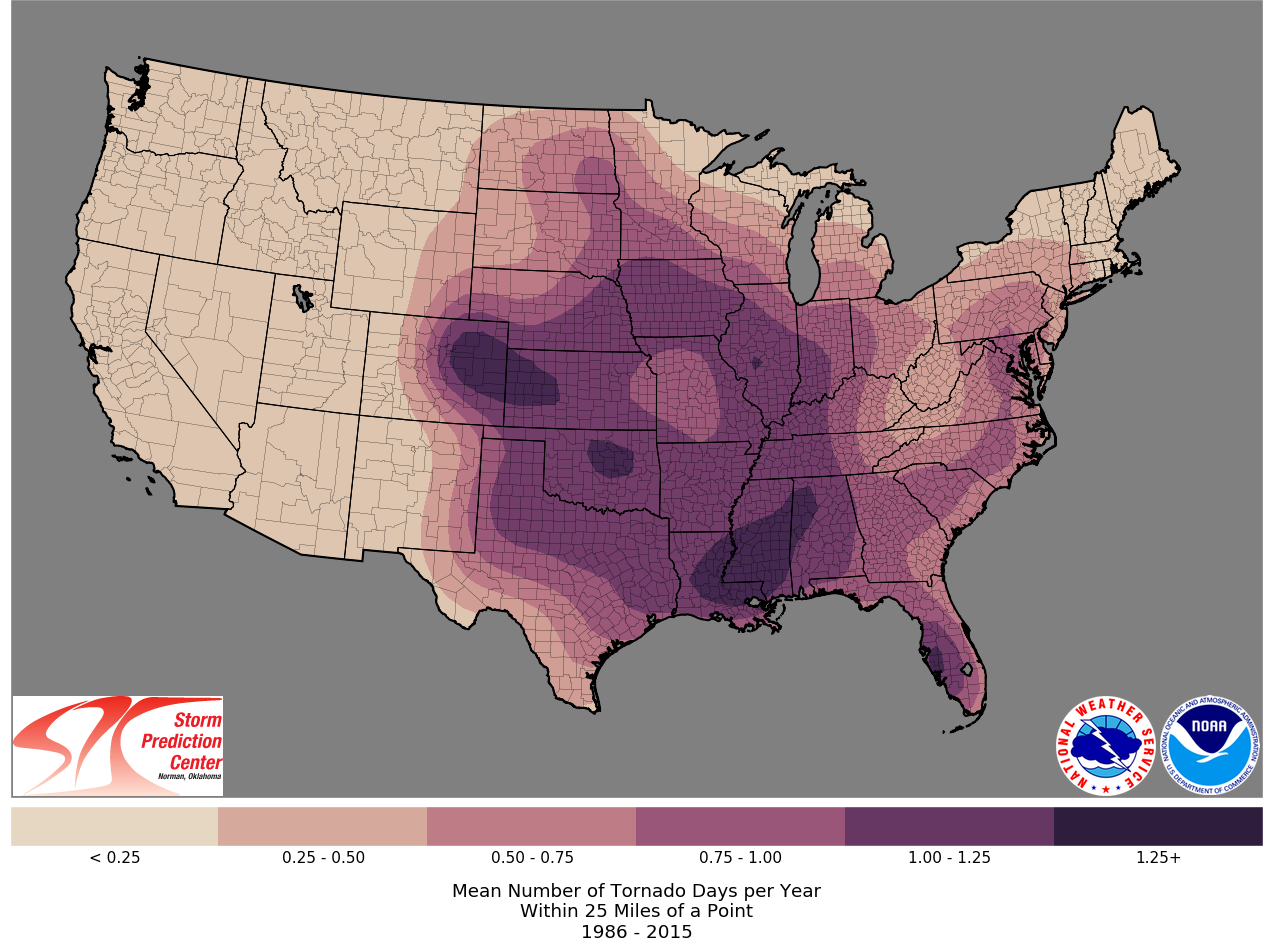
Mean (average) number of tornado days per year from 1986 to 2015. Areas with darker shading experience more tornados. Source: NOAA's National Weather Service Storm Prediction Center.
Regional climate variation
In much of the lower Southeast, the climate is typical of a humid subtropical zone, characterized by temperate winters, long, hot summers, and rainfall that is fairly evenly distributed through the year. This blanket classification is somewhat misleading however, masking the variation in climate and weather that occur throughout the Southeast.
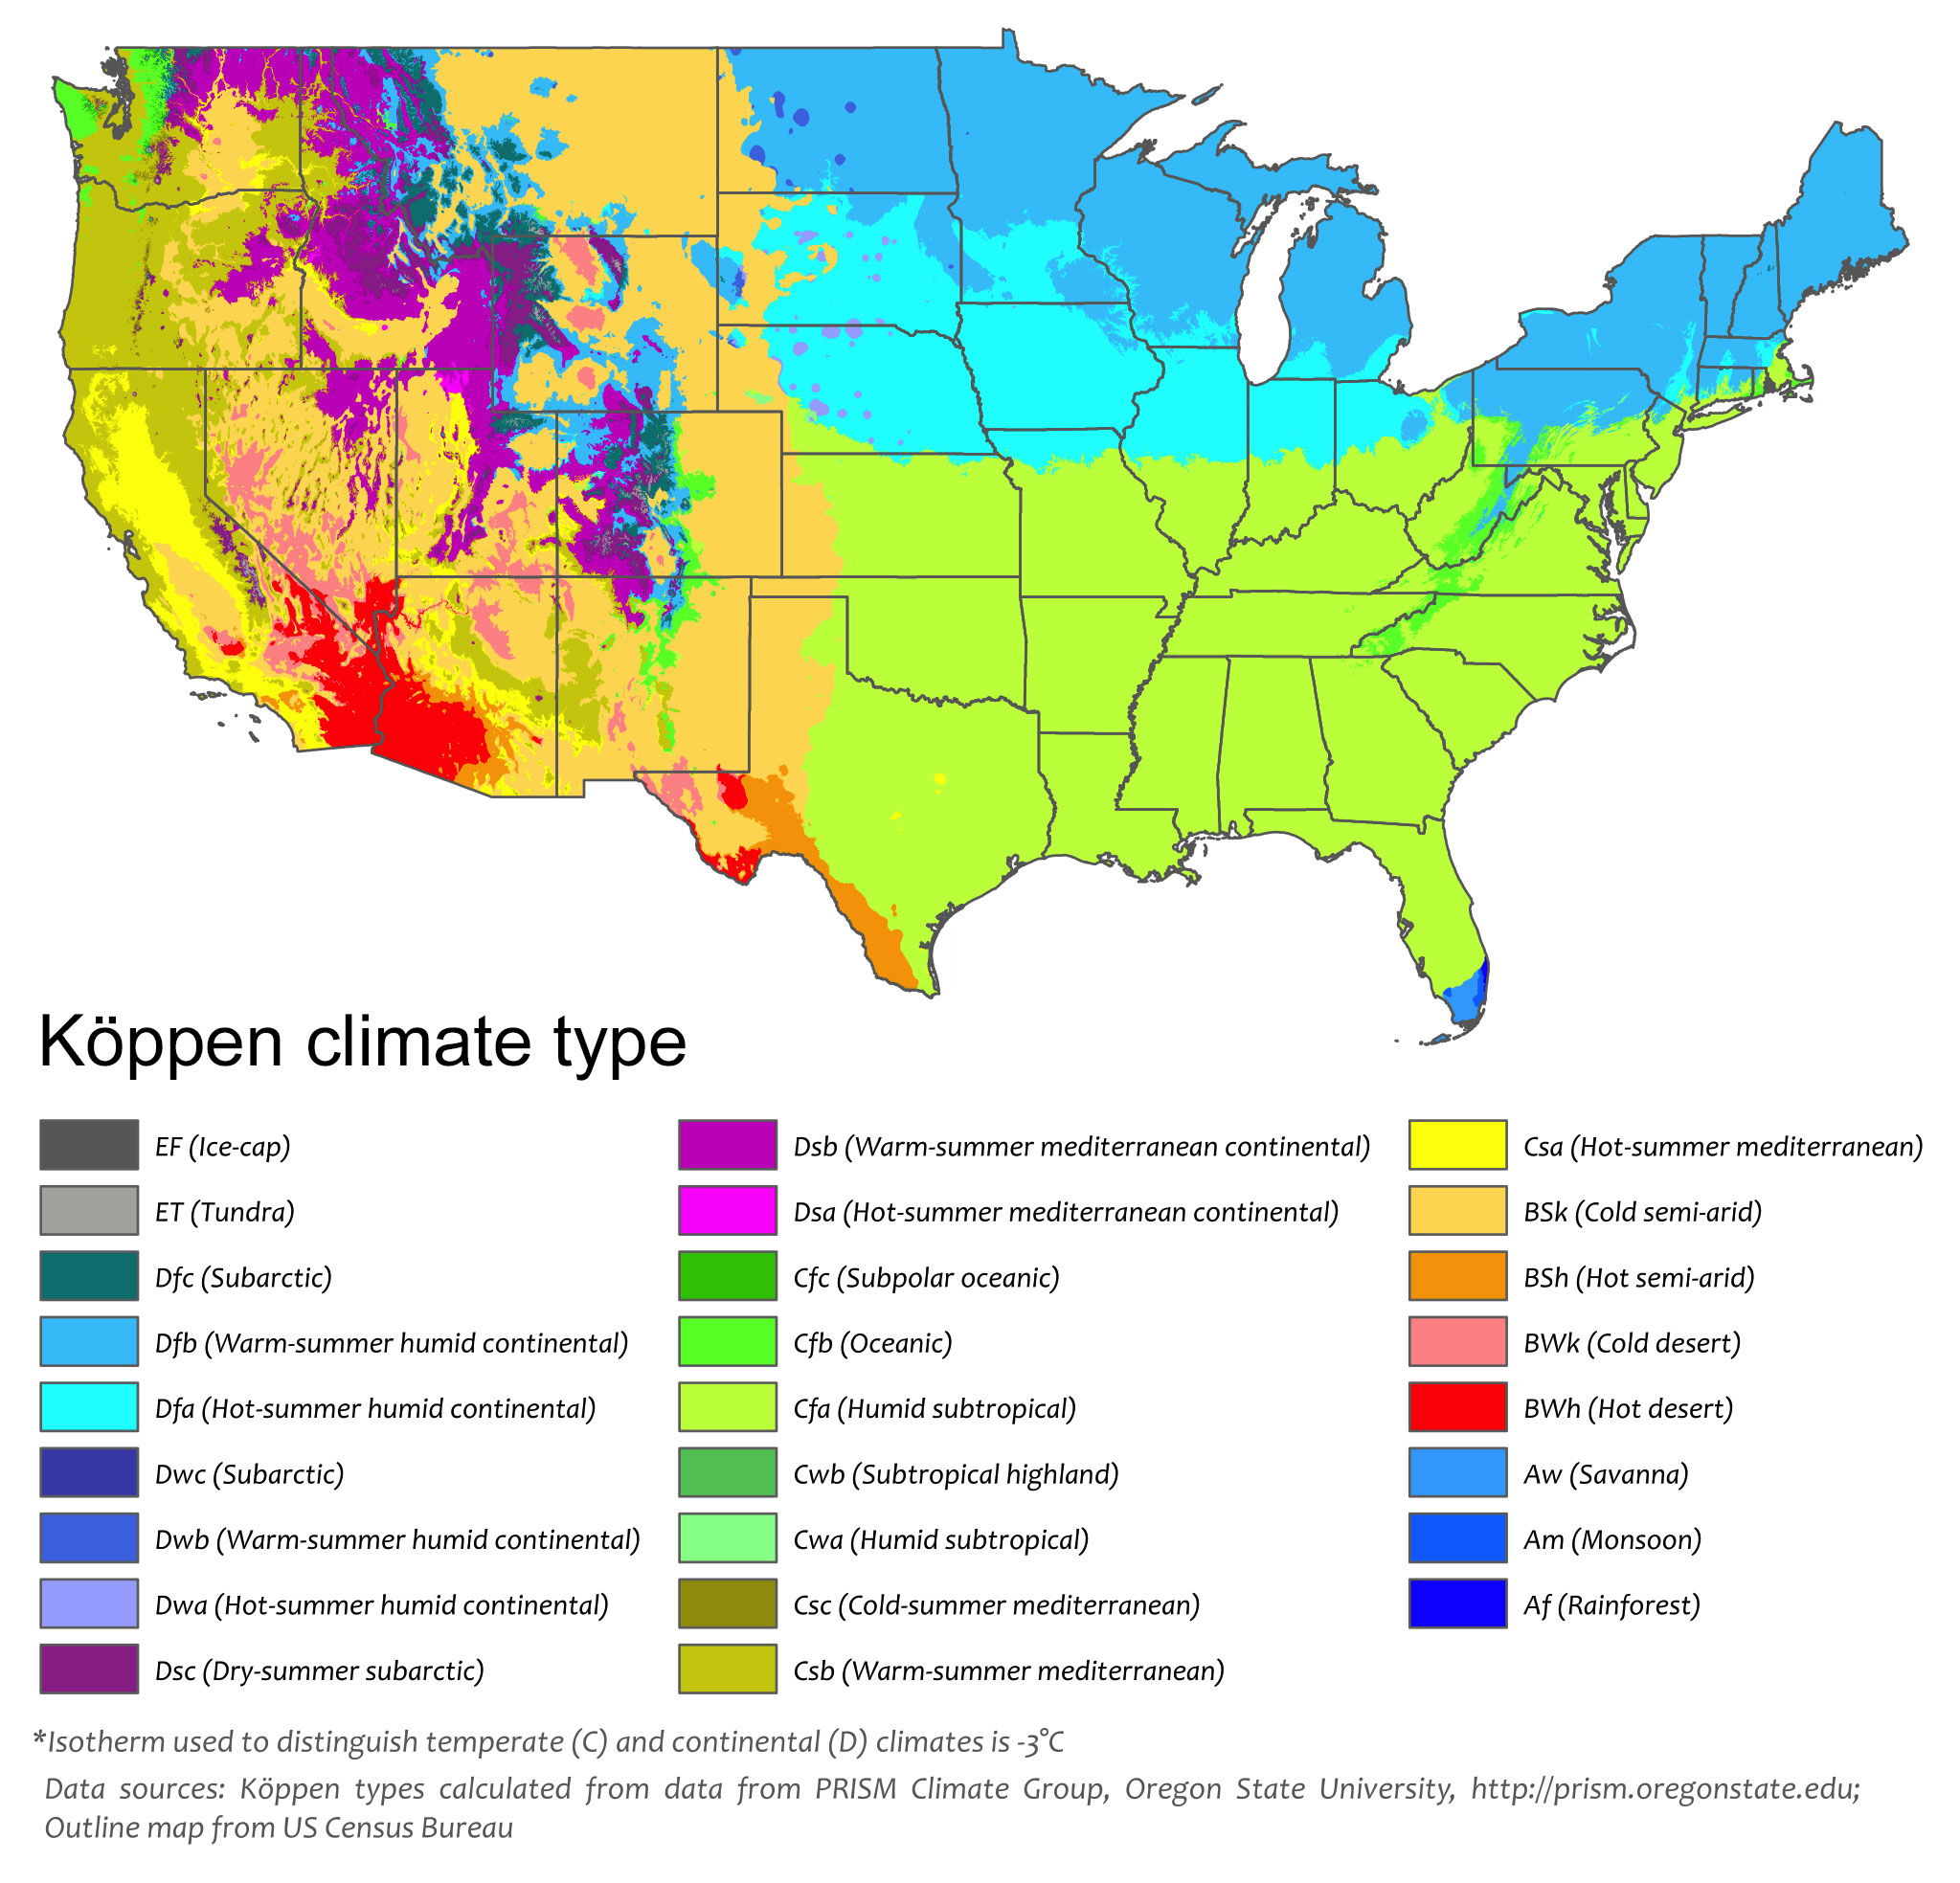
Köppen climate map of the 48 contiguous states of the continental United States. The first letter of each zone in the key indicates its major classification. A = Tropical (equatorial), B = Arid, C = Temperate (warm temperate), D = Continental (cold), E = polar. Modified from a map by Adam Peterson (Wikimedia Commons, Creative Commons Attribution-ShareAlike 4.0 International license).
Alabama, Georgia, and Mississippi
In Georgia, elevations range from sea level at the Atlantic coast to the summit of Brasstown Bald at 1458 meters (4784 feet). The climate varies considerably, but snow and prolonged freezing temperatures are uncommon throughout the state. In Mississippi and Alabama, thunderstorms occur throughout the year; they are most commonly in the summer, but most destructive in the fall and spring. These states are also commonly in the path of tropical storms and hurricanes moving northward off of the Gulf. Freezing temperatures reach to the Gulf Coast in most winters, but they rarely persist.
Florida
Florida is commonly in the path of hurricanes and tropical storms that move across the Mid-Atlantic and the Gulf of Mexico. The climate of the state's north and central parts is humid subtropical, while southern Florida has a tropical savanna climate. There is a defined rainy season from May through October, when thunderstorms built in the heat of day drop heavy but brief summer rainfall.
Kentucky
Kentucky experiences four distinct seasons, with substantial variations in the severity of summer and winter, but extreme cold is rare. Precipitation does not vary greatly throughout the year. Fall is normally the state's driest season, while the spring season is typically the wettest. Thunderstorms are responsible for much of Kentucky's summer rainfall, and they often bring intense rain that may be highly localized. Generally, Kentucky experiences relatively humid, rainy, and warm summers; winters are moderately cold and snow is not especially uncommon, although occasional extreme snowfalls occur. Snow cover seldom persists for more than a week in the south or for more than two weeks in the north.
North Carolina
In North Carolina, the climate varies from the Atlantic coast in the east to the Appalachian Mountains in the west. The Appalachians help to block cold air from the interior of the United States and storms from the Midwest from entering the Piedmont of North Carolina. Most of the state has a humid subtropical climate, except in the higher elevations of the Appalachian Mountains, which have a subtropical highland climate.
South Carolina
South Carolina's humid subtropical climate arises from the combination of the state's relatively low latitude, its generally low elevation, the proximity of the warm Gulf Stream, and the Appalachian Mountains, which in winter help to block cold air from the interior of the United States. Most precipitation falls in spring and summer. While cold weather occurs each winter, its duration tends to be brief; snow is uncommon and generally occurs only in the mountains and upper Piedmont.
Tennessee
Tennessee has a temperate climate, with warm summers and mild winters, although the state's varied topography leads to a wide range of climatic conditions. Most of the state has a humid subtropical climate, with the exception of some of the higher elevations in the Appalachian Mountains; these high-elevation regions are classified as having a mountain temperate climate or a humid continental climate. Severe storms occur infrequently. The state has hot summers and mild to cool winters with generous precipitation throughout the year. The highest average monthly precipitation generally occurs in the winter and spring months, between December and April. Snowfall varies and is more prevalent in eastern Tennessee than in the western section. Nashville gets about 25 centimeters (10 inches) a year, Memphis only 13 centimeters (5 inches).
Virginia
The climate of Virginia is considered mild for the United States. The southern part of the Shenandoah Valley, the Roanoke Valley, and most of Virginia east of the Blue Ridge Mountains have a humid subtropical climate, although the range of topography yields a range of climate types. Some locations, like Charlottesville, have long growing seasons and infrequent subzero temperature minimums. In contrast, winters on the northern Blue Ridge frequently produce bitterly cold temperatures like those of Chicago. Similarly, annual rainfall totals can vary from a fairly dry 84 centimeters (33 inches) typical of the Shenandoah Valley to more than 150 centimeters (60 inches) in the mountains of southwestern Virginia. Severe weather, in the form of tornados, tropical storms, and winter storms, impacts the state on a regular basis. Areas of Virginia have seen substantial snowstorms in recent years.
West Virginia
West Virginia has the lowest annual average temperature in the Southeast, reflecting its inland position and higher latitude, as well as the mountainous topography in the eastern part of the state. The lowest-elevation regions of West Virginia have a humid subtropical climate, whereas the highest elevations have a humid continental climate. As in Virginia, annual rainfall is variable. Parts of the eastern panhandle are fairly dry, which about 89 cm (35 inches) of precipitation per year. The mountains, in contrast, receive much more precipitation, including an average of over 254 centimeters (100 inches) of snow each year.
Past climate of the southeastern U.S.
This section covers the climate of the southeastern U.S. through the Phanerozoic, from about 541 million years ago to the recent. For the climate on early Earth, see the Intro to Climate section.
Paleozoic (541 to 252 million years ago)
Cambrian to Devonian (541 to 359 million years ago)
With the start of the Paleozoic era, climates across the world were warm, and North America was located in the low and warmer latitudes of the Southern Hemisphere. As the Cambrian progressed, North America moved northward; by about 480 million years ago, what would become much of the southeastern U.S. was located near the Tropic of Capricorn.
Fossils of archaeocyathids, trilobites, brachiopods, and mollusks reveal that most of the area was probably covered by warm, shallow seas from the Cambrian into the Ordovician. In the late Ordovician (about 460 to 430 million years ago), the Earth fell into a brief but intense ice age. Although sea level dropped during this event, North America's position near the equator kept its climate relatively warm.
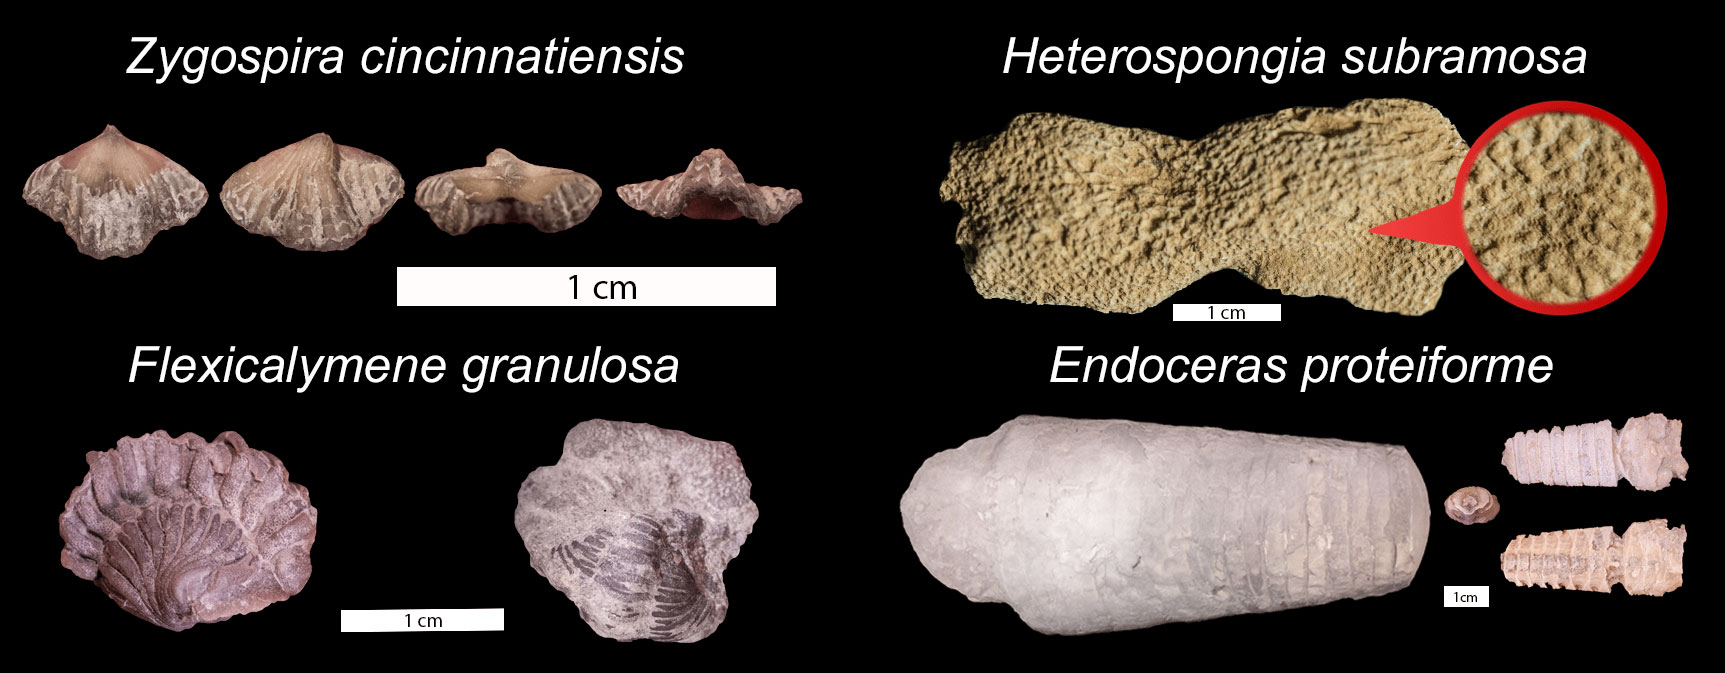
Ordovician fossils from Kentucky. Top left: A brachiopod (Zygospira cincinnatiensis), Eden Formation, in four views. Top right: A sponge (Heterospongia subramosa), Richmond Formation. Bottom left: A trilobite (Flexicalymene granulosa), Kope Formation. Bottom right: A cephalopod (Endoceras proteiforme), Kenton Formation. All images from the Atlas of Ordovician Life.
Limestones throughout Tennessee and Kentucky contain Silurian and Devonian fossils like trilobites, brachiopods, corals, and crinoids. These fossils indicate that the Southeast still contained warm, shallow seas through the late Devonian. These shallow seas were especially productive. In fact, plankton productivity grew so high that it depleted all the oxygen from the seafloor and sediments. The lack of oxygen allowed organic matter to accumulate instead of decay, leading to the deposition of black, carbon-rich shale. This shale occurs throughout the subsurface in east-central Kentucky and central West Virginia and is one of the richest sources of petroleum in those states.
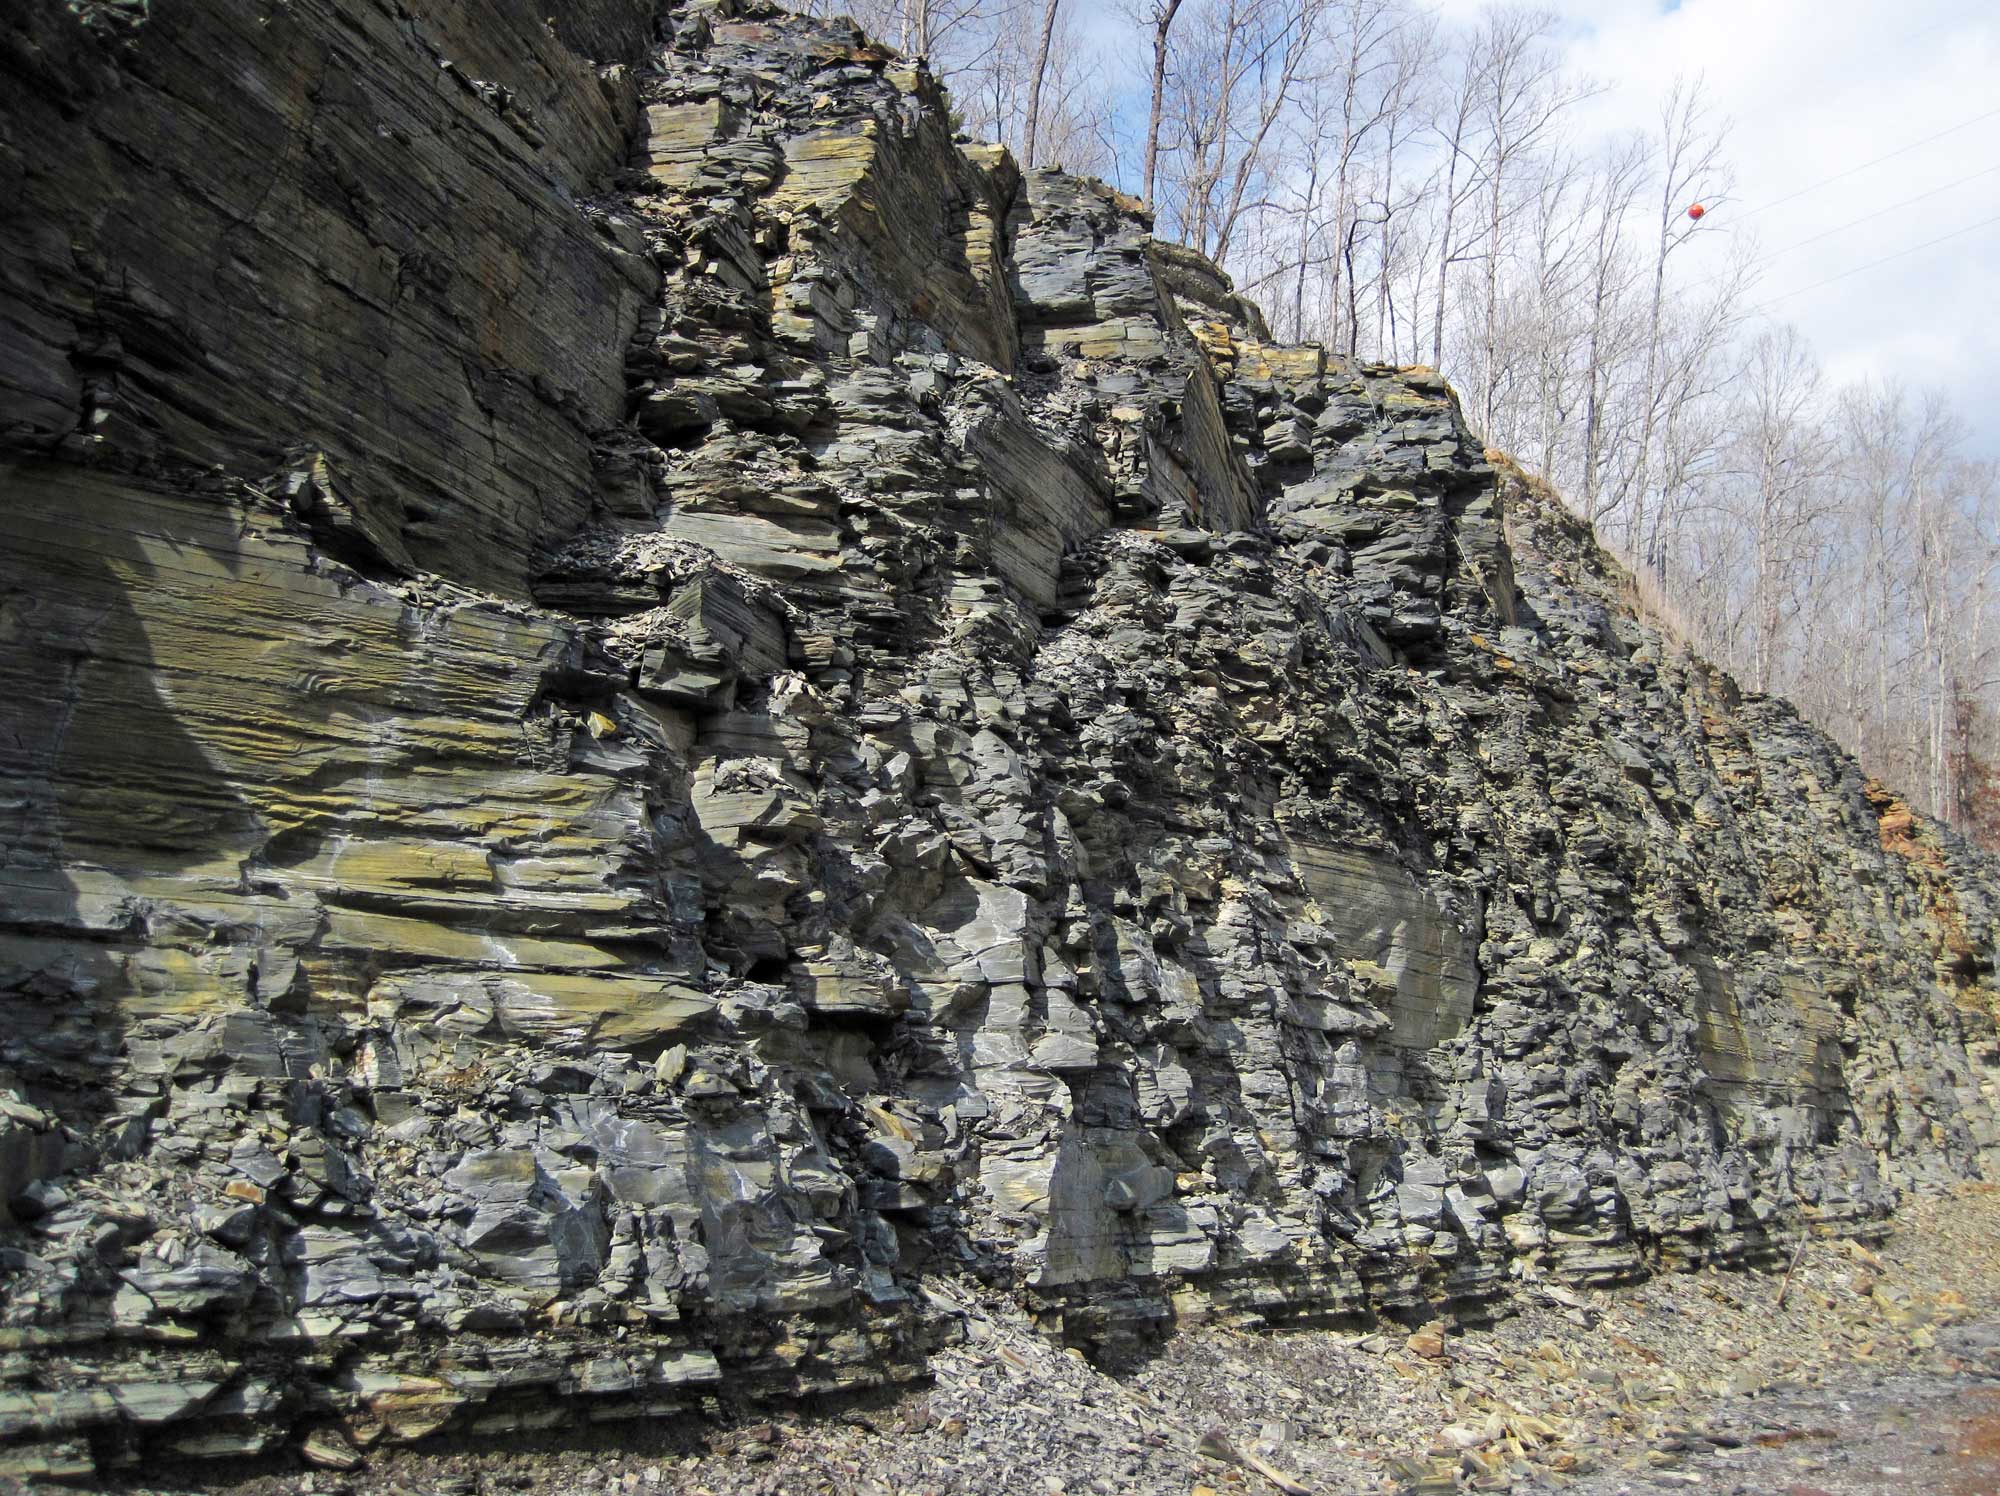
Chattanooga Shale, late Devonian, Kentucky. Photo and caption by James St. John (flickr, Creative Commons Attribution 2.0 Generic license, image resized and cropped).
From 430 to 345 million years ago, North America moved north across the equator, and the cycle of warming and cooling was repeated yet again. During this time time, most of the southeastern states were still submerged. As fragments of the Avalon microcontinent collided with North America, the Acadian Orogeny formed a huge chain of mountains in what is now eastern North America. The remains of these high mountains include the northern Appalachians and the igneous and metamorphic rocks of the Piedmont. As these mountains rose, they blocked the equatorial easterly winds, forming a large rain shadow.
Carboniferous to Permian (359 to 252 million years ago)
In the early Carboniferous (Mississippian), ice capped the South Pole and began to expand northward. Although the Earth's temperature fell during this time and glaciers growing far to the south caused sea levels to drop, the western Southeast was covered by a warm, shallow sea. Limestone accumulated in this sea and it supported abundant marine life, including heavily armored bony fish, sharks, bryozoans, corals, and echinoderms.
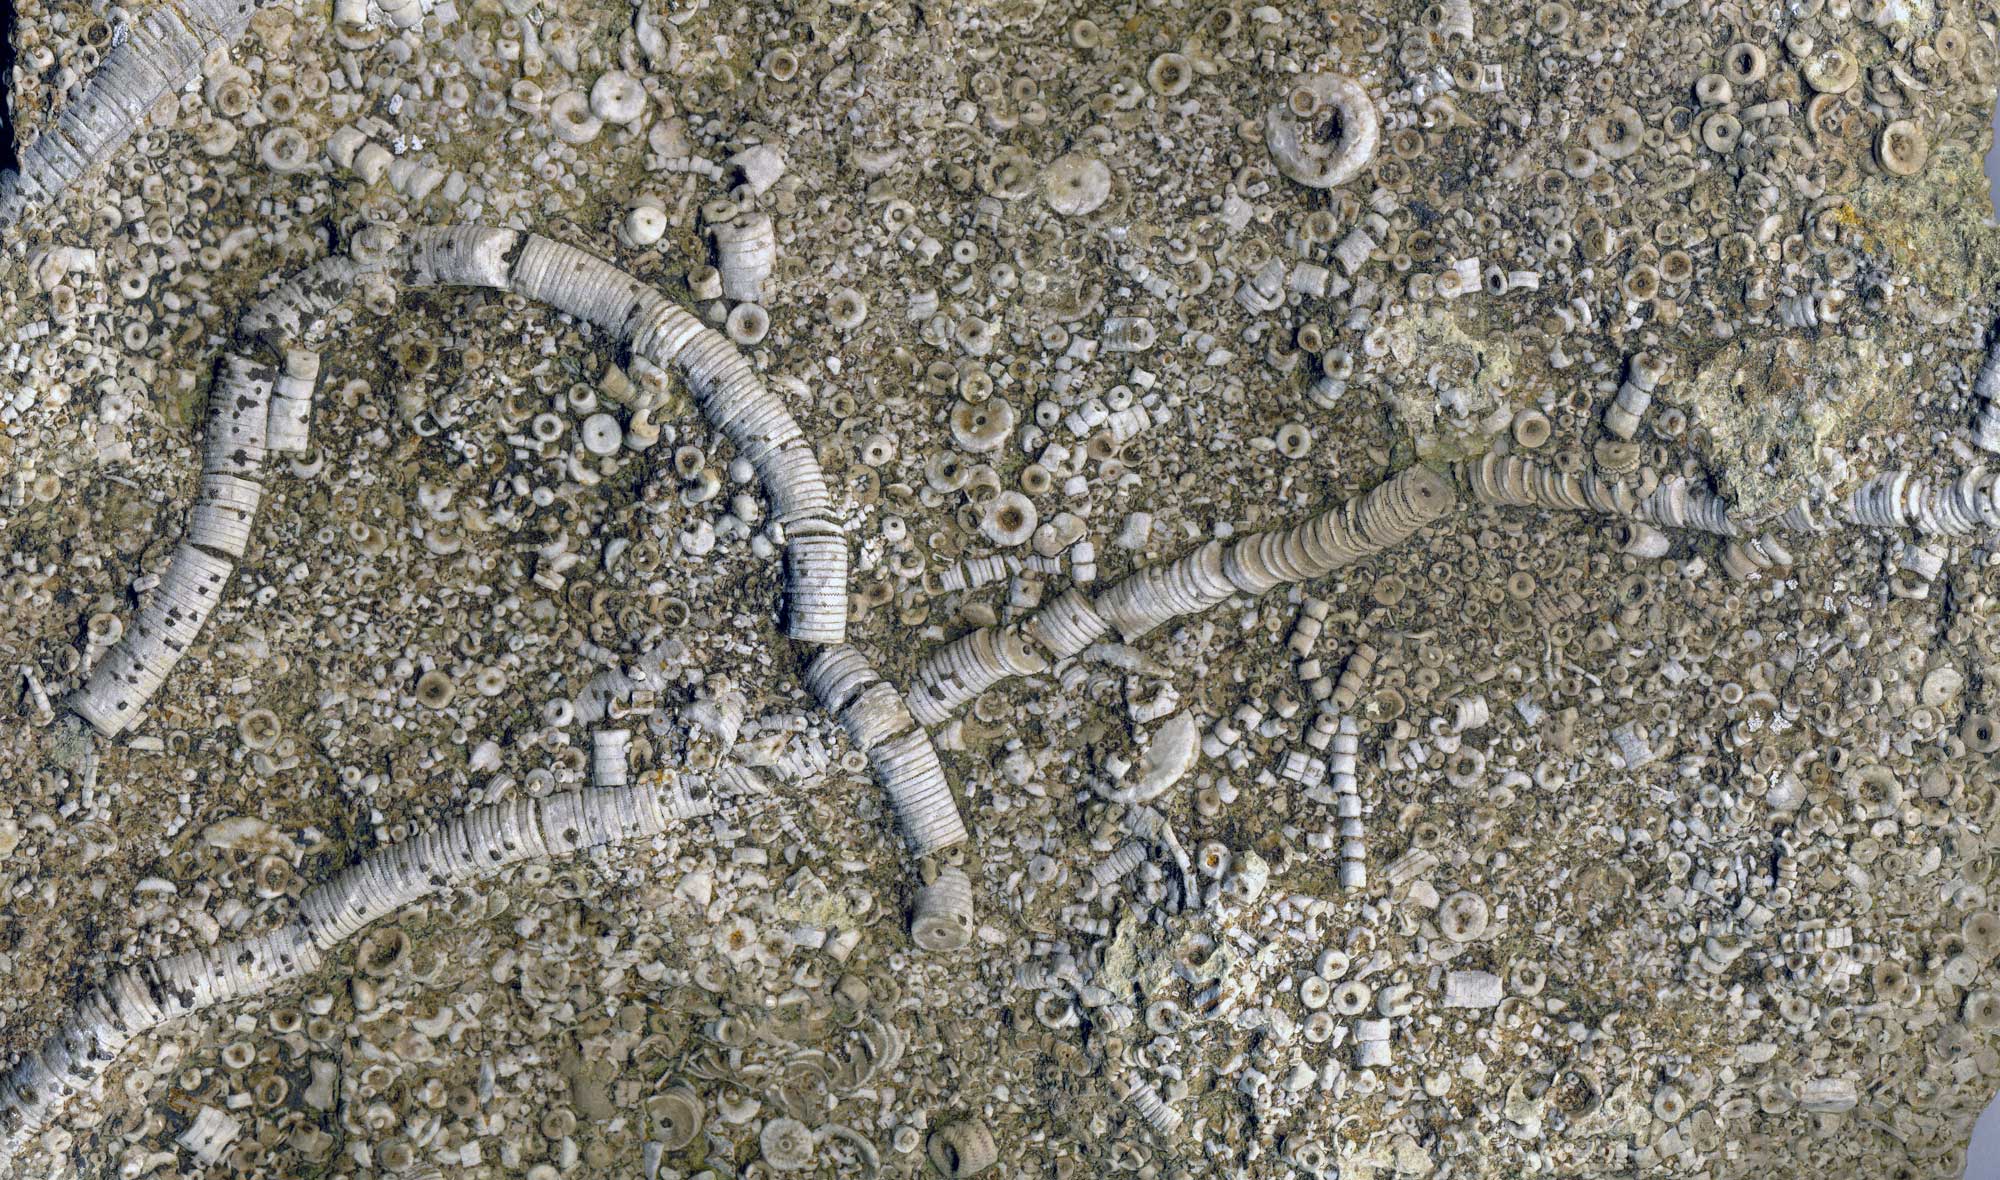
Crinoid stems and stem segments preserved in limestone from the lower Mississippian Fort Payne Formation, Lake Cumberland, south-central Kentucky. Width of image is about 23 cm (9.1 in). Information from and photo by James St. John (flickr, Creative Commons Attribution 2.0 Generic license, image resized).
Farther east, the uplift and erosion associated with mountain building caused the landscape to transition to a swampy coastal environment. The extensive forests contained many different kinds of plants including lycophytes, sphenopsids (plants related to modern horsetails), tree ferns, and seed ferns (seed plants with fern-like leaves) as well as insects, amphibians, and early reptiles.
By the late Carboniferous (Pennsylvanian), North America had collided with Gondwana, advancing the formation of Pangaea. Pangaea was so large that it created a strong monsoonal climate, much as Asia has today. A monsoonal climate is a warm climate with wet and dry seasons. The monsoonal climate counteracted the effect to the rain shadow produced by the Central Pangaean Mountains (in North America, the Appalachian and Ouachita mountains) by bringing in moisture from the west.
Although global temperatures again declined as glaciers formed near the South Pole, temperatures in present-day eastern and southeastern North America remained warm. Late Carboniferous fossils from the Inland Basin provide evidence of a warm climate with scale trees and other swamp plants. The large coal swamp forests that eventually formed the rich coal beds of Tennessee, Kentucky, and West Virginia grew along broad floodplains.
The region experienced the repeated rising and falling of sea levels as the glaciers waxed and waned. This ice age lasted well into the Permian, ending about 260 million years ago, during which time the swamps dried out permanently.
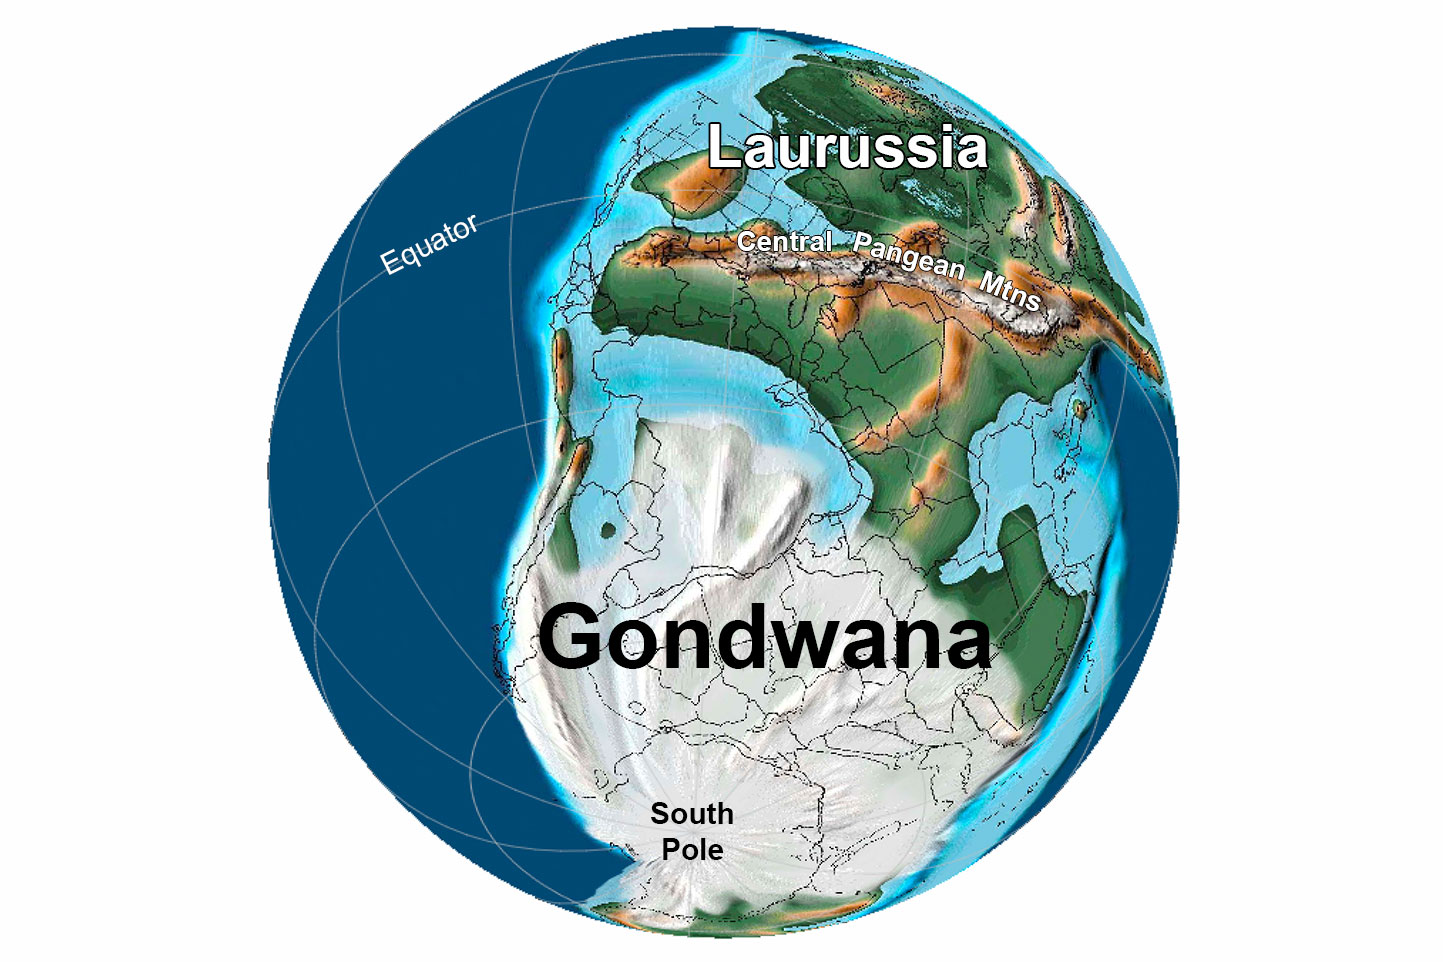
Earth 300 million years ago, during the end of the Carboniferous Period (Pennsylvanian). Pangaea was completed when North America finally collided with Gondwana. Reconstruction created using basemap from the PALEOMAP PaleoAtlas for GPlates and the PaleoData Plotter Program, PALEOMAP Project by C. R. Scotese (2016); map annotations by Jonathan R. Hendricks & Elizabeth J. Hermsen for PRI's Earth@Home project (CC BY-NC-SA 4.0 license).
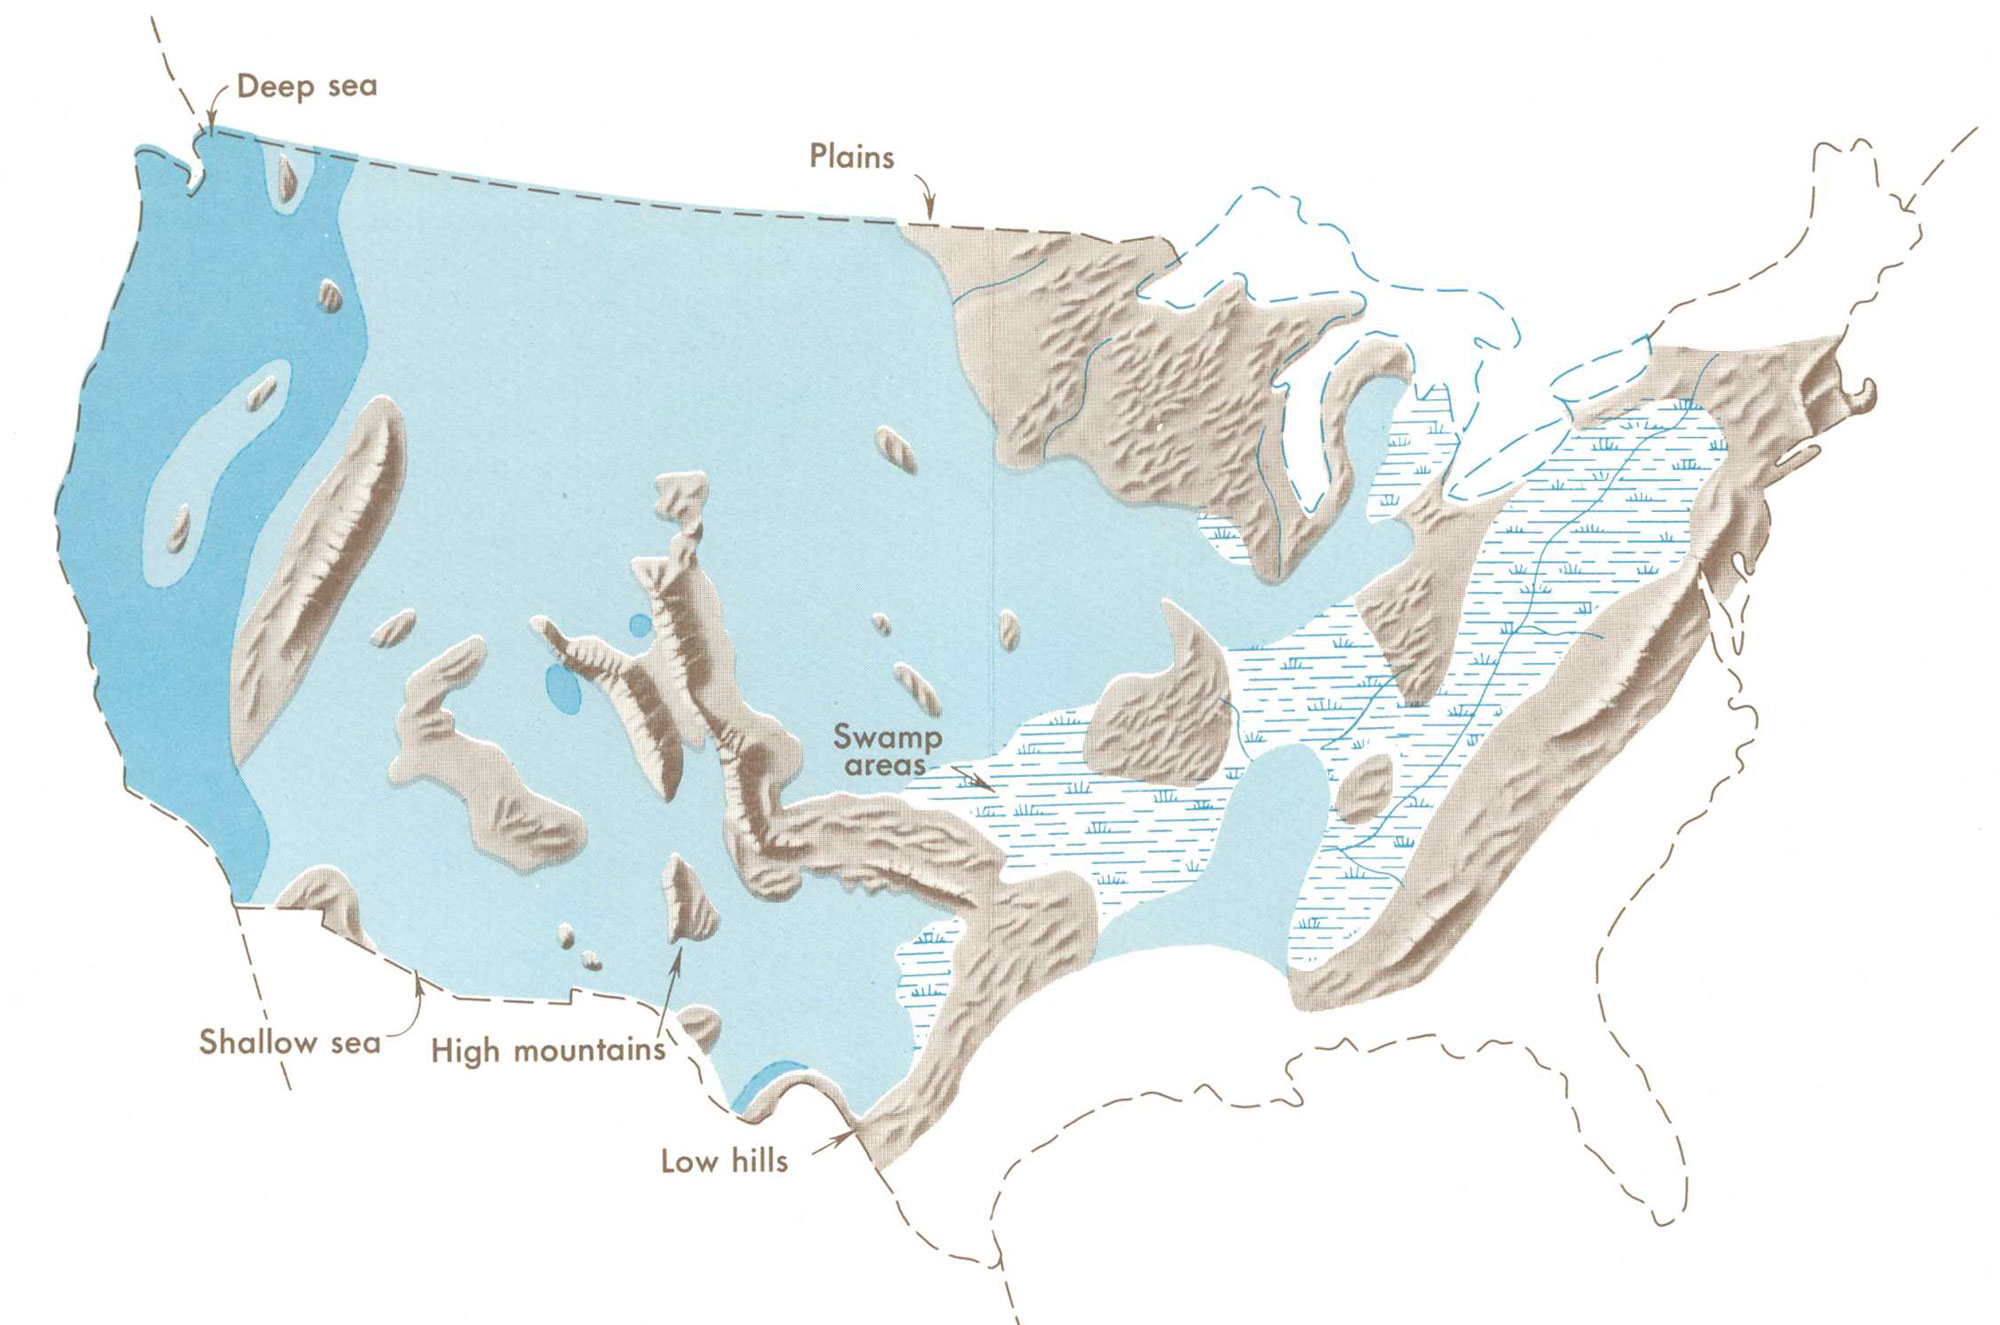
Distribution of Pennsylvanian swamps and highland areas relative to the outline of the modern United States. Map from Our changing continent, USGS Monograph, published 1969.
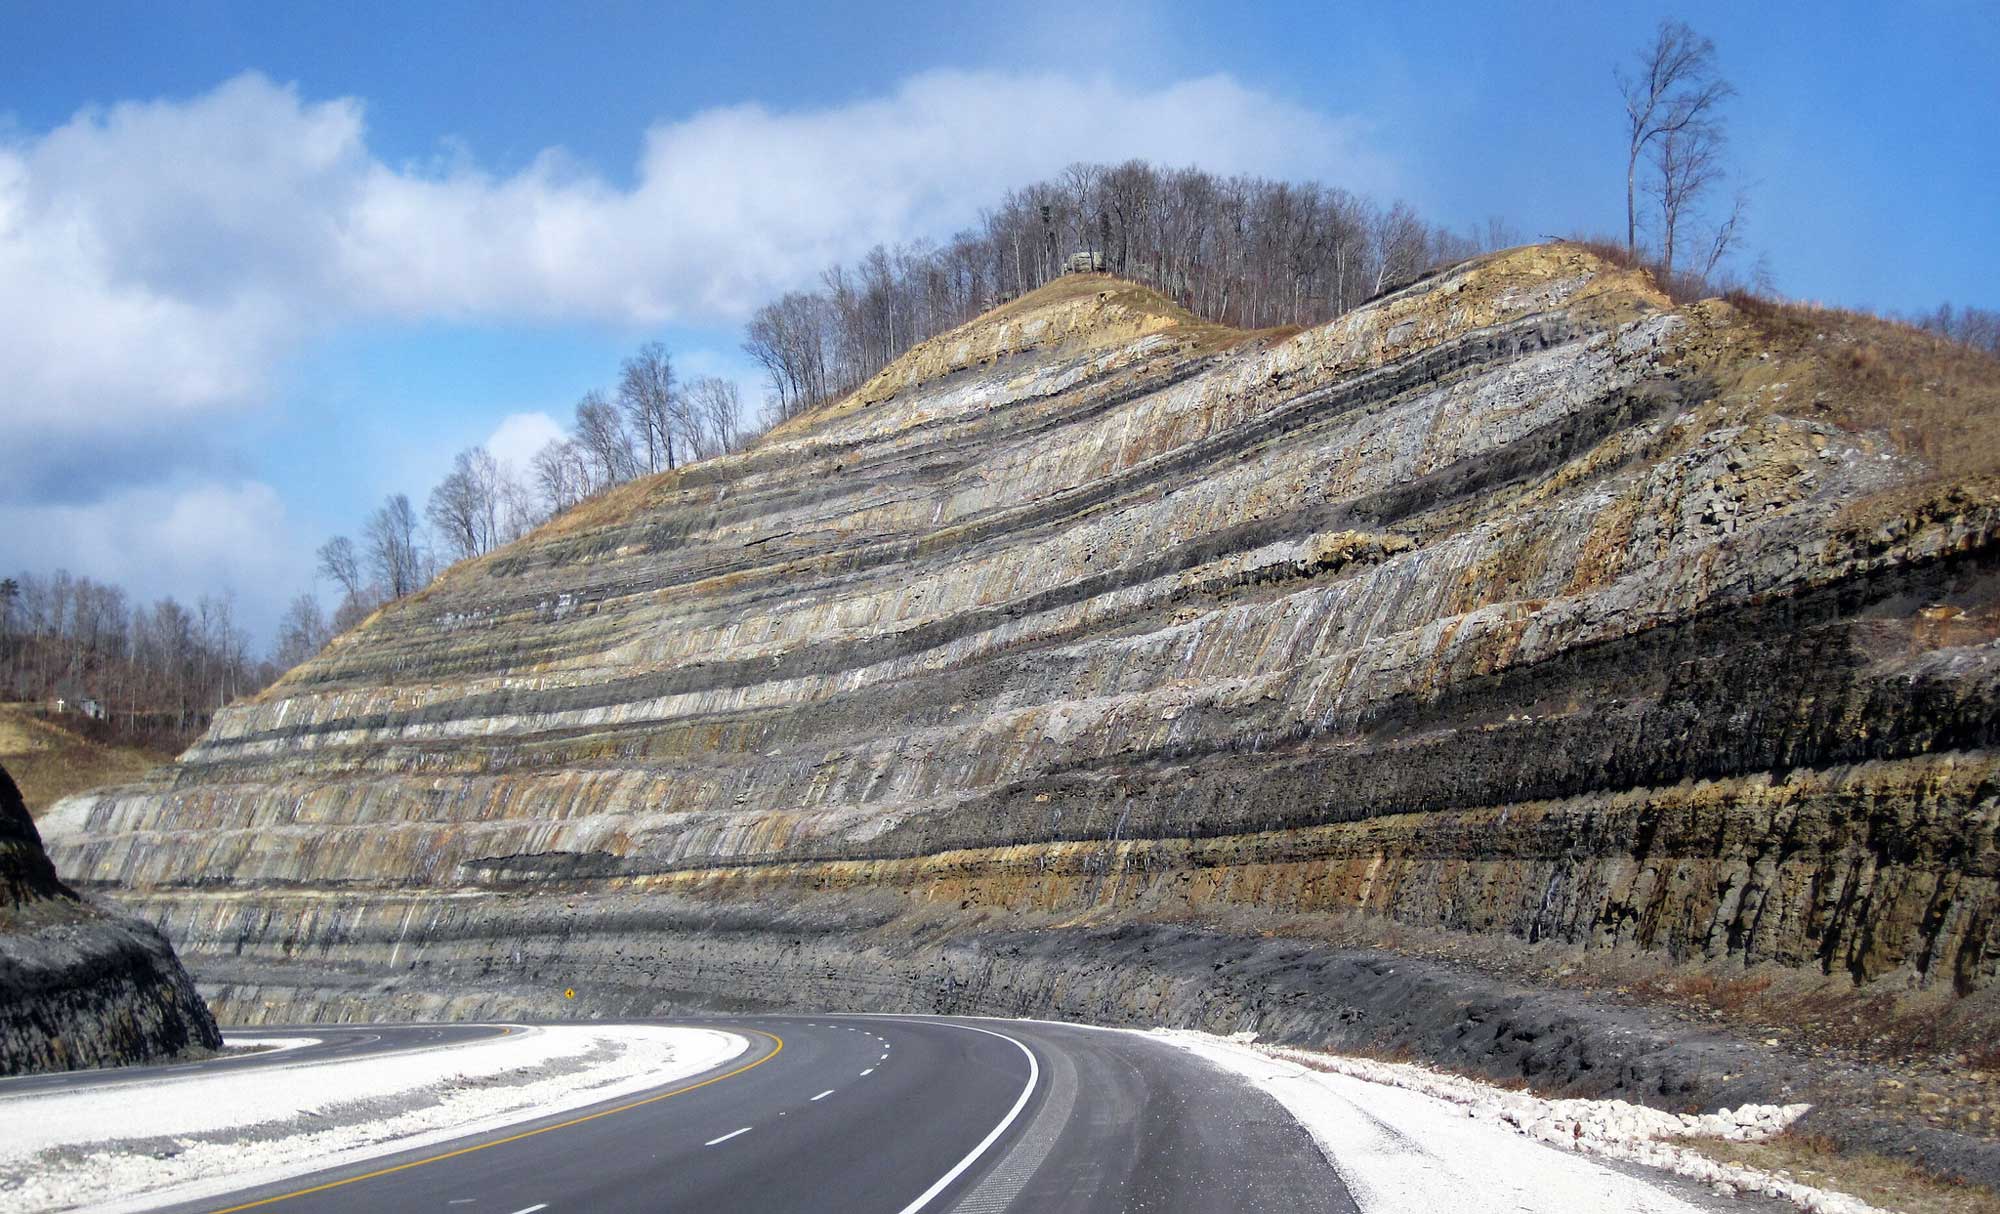
Roadcut in Kentucky showing alternating layers of Pennsylvanian-aged sedimentary rock. The dark layers are coal beds. Photograph by James St. John (Flickr; Creative Commons Attribution 2.0 Generic license).
Mesozoic (252 to 66 million years ago)
Triassic to Jurassic (252 to 145 million years ago)
The Earth remained warm and ice-free at the poles through much of the Mesozoic era. After reaching its greatest size during the Triassic period, Pangaea began to rift apart, and the climate gradually shifted, becoming wetter and warmer. As the Triassic period began, the Southeast moved north from the equator. Triassic rocks are known only from the rift basins of Virginia and North Carolina, where they contain a rich terrestrial and lake fauna of fishes, amphibians, dinosaurs, and other reptiles.
The breakup of Pangaea caused the Gulf of Mexico to open, flooding it with seawater. Because the climate was still relatively warm and dry, evaporation rates were high, and extremely thick deposits of salt accumulated there. These salt deposits have played a key role in trapping petroleum along the Gulf Coast.
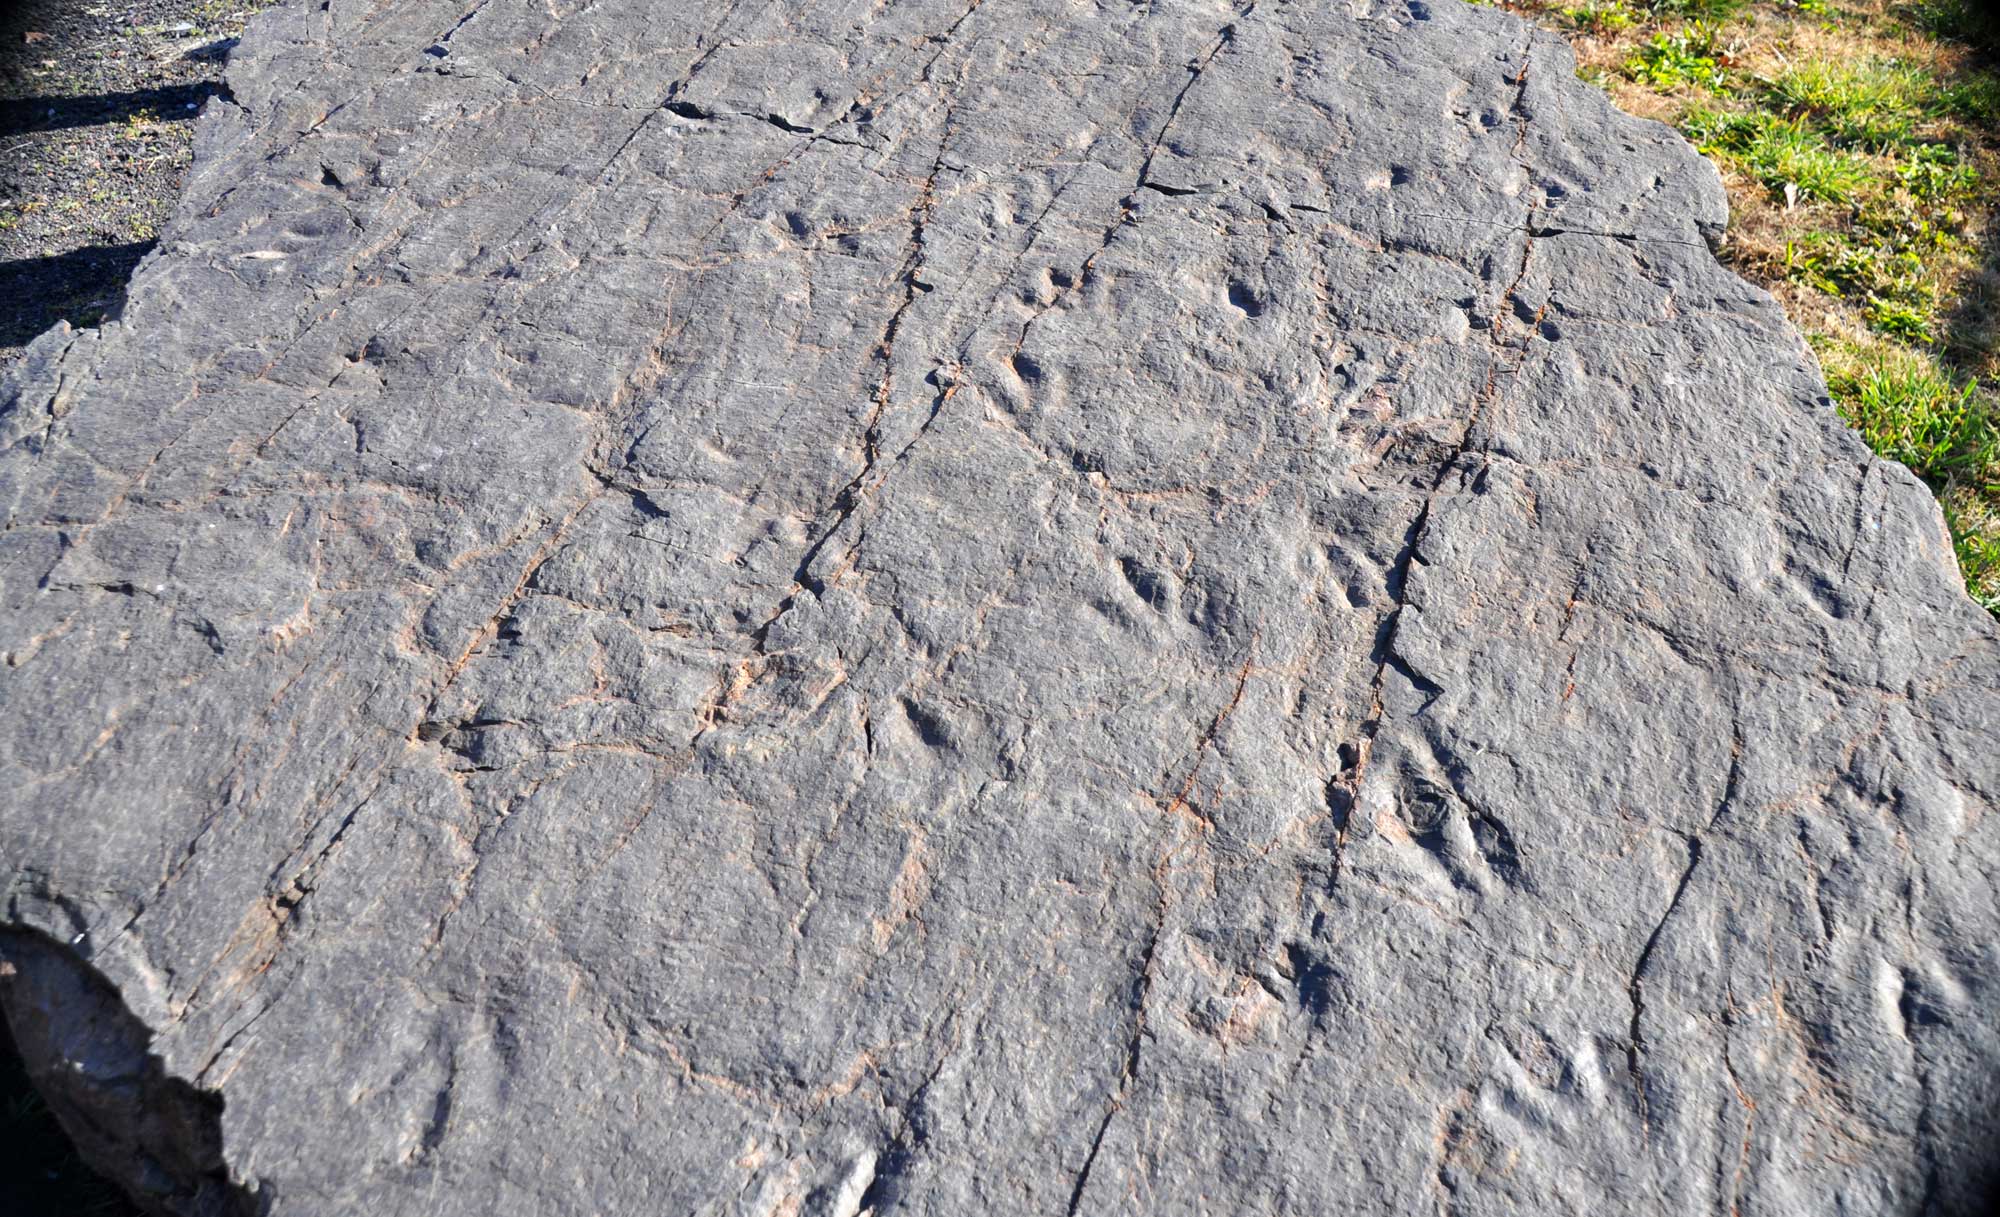
Dinosaur trackway. This slab comes from the Cow Branch Formation and was collected from the Solite Quarry on the North Carolina-Virginia border. The tracks are Late Triassic in age and are assigned to the footprint genus Grallator, thought to be the footprints of a small theropod dinosaur like Coelophysus. Information from and photo by James St. John (flickr, Creative Commons Attribution 2.0 Generic license, image resized).
Cretaceous (145 to 66 million years ago)
Throughout the Cretaceous, sea level was as much as 100 meters (330 feet) higher than it is today. Shallow seaways spread over many of the continents. Global temperatures during the Cretaceous were very warm, as much as 10°C (18°F) above present. There was likely little or no glacial ice anywhere on Earth, and temperatures were highest in lower latitudes.
By the start of the Late Cretaceous, North America was divided in two by an inland sea known as the Western Interior Seaway, and the Southeast experienced a hot and humid tropical climate. A rich record of this warm, shallow sea is found in Mississippi, Alabama, and Georgia, where marine fossils range from tiny coccolithophores (a type of marine alga that makes up Cretaceous chalk deposits), mollusks, and crabs to sharks and large marine reptiles.
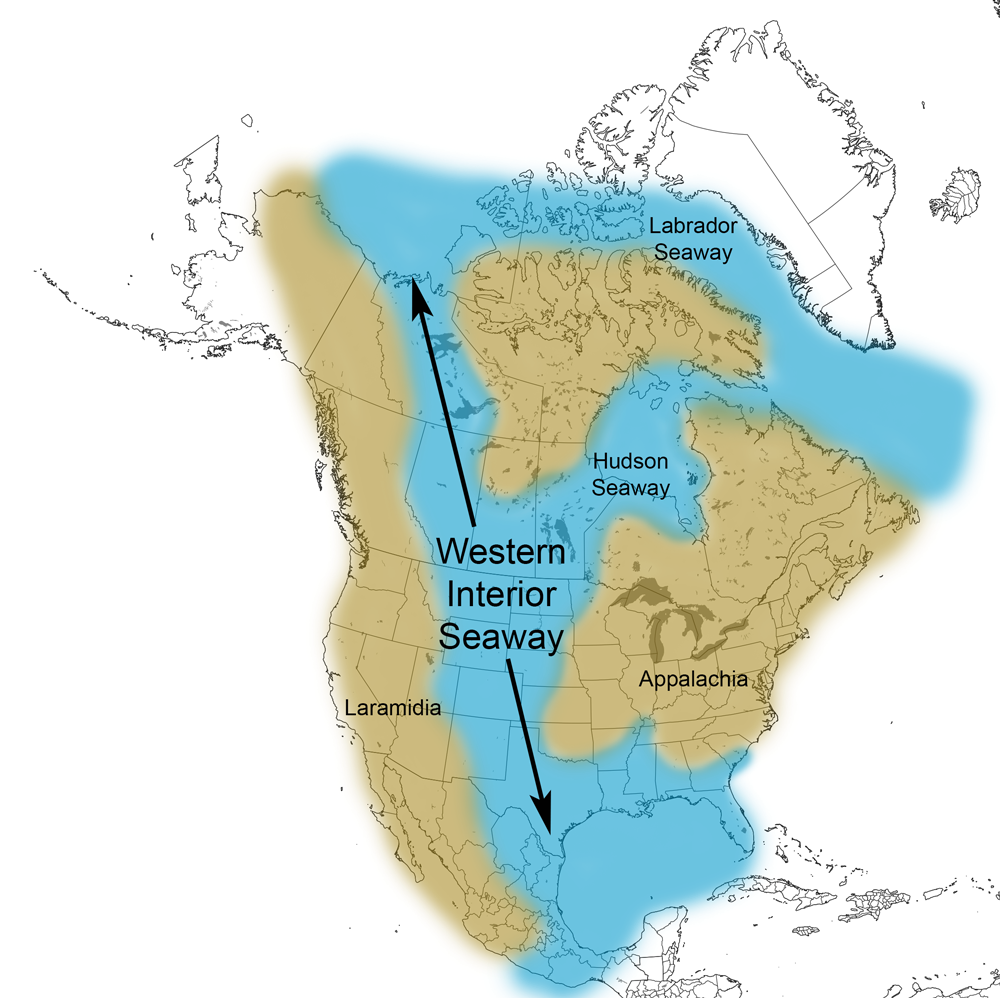
Extent of the Western Interior Seaway during the Cretaceous Period. Image from Cretaceous Atlas of Ancient Life: Western Interior Seaway (Creative Commons Attribution-NonCommercial-ShareAlike 4.0 International license).
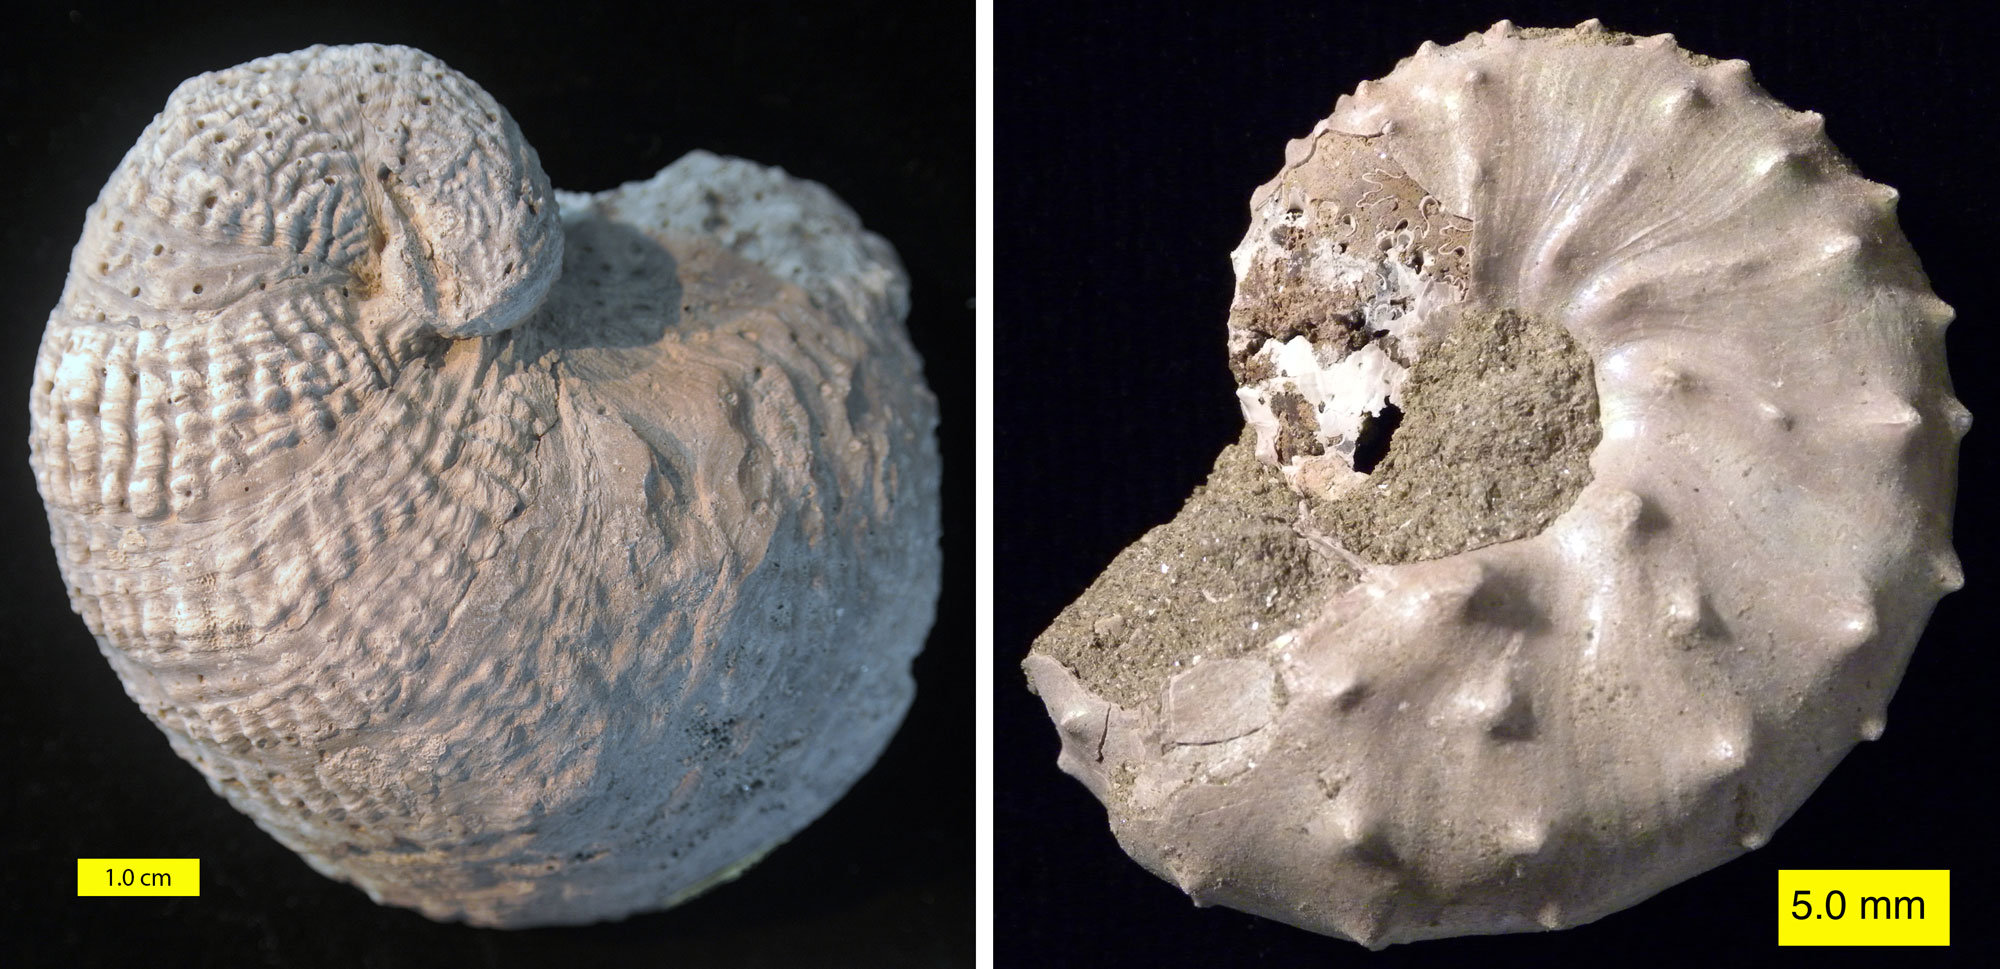
Marine invertebrate fossils from the Cretaceous of Mississippi. Left: A fossil oyster (Exogyra costata) from the Prairie Bluff Formation, Starkville, Mississippi. Photo by Mark A. Wilson (Wilson44691, Wikimedia Commons, CC0 1.0 Universal license/Public Domain Dedication). Right: An ammonite (Discoscaphites iris) from the Owl Creek Formation, Ripley, Mississippi. Photo by Mark A. Wilson (Wilson44691, Wikimedia Commons, Public Domain).
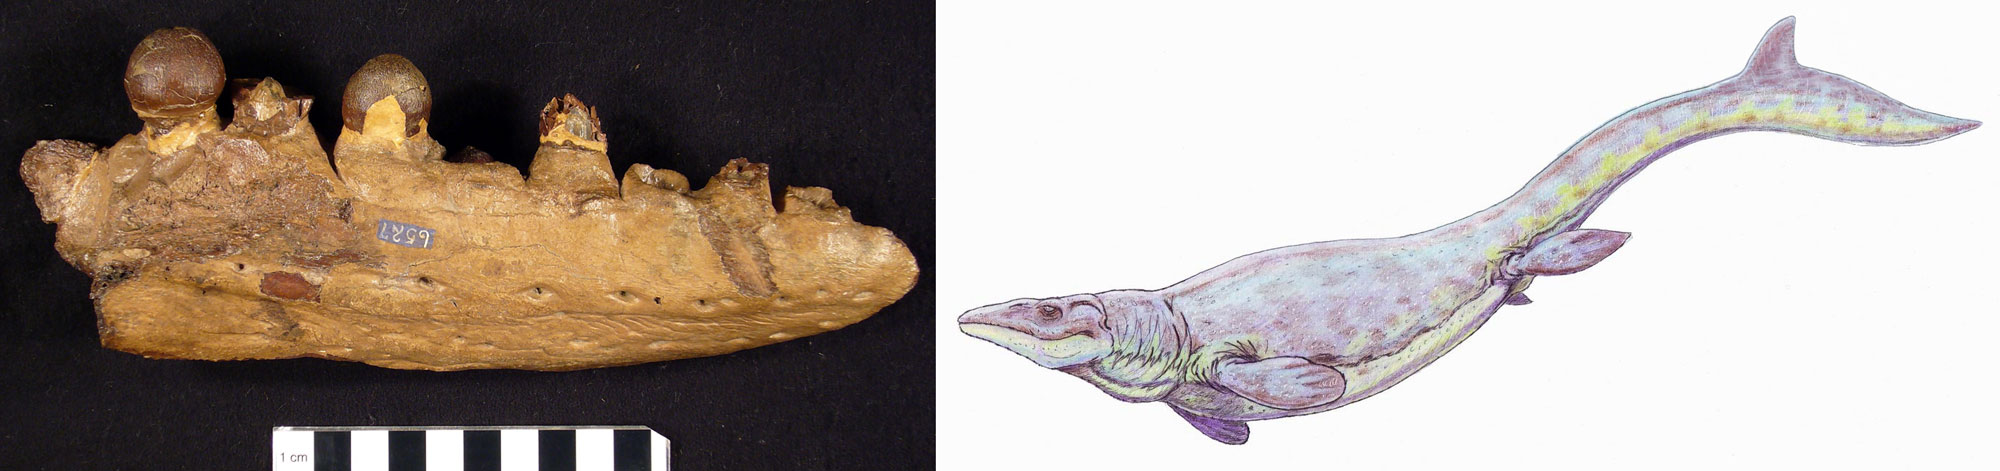
The mosasaur Globidens alabamensis from the Cretaceous Mooreville Chalk of Alabama. Left: Portion of a lower jaw. Image from the Smithsonian Learning Lab (CC0/Public Domain). Right: Reconstruction of the G. alabamensis by Dmitry Bagdanov (Wikimedia Commons, Creative Commons Attribution-ShareAlike 3.0 Unported license, image modified from original). Globidens alabamensis was about 6 m (20 ft) long and ate mollusks.
At the very end of the Cretaceous, the Gulf Coast experienced an enormous disruption when an asteroid or comet collided with Earth in what is now the northern Yucatán Peninsula in Mexico, just a few hundred miles away from the southeastern U.S. The impact vaporized both water and rock, blocking out sunlight for weeks to years, leading to a collapse of photosynthesis and food webs on land and in the oceans. After this event, the climate may have cooled briefly, but it soon rebounded to a warmer state.
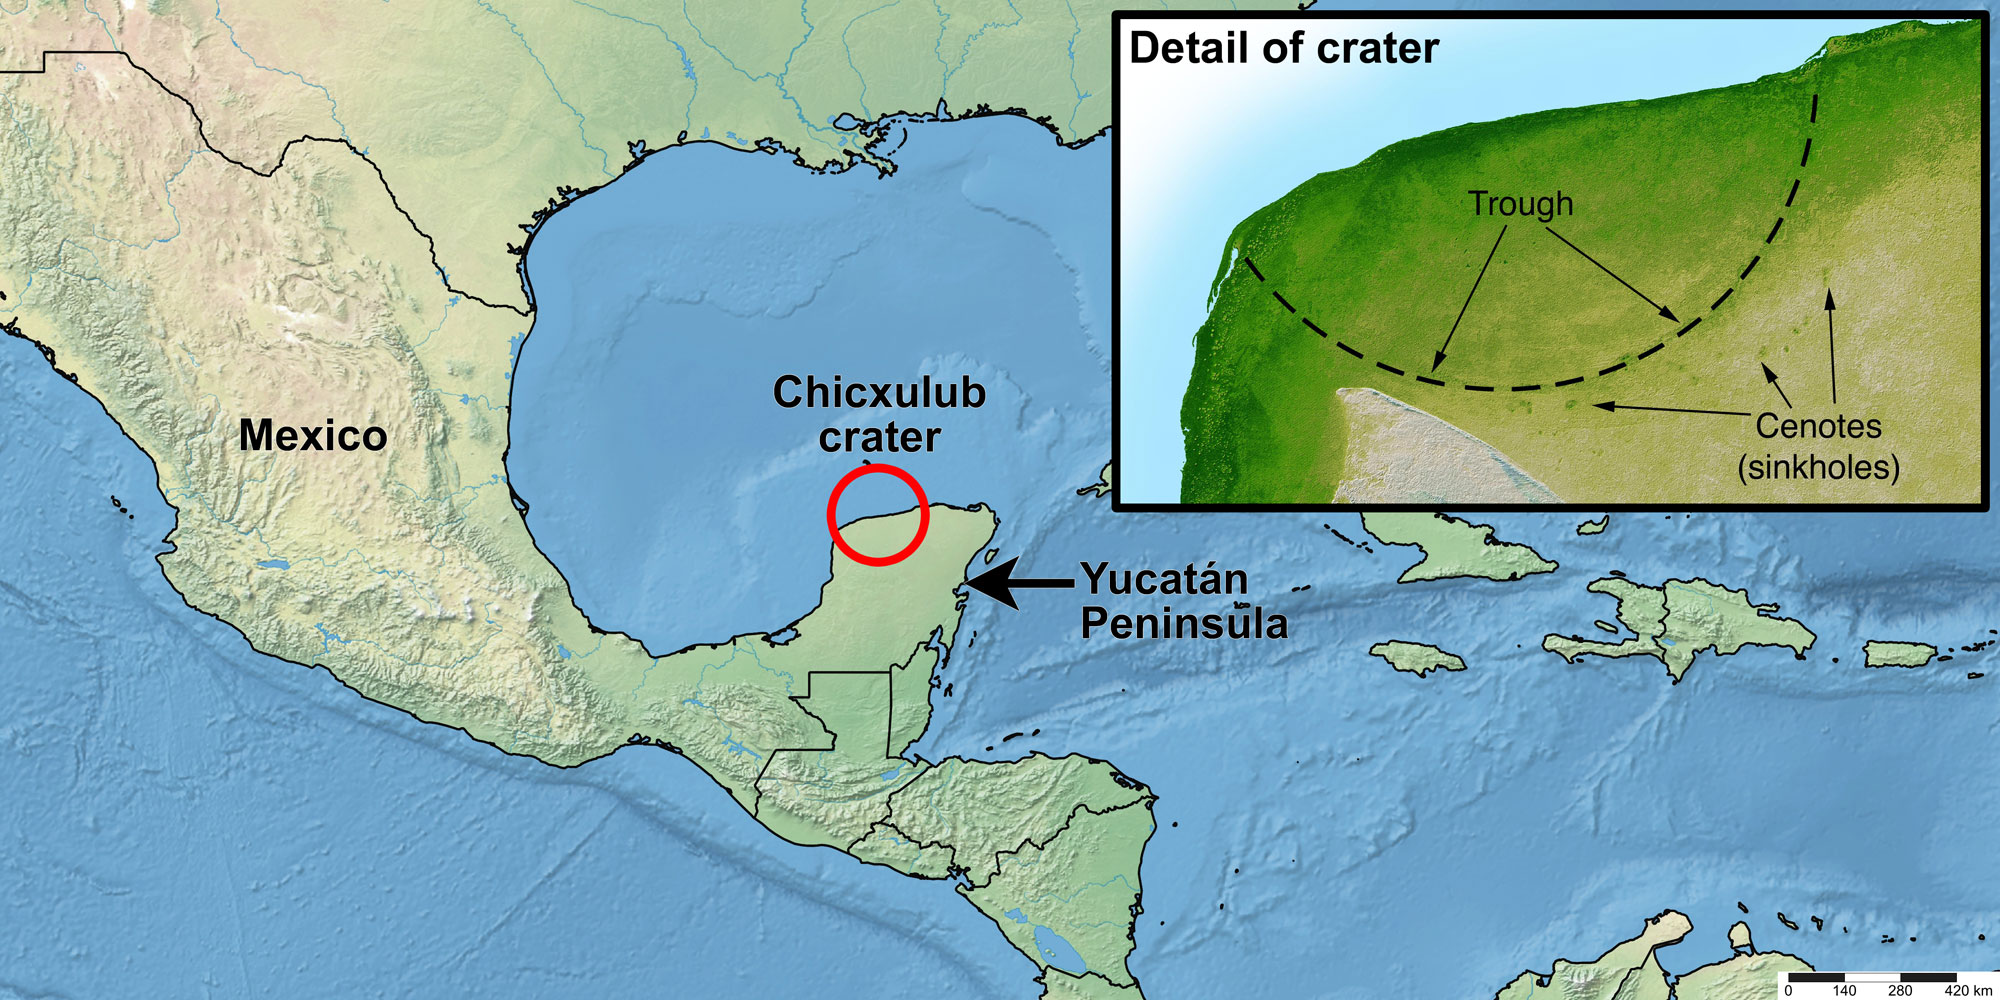
Map of the modern Yucatán Peninsula region showing the location of the Chicxulub impact crater. The inset image is a shaded relief image that shows the edge of the crater on the Yucatán Peninsula with sinkholes in the rock surrounding it. Map made by Elizabeth J. Hermsen using Simplemappr and modified in Photoshop. Inset image from the NASA Jet Propulsion Laboratory (PIA03397).
Cenozoic (66 million years ago to present)
Paleogene (66 to 23 million years ago)
As the Cenozoic era began, global temperatures rose even further into the early Eocene. At the boundary between the Paleocene and Eocene epochs (around 56 million years ago), temperatures spiked upward in what geologists call the Paleocene-Eocene Thermal Maximum (PETM). During this event, which lasted perhaps only around 10,000 years, the atmosphere and ocean warmed by as much as 8°C (14°F) in as little as 4000 years. This greenhouse effect persisted for 100,000 years. This warm interval reflected in the types of land plants and diversity of marine life—especially clams, snails, and echinoderms—represented by fossils in the Southeast Coastal Plain.
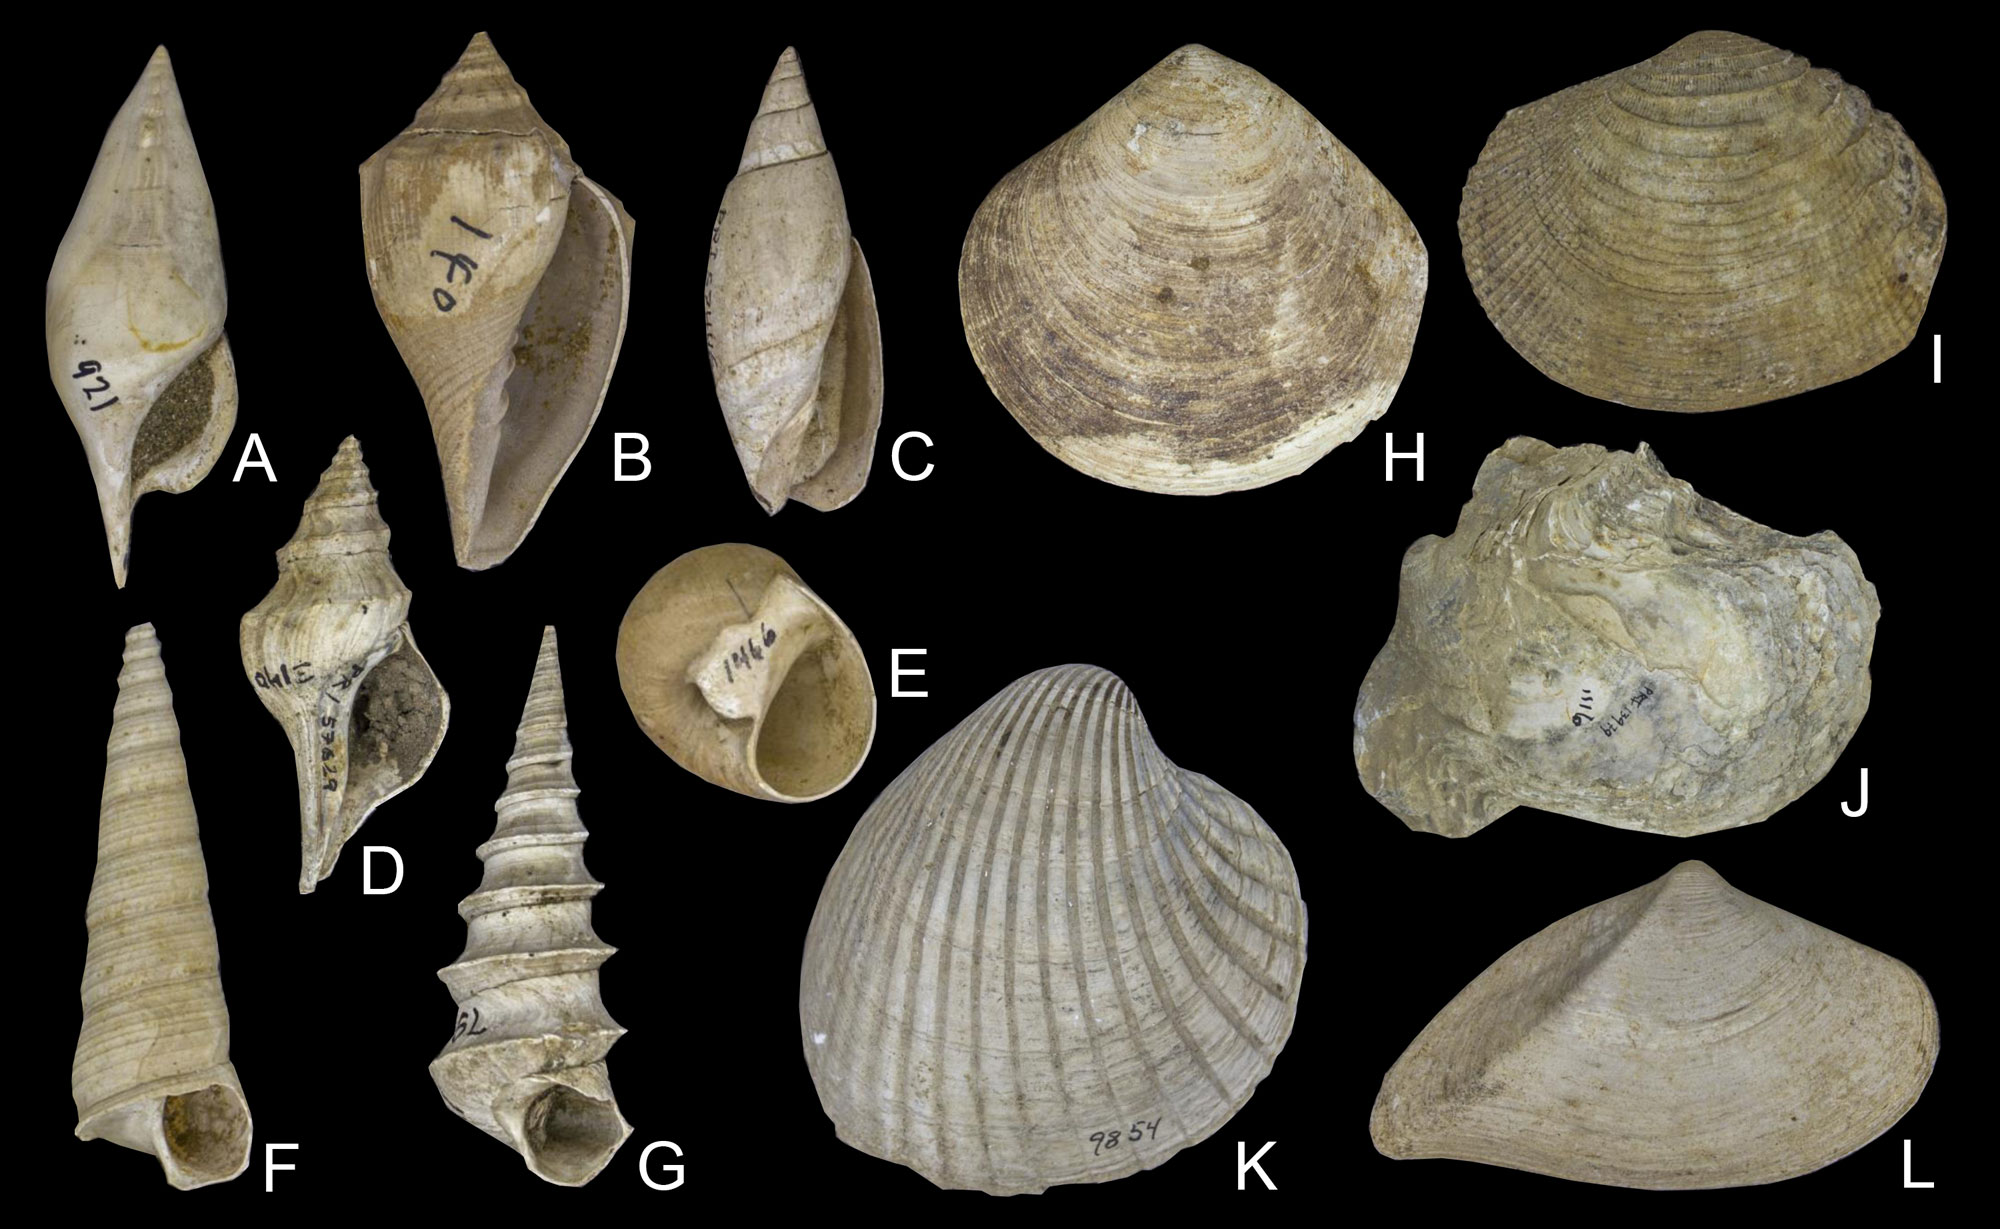
Paleogene mollusks from the Alabama and Mississippi. A–G) Gastropods; H–L) bivalves. A. Calyptraphorus velatus, late Eocene, 5 cm (2 in) tall. B. Athleta sayana, middle Eocene, 5 cm (2 in) tall. C. Agaronia alabamensis, middle Eocene, 4 cm (1.6 in) tall. D. Levifusus prepagoda, early Eocene, 5 cm (2 in) tall. E. Neverita limula, middle Eocene, 4 cm (1.6 in) tall. F. Turritella arenicola, late Eocene, 3.8 cm (1.5 in) tall. G. Turritella mortoni postmortoni, late Paleocene, 6 cm (2.4 in) tall. H. Crassatella alta, middle Eocene, 10 cm (3.9 in) wide. I. Corbis distans, middle Eocene, 4.5 cm (1.8 in) wide. J. Cubitostrea sellaeformis, middle Eocene, 10 cm (3.9 in) wide. K. Venericardia planicosta, early Eocene, 5.5 cm (2.2 in) wide. L. Crassatellites protextus, middle Eocene, 5 cm (2 in) wide. Photographs by Wade Greenberg-Brand, specimens in the collection of the Paleontological Research Institution, Ithaca, New York.
In the late Eocene, the Earth began cooling, and global temperatures fell sharply at the boundary between the Eocene and Oligocene epochs (around 35 million years ago). The rocks and fossils of the Southeast show that the area did not cool as much as areas farther north did. The oldest rocks in Florida are coral-rich Eocene limestones that clearly formed in warm seas.
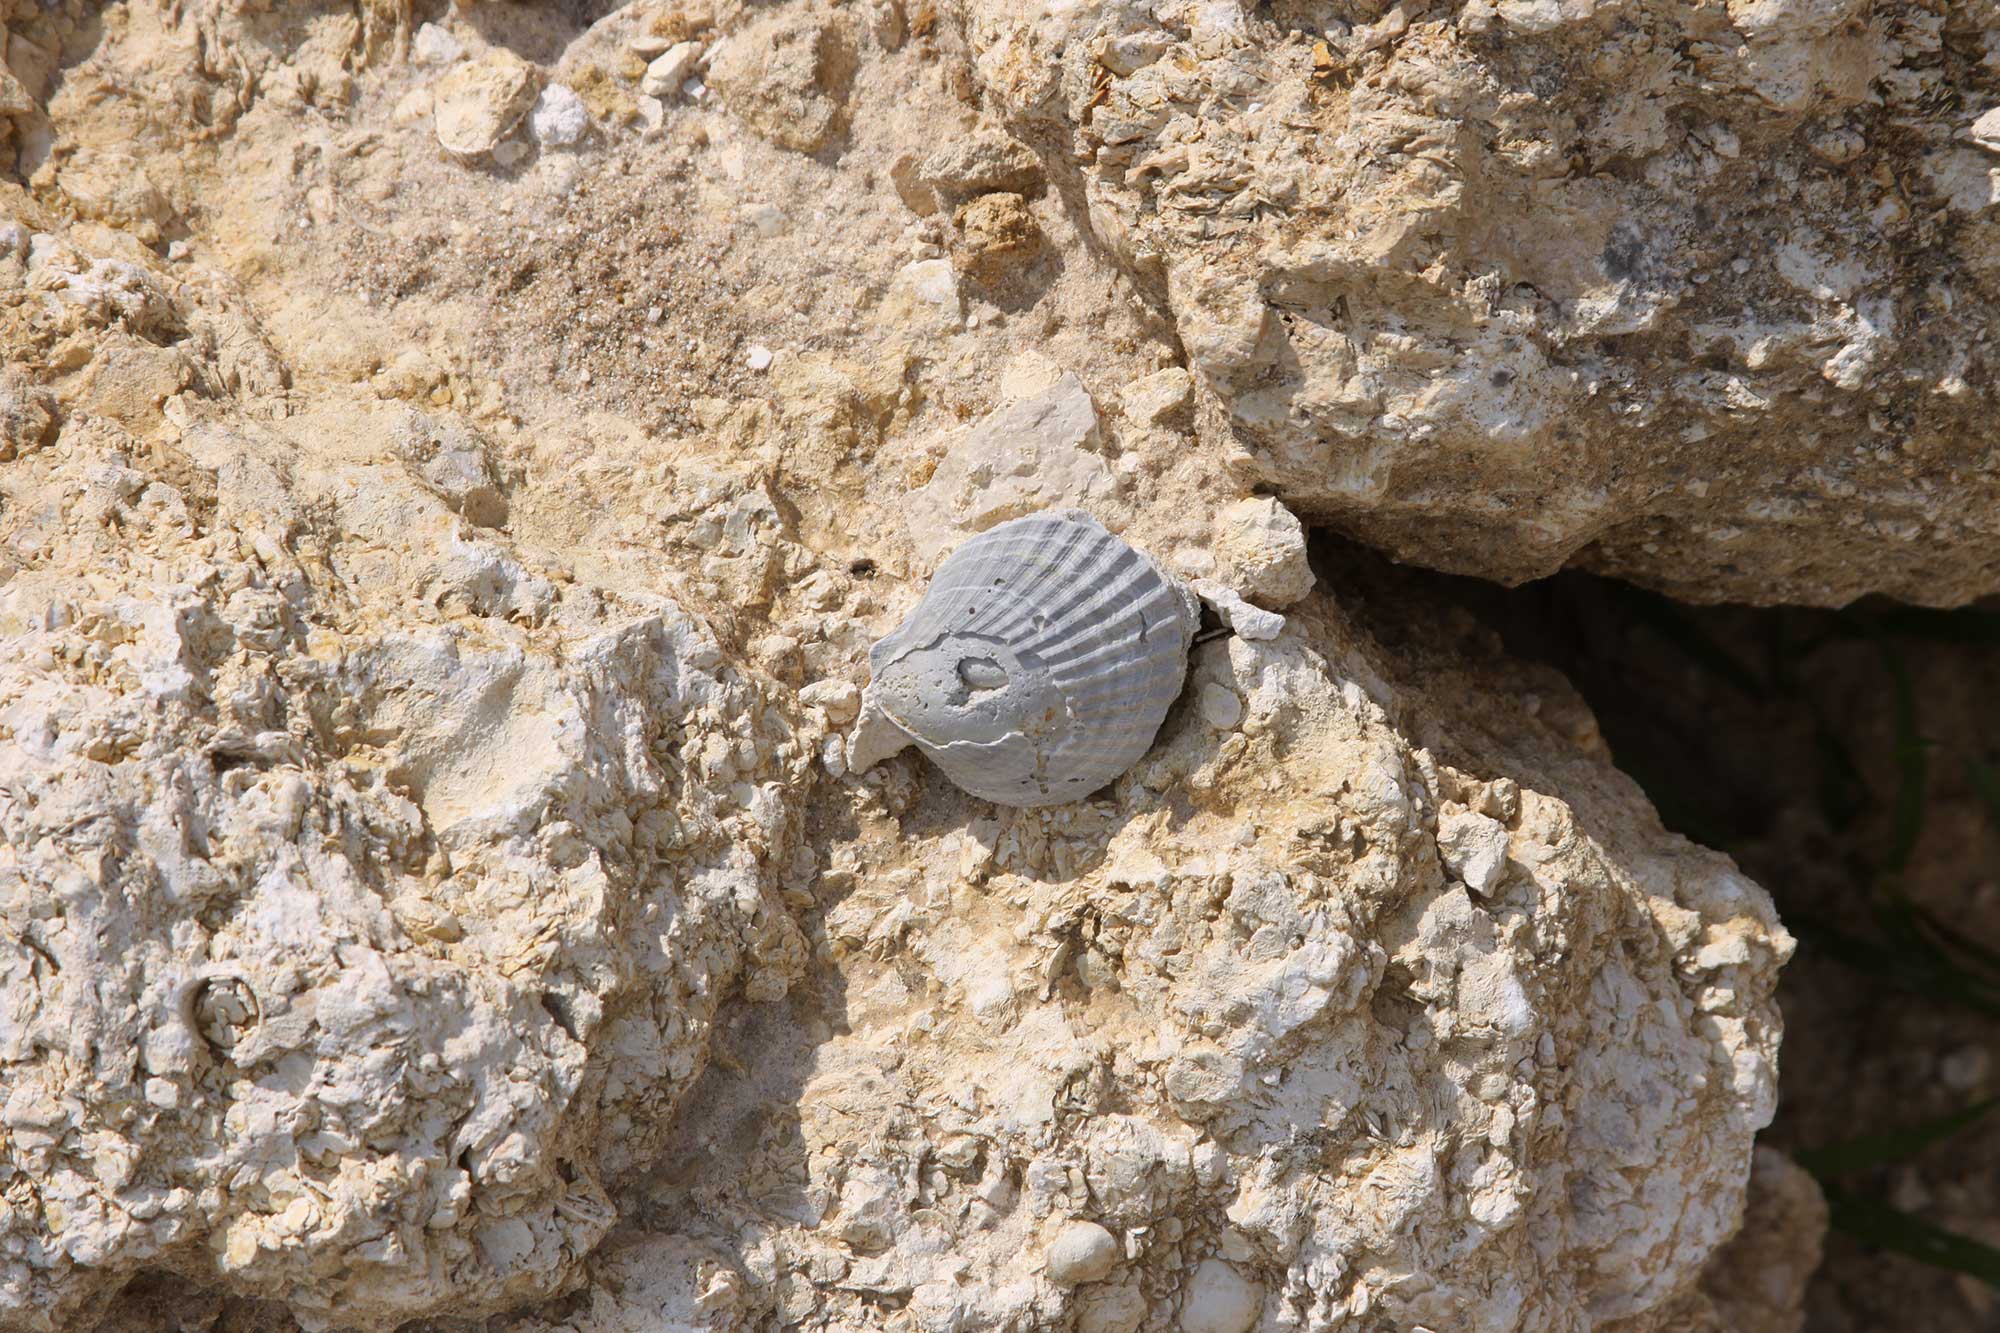
A bivalve shell in the Eocene Ocala Limestone of Florida. Photo by Jonathan R. Hendricks.
Neogene (23 to 2.6 million years ago)
Climates warmed slightly during the Miocene, a change reflected in the diverse marine and terrestrial fossils of the Atlantic Coastal Plain from Maryland to Florida. Global temperatures again began to fall after a slight peak in the middle Miocene. These changes are also visible in the Southeast's fossil record, with species that had lived farther north retreating southward over time.
Around 3.5 million years ago, glacial ice began to form over the Arctic Ocean and on the northern parts of North America and Eurasia. A major contributing factor to this event was a geological change the emergence of the Isthmus of Panama, which was formed by undersea volcanoes. The new dry-land isthmus blocked the warm ocean currents that had been flowing east-to-west from the Atlantic to the Pacific for more than 100 million years. These currents were diverted into the Gulf of Mexico and ultimately into the western Atlantic Gulf Stream.
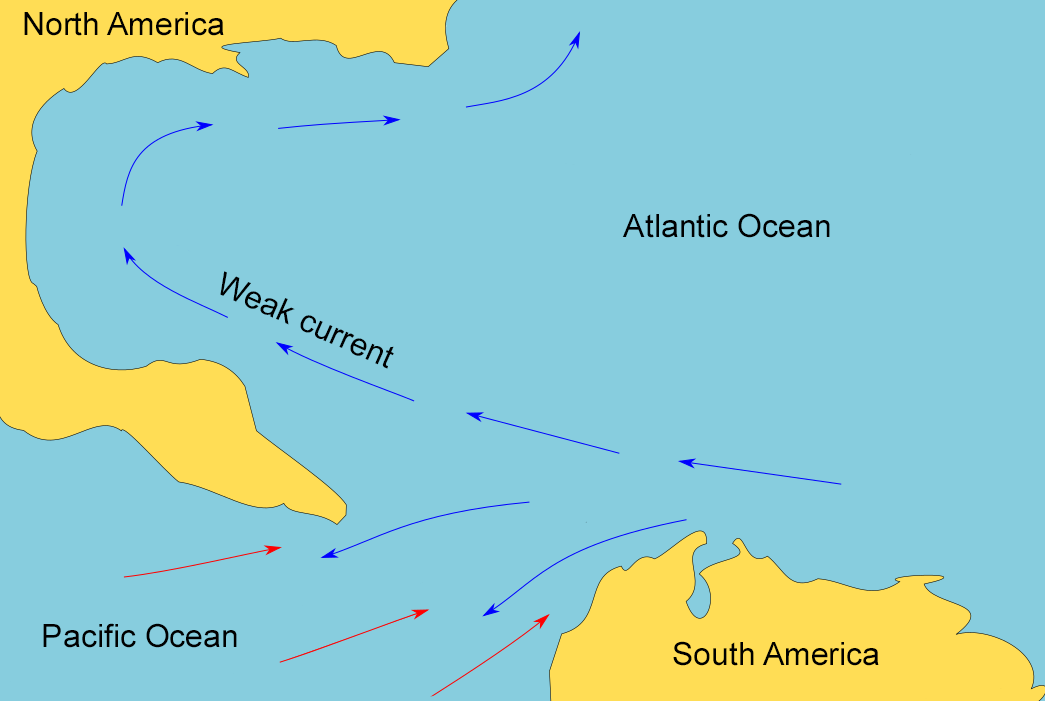
Map of the Gulf of Mexico region before the closure of the Isthmus of Panama. Before the Isthmus closed, the Atlantic and Pacific oceans were connected. Map modified from a map by Chiche Ojeda (Wikimedia Commons, Creative Commons Attribution-ShareAlike 4.0 International license, image cropped and modified).
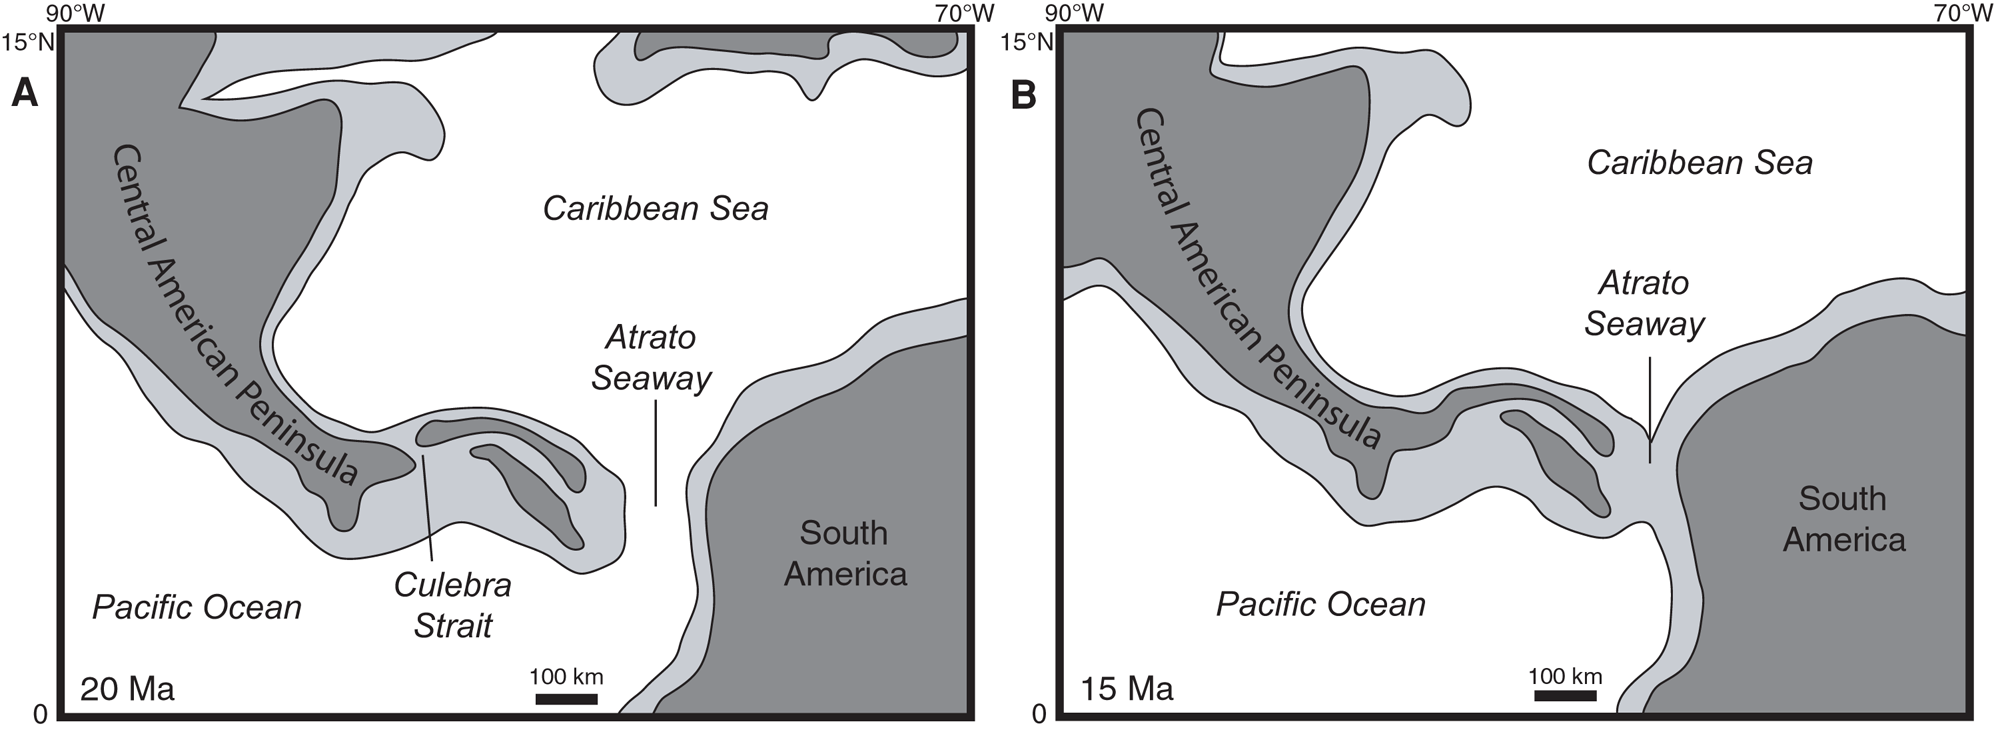
Maps showing the progressive closure of the Isthmus of Panama at 20 million years ago (A) and 15 million years ago (B). Dark gray is land, white and light gray are submerged areas. Modified from Figure 11 in Kirby et al. (2011) PLoS ONE 3(7): e2791 (Creative Commons Attribution license, image reorganized and resized).
The reefs that make up the bulk of Florida's carbonate platform formed in the warm tropical sea that resulted from this change in ocean circulation. The changes in ocean circulation throughout the Caribbean and Gulf of Mexico also affected nutrient supplies in the coastal ocean, which may have contributed to an increase in the extinction of marine animals—including everything from mollusks and corals to whales and dugongs—during the late Pliocene.
Fossil coral (Septastrea marylandica) from the upper Pliocene Tamiami Fm. (Pinecrest Beds) of Sarasota County, Florida (PRI 70753). Specimen is from the collections of the Paleontological Research Institution, Ithaca, New York. Maximum length of specimen is 46.0 mm. This species lived by encrusting and growing on the shells of other organisms, in this case a snail shell. Learn more about this species on the Neogene Atlas of Ancient Life. Model created by Emily Hauf (Sketchfab, CC0 1.0 Universal, public domain dedication).
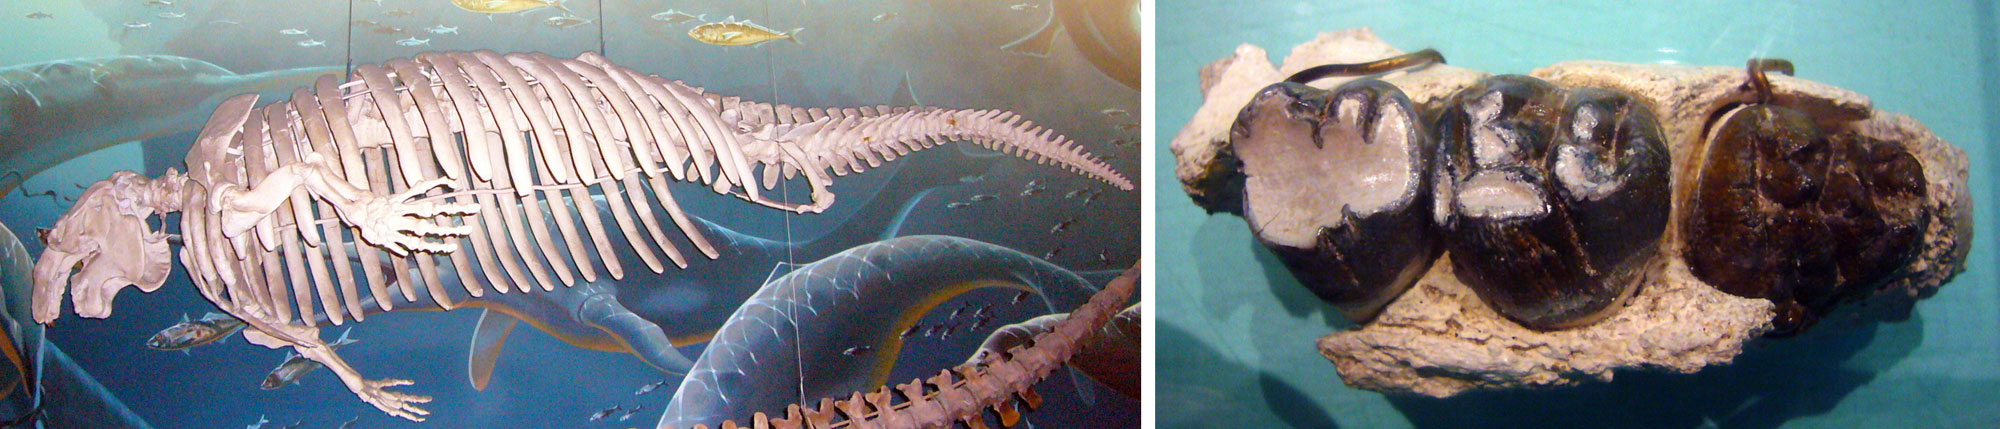
Extinct fossil dugong (Metaxytherium floridanum) from the Neogene of Polk County, Florida. Left: Mounted skeleton on display at the National Museum of Natural History in Washington, D.C. Photo of USNM PAL244477 by the Smithsonian Institution (CC0/public domain). Right: Portion of a bone with teeth. Photo of USNM PAL356680 by the Smithsonian Institution (CC0/public domain).
Quaternary (2.6 million years ago to present)
Eventually, a sheet of sea ice formed over the Arctic, and ice sheets spread over northern Asia, Europe, and North America, signaling the start of the most recent ice age. Since 800,000 years ago, an equilibrium has been reached between warming and cooling, with the ice caps growing and retreating primarily due to the influence of astronomical forces (i.e., the combined gravitational effects of the Earth, Sun, moon, and planets). The ice sheets in the Northern Hemisphere did not extend into the Southeast, even at their largest.
The Southeast's climate was, however, affected by the presence of ice to the north. Studies of pollen and plant fossils from South Carolina's coastal plain indicate that between 19,000 and 12,800 years ago, the climate was suited to trees typical of much colder climates today. During glacial intervals, the area was also somewhat wetter than it is today, with wetlands and forests covering much of what would later become grassland. Pleistocene deposits in Tennessee, West Virginia, North Carolina, Florida, and Alabama contain abundant fossils of terrestrial vertebrates such as horses, camels, bison, mastodons, mammoths, and ground sloths. Some of these are animals that we associate with cold climates.
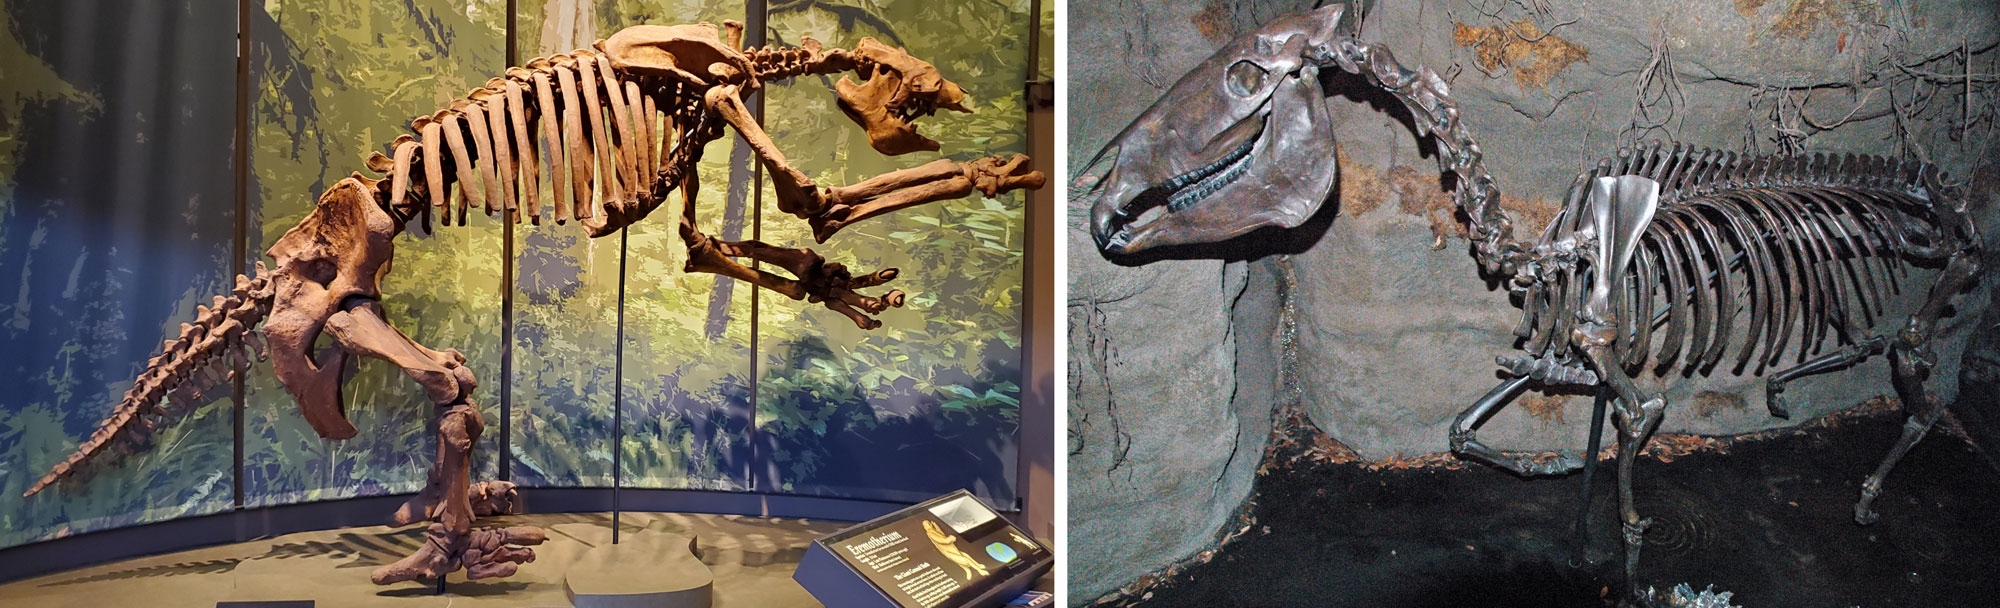
Pleistocene fossil mammals from Florida. Left: Ground sloth (Eremotherium laurillardi, cast) from Daytona Beach, Florida, on display at the Tellus Science Museum in Georgia. Photo by JJohanJackalope (Wikimedia Commons, Creative Commons Attribution-ShareAlike 4.0 International license, image cropped). Right: Horse (Equus sp., cast) from Leisey Shell Pit on display at the South Florida Museum. Photo by James St. John (flickr, Creative Commons Attribution 2.0 Generic license, image cropped).
Future climate of the Southeast
The Southeast contributes significantly to climate change. The population of any industrialized and particularly wealthy country produces pollution, and the majority of these emissions come from the use of petroleum. The more than 70 million residents of the Southeast use carbon-rich fossil fuels to provide electricity for lighting, cooling, and appliances, to fuel their transportation and industry, and to make the products they use. Burning those fossil fuels releases carbon into the atmosphere, which warms the Earth.
Of the southeastern states, Florida emits the most greenhouse gases, releasing 218 million metric tons of carbon dioxide per year. Florida is the fourth-highest emitter in the nation. By comparison, Texas, the highest producer, releases nearly 656 million metric tons of CO2 per year. Greenhouse gas emissions continue to grow in some areas; over the last decade, Kentucky's emissions have increased by about 2% due to the state's reliance on coal as an energy source.
On the other hand, southeastern states are making changes to reduce the human impact on climate. Virginia, Tennessee, and North Carolina have all reduced their CO2 emissions by more than 22 metric tons in the last decade. The city of Richmond, Virginia, and the County of Sarasota, Florida, were early adopters of the 2030 Challenge, an effort to reduce fossil fuel use in buildings so that both new and renovated buildings will qualify as carbon neutral by the year 2030. Additionally, many states are stepping up their use and production of renewable energy. As of 2014, Tennessee ranks 19th in the nation for renewable energy production, much of which it produces from hydroelectricity and biomass.
Trends and predictions
Studies show that the Southeast's climate is changing right now and that change has accelerated in the latter part of the 20th century. These changes include the following:
- The number of days with temperatures above 35°C (95°F) and nights above 24°C (75°F) has been steadily increasing since 1970.
- In 2007, severe drought cost Georgia's agricultural industry over $339 million in crop losses.
- Rising seas and storm surges jeopardize the infrastructure of coastal cities. Southern Florida and the Chesapeake Bay are ranked the first and third US areas most vulnerable to sea level rise, respectively.
- The Floridian aquifer system, which provides fresh water to the majority of Florida and southern Georgia, has dropped by more than 18 meters (60 feet) in some areas and is threatened by saltwater intrusion.
- Locations along the Gulf of Mexico have experienced over 20 centimeters (8 inches) of sea level rise in the last 50 years.
- The minimum annual rate of streamflow in many areas of the Southeast has decreased by as much as 50%.
- Altered flowering patterns due to more frost-free days have increased the Southeast's pollen season for ragweed, a potent allergen.
- Unique ecosystems in the Southeast, such as the Ice Mountain Preserve in West Virginia (a unique boreal zone), face adverse effects from warming temperatures.
Future temperature
Climate models predict that the Southeast's climate will continue to warm. The average annual temperature in most of the Southeast is is expected to rise 1°C to 6°C (2°F to 11°F) by the end of the 21st century. The strongest warming is projected to occur inland, in the Southeast's northwestern corner. Winter temperatures have risen the most. Today, most of the Southeast experiences four to seven fewer freezing days than it did in the 1970s. By the middle of the 21st century one can expect 20 to 30 fewer freezing days each year.
Currently, the northern part of the Southeast typically has ten days a year with temperatures below −12°C (10°F). By the middle of the 21st century, we can expect no days with temperatures that low. These increased temperatures lead to a whole host of other effects, including drier soils from more evaporation, along with the increased likelihood of drought and fires.
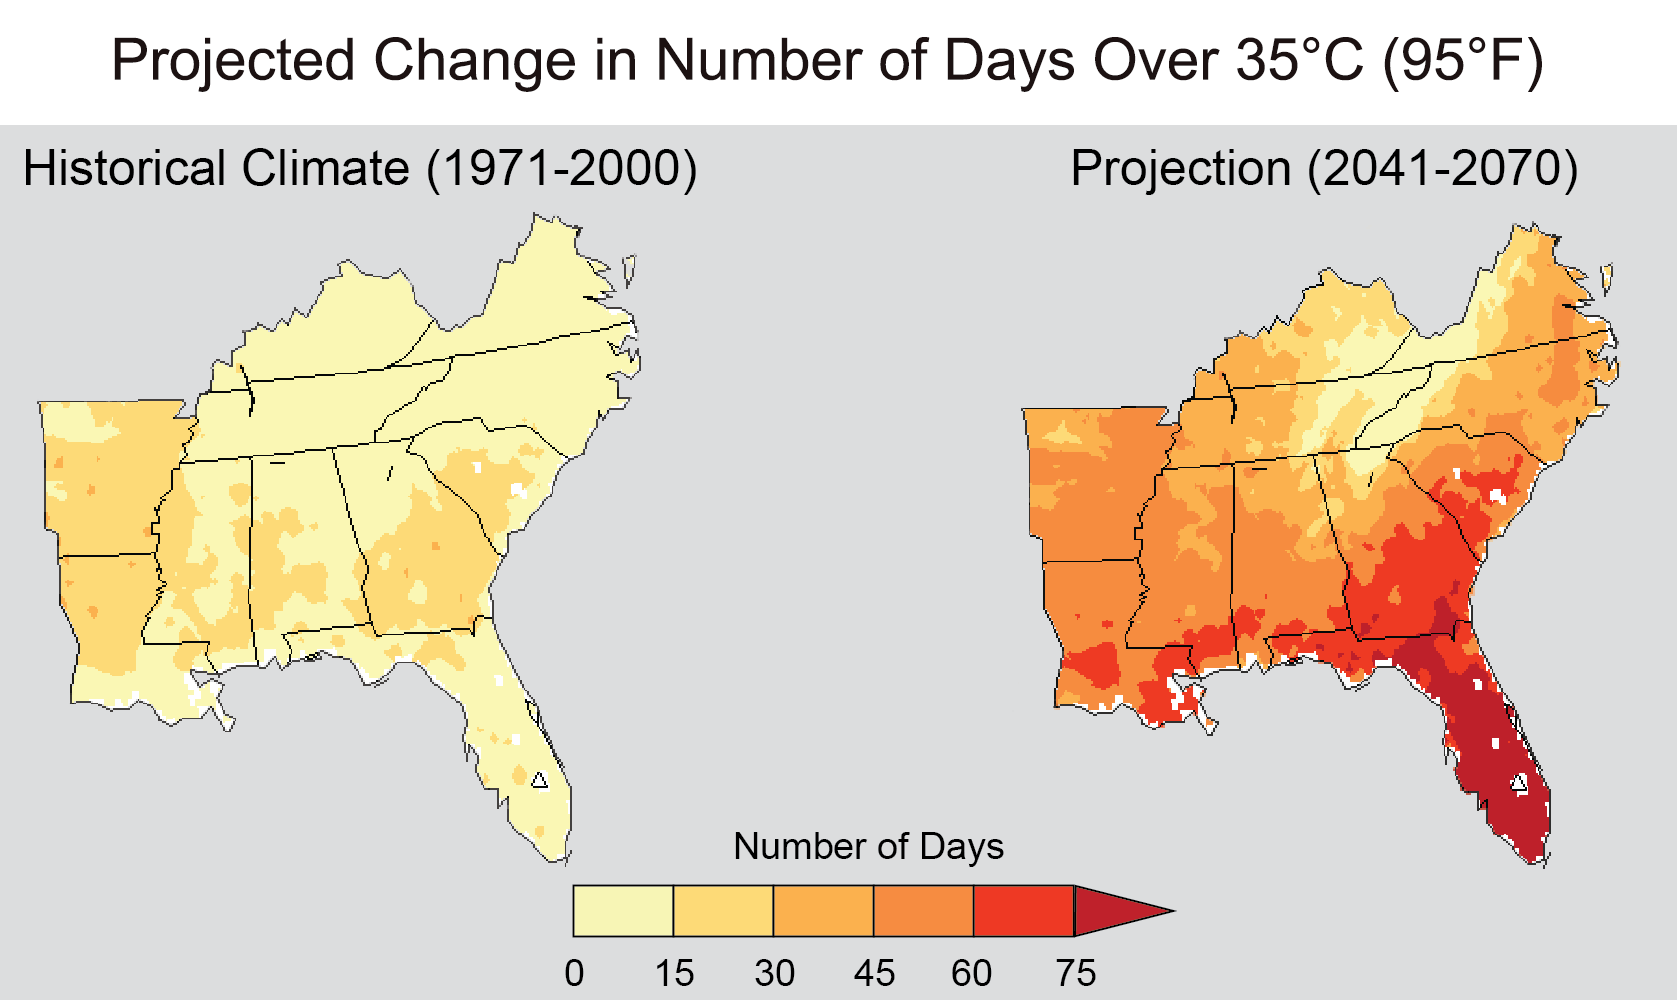
Maps showing the average number of hot days (days over 95°F or 35°C). The map on the left shows historical data for 1971 to 2000. The map on the right shows projections for 2041 to 2070. Figure source: NOAA NCDC/CICS-NC.
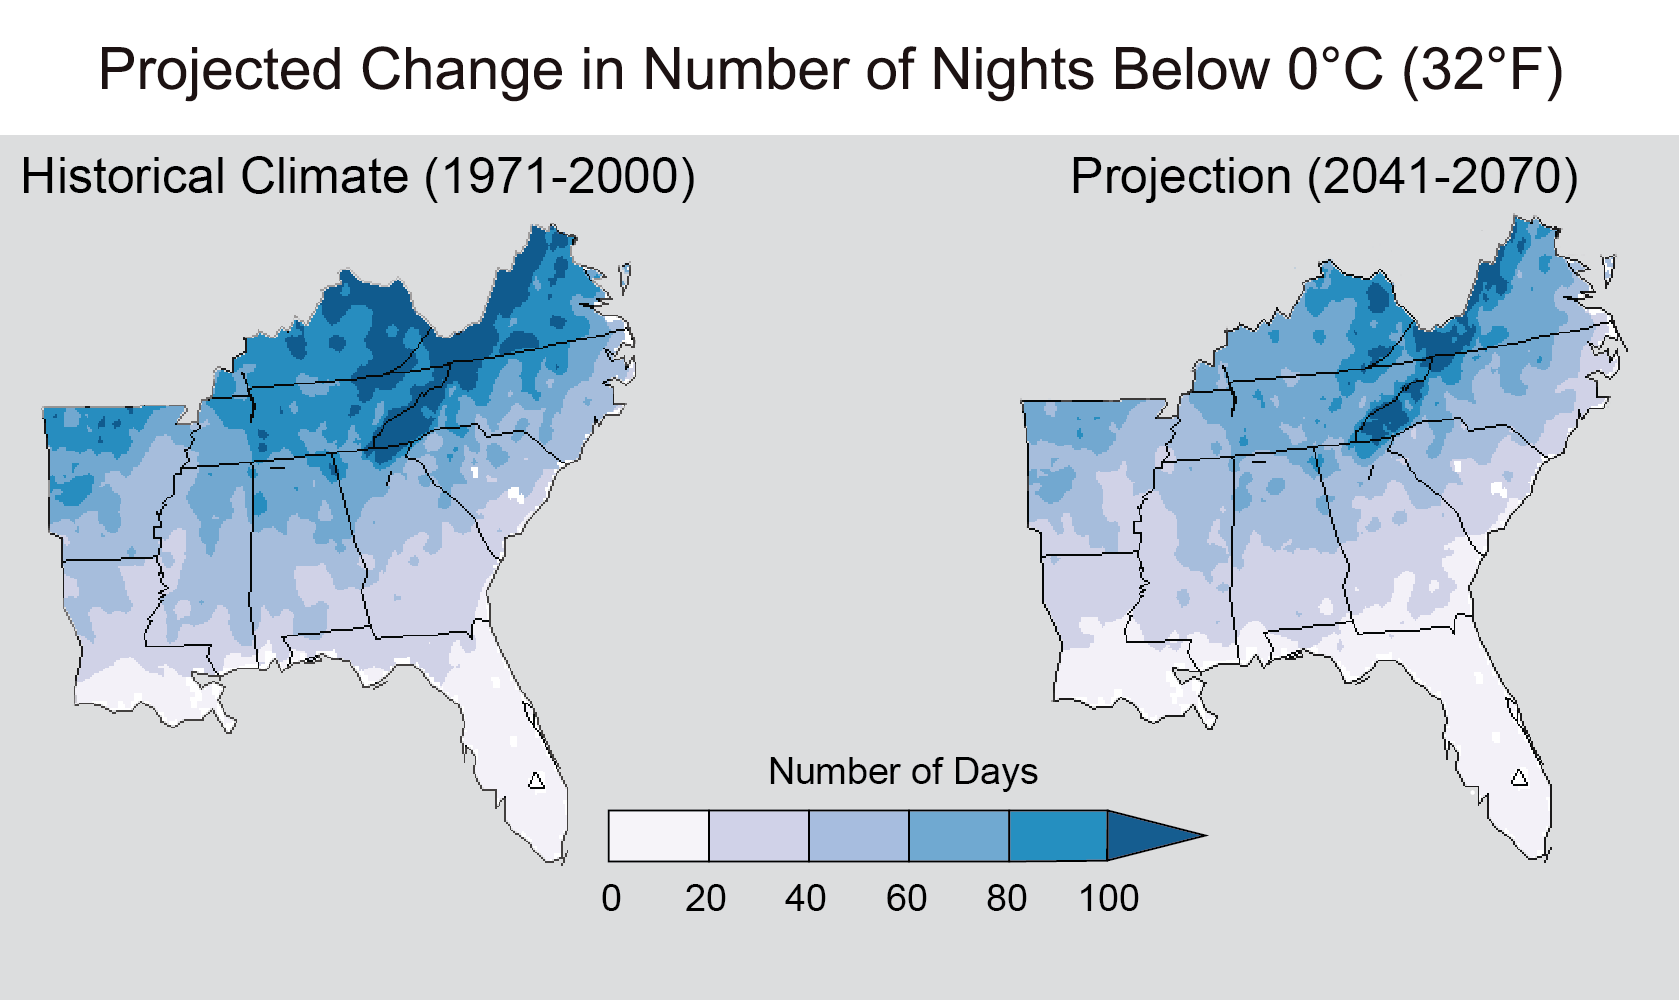
Maps showing the average number of nights below freezing (nights reaching a temperature of 32°F or 0°C or lower). The map on the left shows historical data for 1971 to 2000. The map on the right shows projections for 2041 to 2070. Figure source: NOAA NCDC/CICS-NC.
Future precipitation
Precipitation has become more variable from year to year, and heavy downpours have increased in the last 20 years. In the future, heavy precipitation events are expected to increase. This change in precipitation patterns will be caused by higher temperatures, which warm the air (warmer air can hold more water) and drive greater evaporation. Some models predict that as much as 20% more winter precipitation will occur in the northern portion of the Southeast. These models also predict more rain in the spring and fall.
Future severe weather events
The causes of specific weather events such as hurricanes and severe thunderstorms are incredibly complex. However, we know that climate change has enhanced some correlated factors, causing increased wind speed and an unstable atmosphere. Higher atmospheric moisture content has also been correlated with an increased incidence of tornados and winter storms. Although climate change is predicted to enhance the intensity of severe weather, there is currently no way to calculate what effect climate change will have on the frequency of specific storm events. For example, we might see more powerful tornados, but we do not know if we will see more of them.
Future water supplies
Water supply is an important issue in the Southeast, and communities will need to adapt to changes in precipitation, snowmelt, and runoff as the climate changes. Drier days and higher temperatures will enhance evaporation, increasing the desertification of already arid areas, affecting natural ecosystems, and increasing pressure on the water supply for agriculture and cities. In low-lying areas, especially Florida, important aquifers are at extreme risk of being contaminated by saltwater thanks to rising sea levels.
Future sea level
Sea level rise from melting glaciers and the thermal expansion of a warmer ocean is a major concern in the Southeast, with its extensive coastline and many low-lying areas, including major cities such as Miami, Tampa, and Charleston. A rising sea leads to retreating tidal forests, coastal erosion, larger and more damaging storm surges, inundation of populated areas, and stresses on municipal water and sewer systems. Increased inland flooding will impair stormwater drainage systems that empty into the ocean and destroy tidal wetlands, reducing environmental protection against storm surge and decreasing important fishery habitat.
Oil and gas production infrastructure located in areas protected by barrier islands will be at greater risk to storm surge, affecting our ability to develop energy resources. Regional studies project that by 2030, climate change could cause $4.6 billion in damages to coastal property and assets on the Gulf Coast alone. By the year 2060, the sea level in Key West, Florida is expected to be between 23 and 61 centimeters (9 and 24 inches) higher than in 2010. By the end of the 21st century, the sea level around the Southeast is predicted to rise by as much as one meter (3 feet).
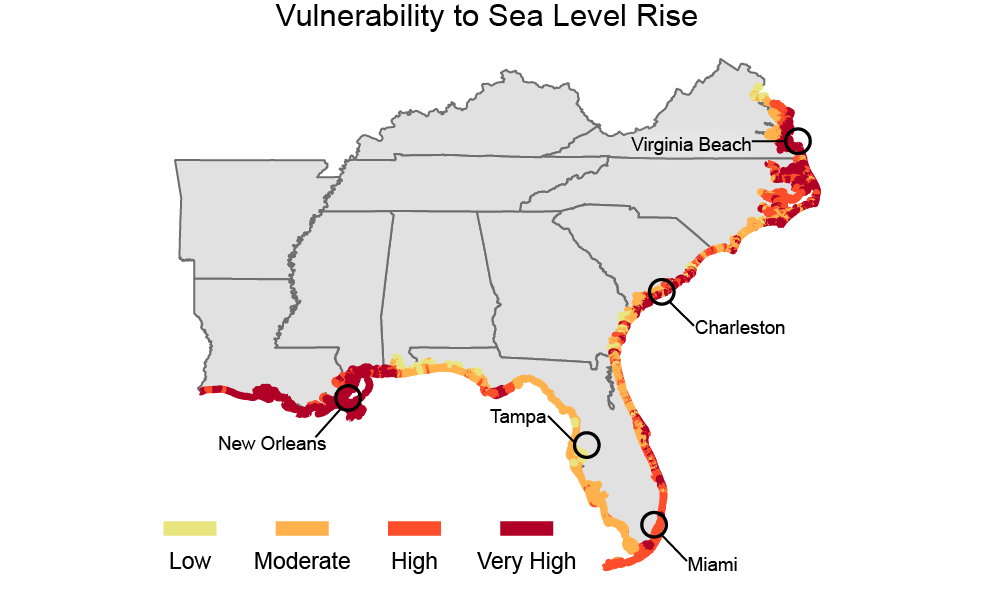
The Coastal Vulnerability Index displays the relative risk that physical changes will occur along southeastern coastlines as sea level rises. Map from National Climate Assessment 2014.
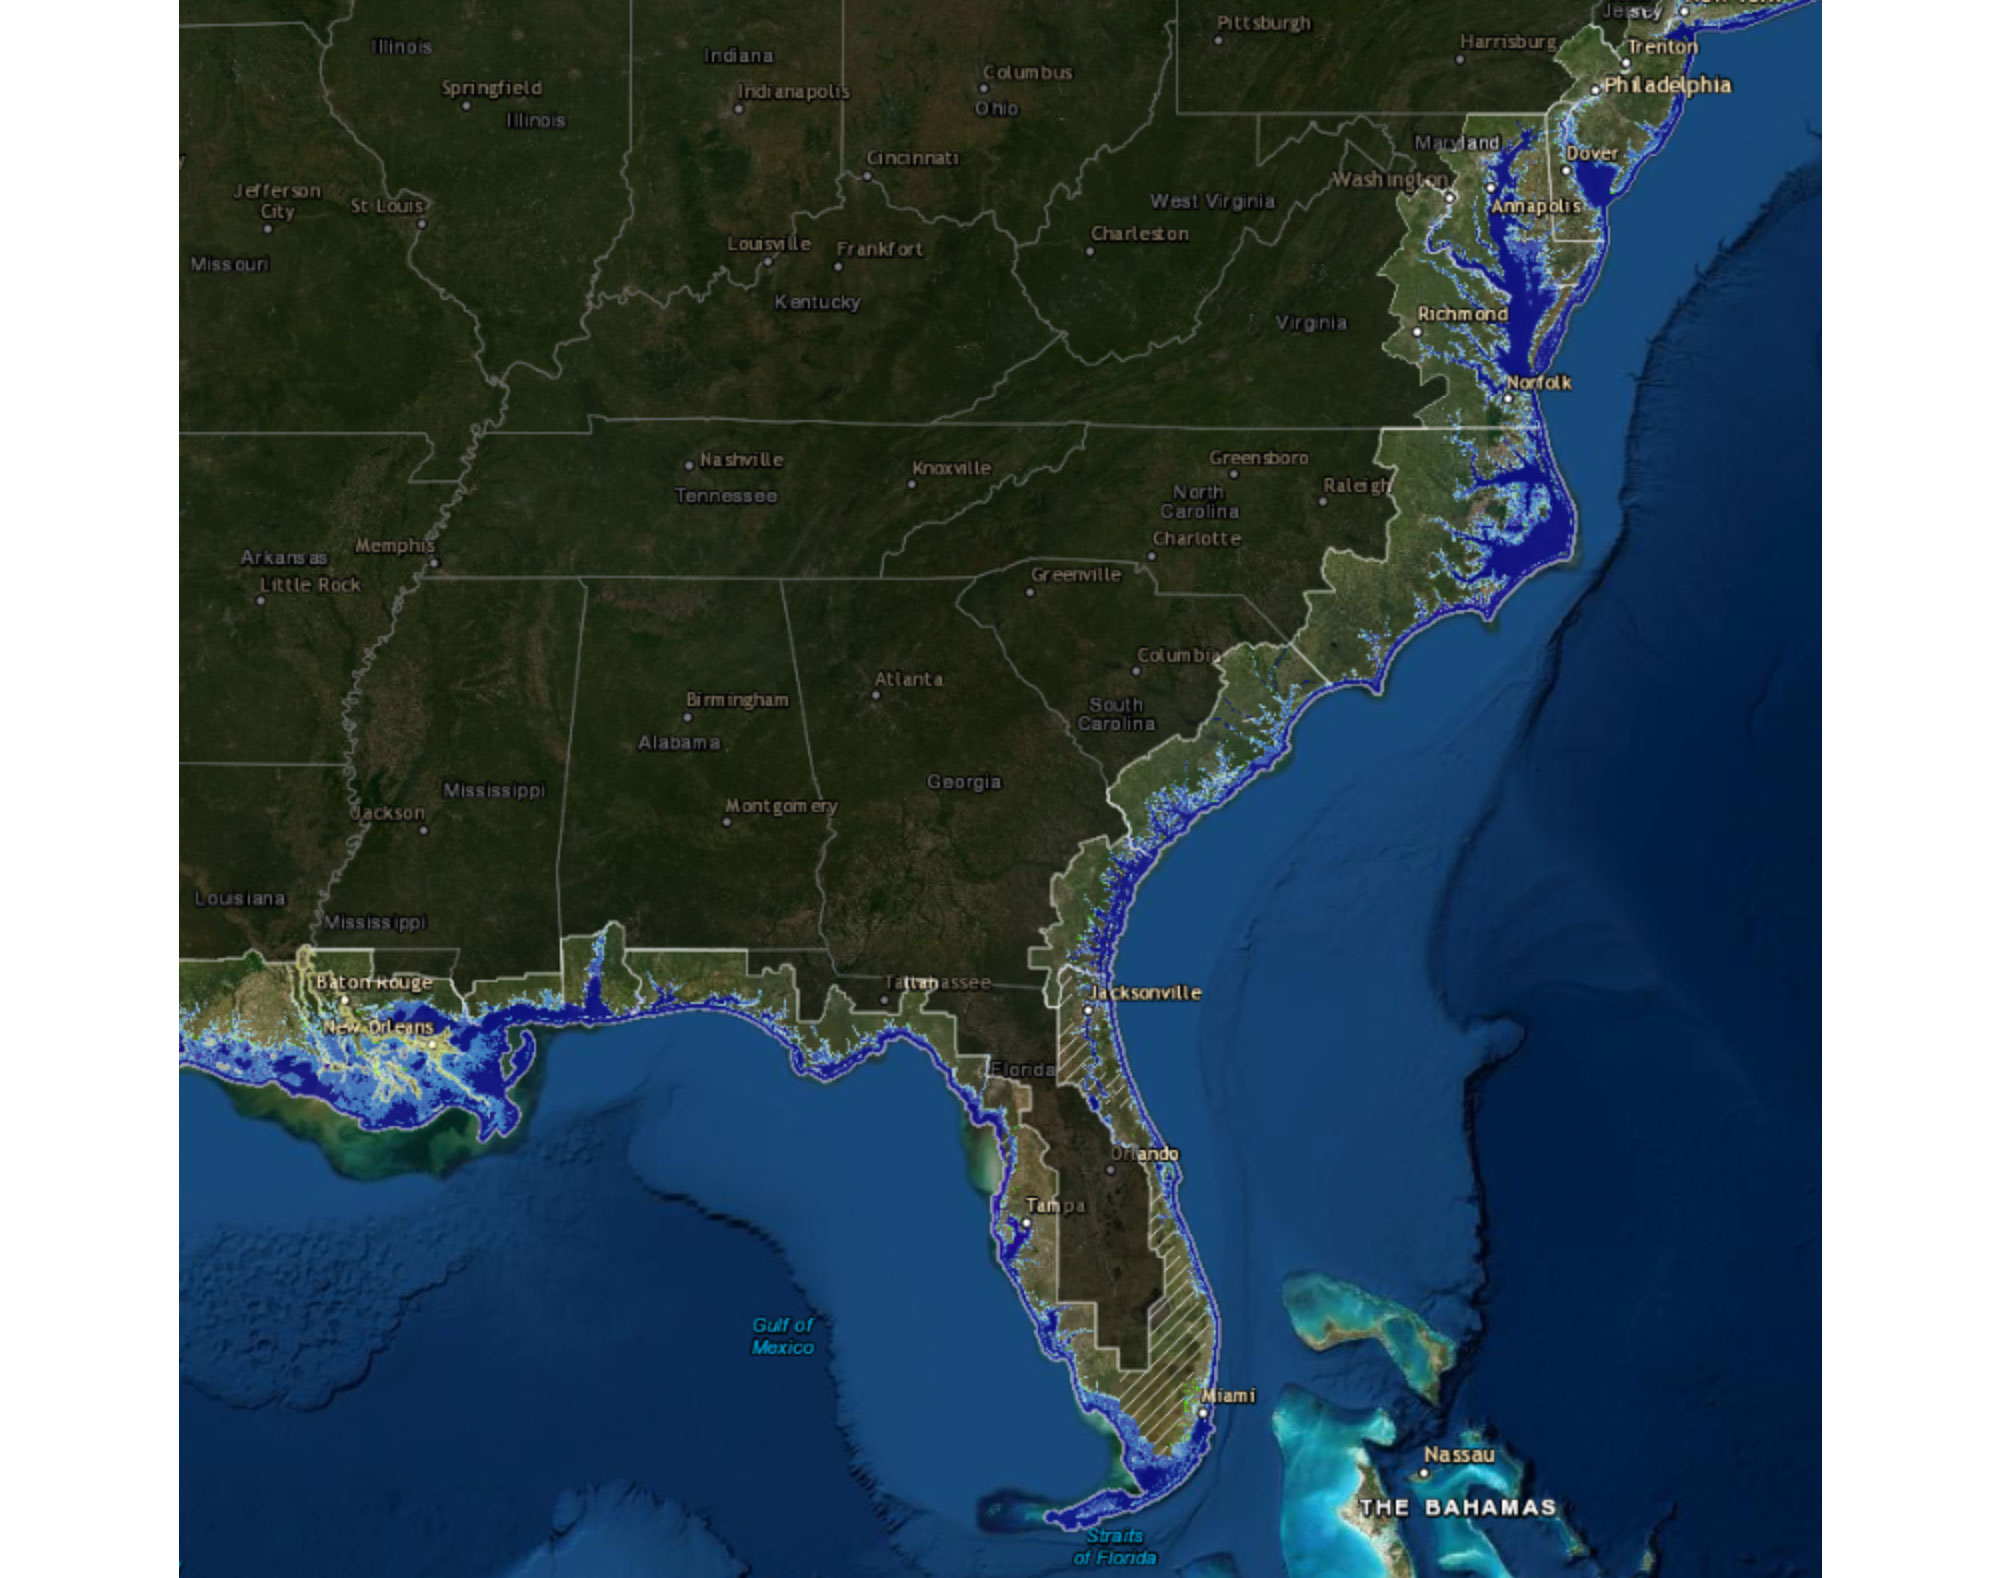
Projected land loss in the Southeast, marked by areas in blue, following a 3-foot (about 1 meter) rise in sea level. Source: NOAA sea level viewer.
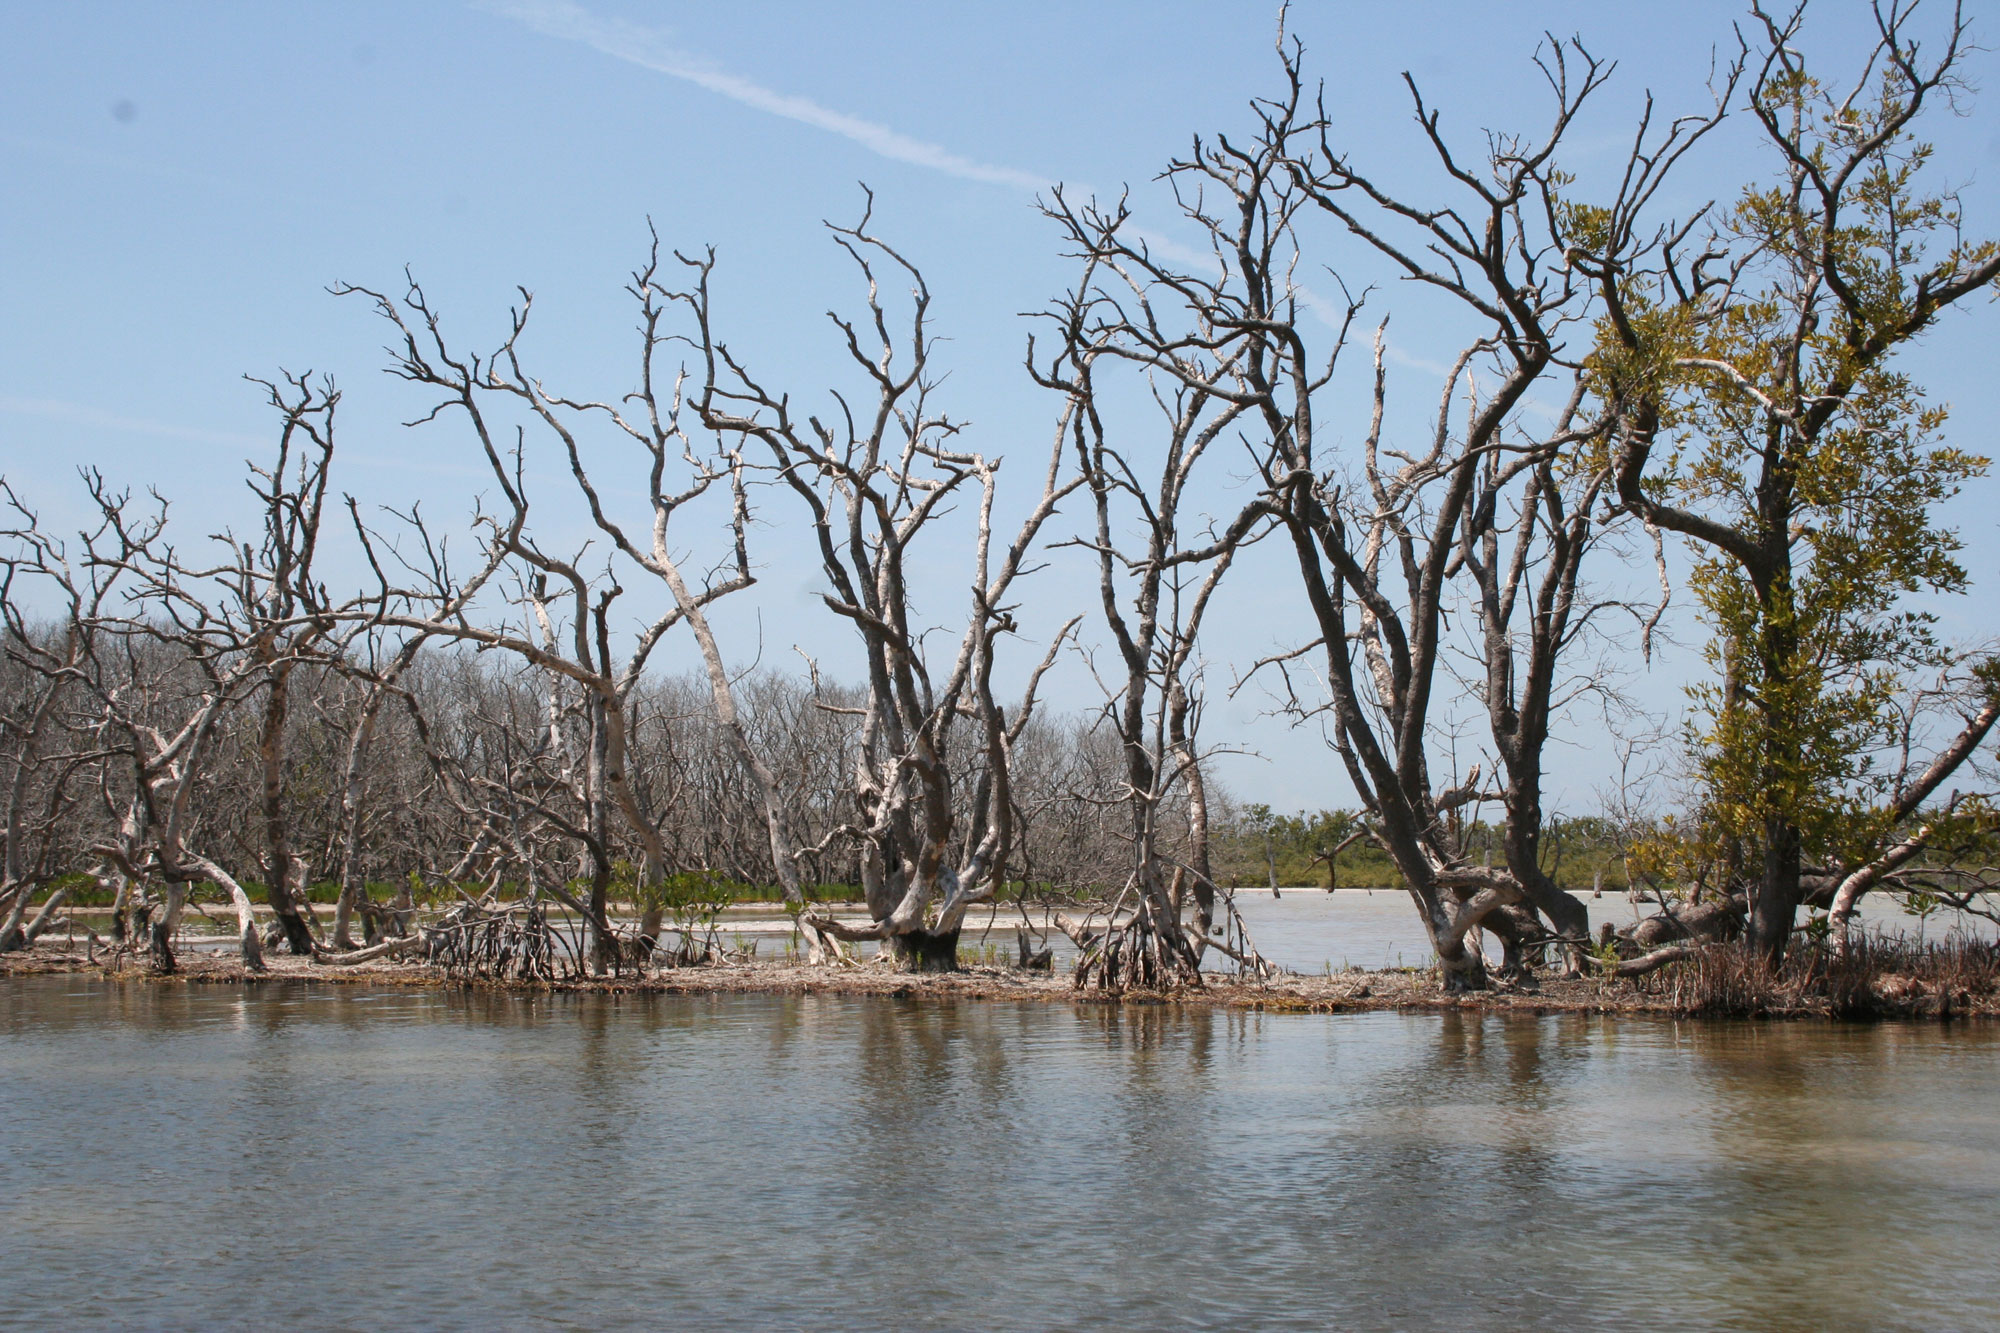
Original description: "The lasting impact of Hurricane Irma, which struck in September 2017, is apparent at Jim Foot Key in Florida Bay, Everglades National Park, on April 26, 2019. The island has lost many mangroves and water from Florida Bay now covers the island’s interior mudflats." Photo by B. Stackhouse, USGS (public domain).
Resources
Resources from the Paleontological Research Institution
Books
Zabel, I.H.H., D. Haas, and R.M. Ross. 2017. The Teacher-Friendly Guide to Climate Change. Paleontological Research Institution Special Publication 53, Ithaca, NY, 294 pp. Find updated, digital versions of the chapters of this book on Earth@Home Climate.
Allmon, W. D., T. A. Smrecak, and R. M. Ross. 2010. Climate change—past, present & future: a very short guide. Paleontological Research Institution Special Publication 38, Ithaca, NY, 200 pp.
Websites
Earth@Home Climate: https://climate.earthathome.org/
Earth@Home: Quick guides & FAQ: Climate and Energy: https://earthathome.org/quick-faqs/#climate
Earth@Home: Here on Earth: Introduction to Climate: https://earthathome.org/hoe/climate/