

Quick Answer
The ozone hole does not cause global warming. Ozone occurs naturally in a layer of the atmosphere called the stratosphere. The ozone hole is a region of the stratosphere over Antarctica (and to a lesser degree over the Arctic) where the amount of ozone had decreased in the late 20th century, due to chemical reactions between ozone and human-made substances from things like aerosol spray cans and refrigerants. Ozone is a greenhouse gas, so its presence has a warming effect, and the result of declining ozone in the late 20th century has been a regional cooling of the stratosphere over Antarctica, not warming.
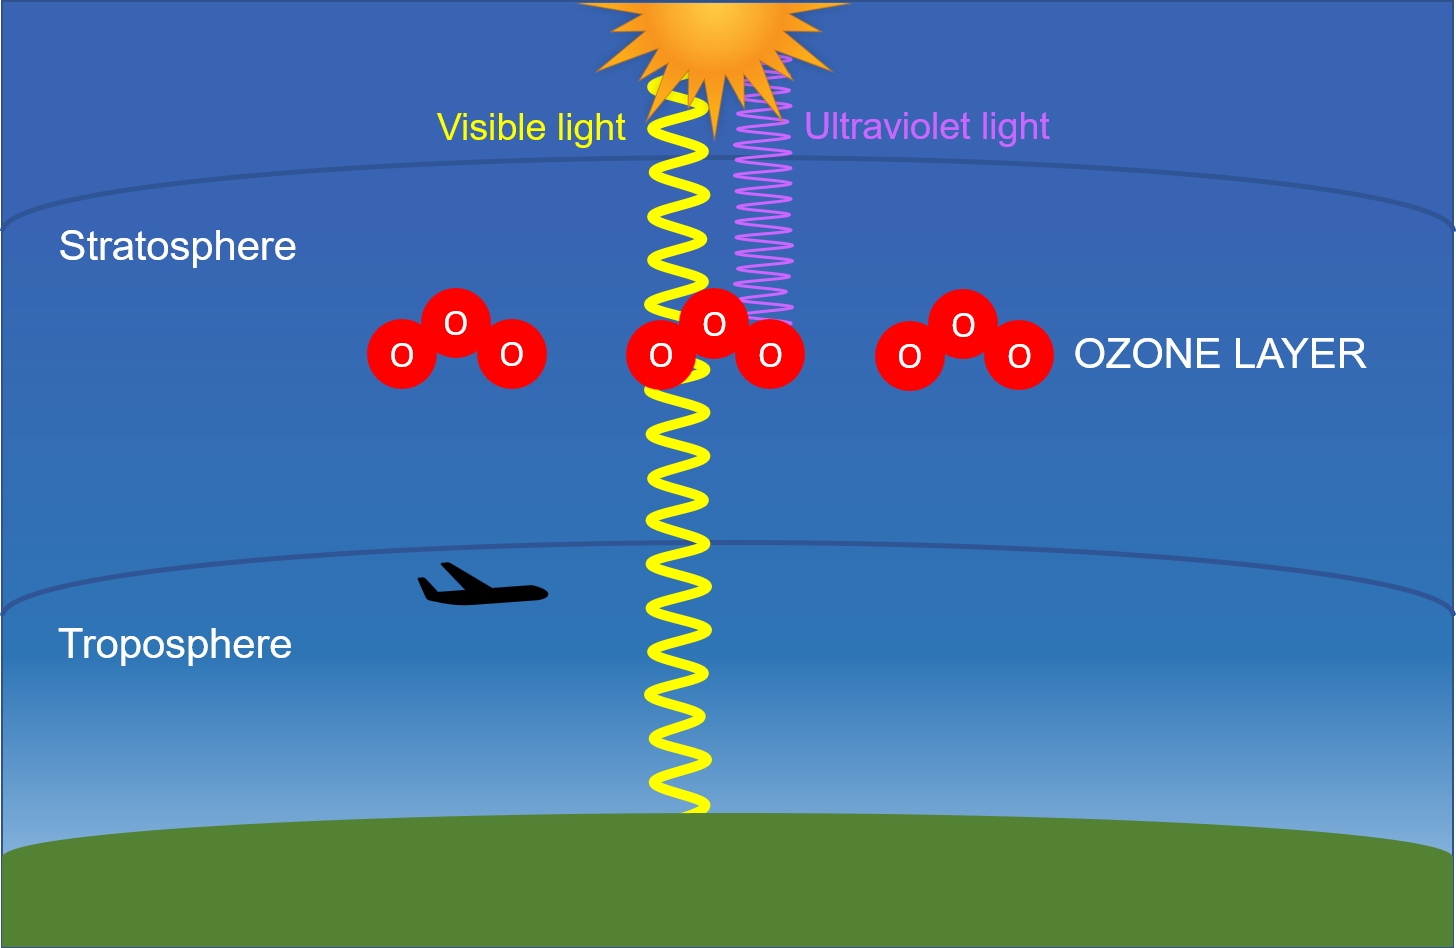
Figure 1: The ozone layer in the stratosphere. Diagram by Ingrid Zabel for PRI's Earth@Home project (CC BY-NC-SA 4.0 license).
Ozone is a naturally occurring molecule that is found high up in the atmosphere, in a layer called the stratosphere (Figure 1.) That’s just above where we fly airplanes. Stratospheric ozone protects us and other life on the planet, because it absorbs ultraviolet light from the Sun which can harm our skin and eyes, as well as other organisms.
The ozone hole is not a literal hole in the stratosphere—it’s a region where ozone levels declined in the late 20th century. Ozone was depleted through chemical reactions between ozone and human-made substances from things like aerosol spray cans and refrigerants.
In what way could the ozone hole lead to global warming? Remember that the ozone hole is a region where ozone is depleted. You might think that if there’s less ozone in the stratosphere, that means more ultraviolet light can pass through the atmosphere, and this will warm the Earth. But any warming effect from this is small compared with the greenhouse warming due to gases such as carbon dioxide and methane in the atmosphere. And the ozone hole has no effect on the amount of visible light reaching the Earth—the Sun radiates visible light most strongly (see Appendix), and it’s this visible light which is the key component of sunlight that factors into the greenhouse effect.
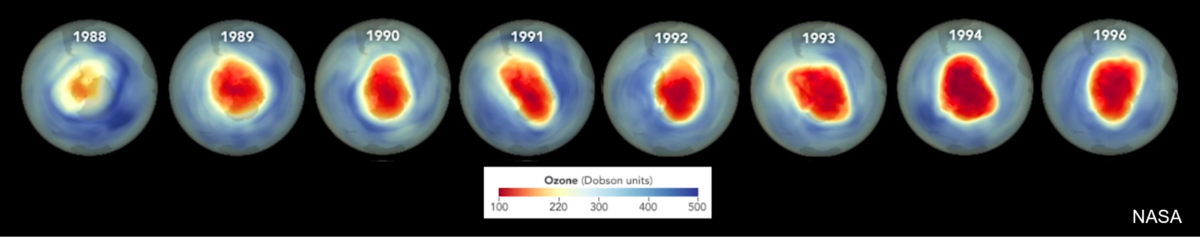
One way to see that the ozone hole could not be responsible for global warming is to consider and compare the trends of the size of the ozone hole and the Earth’s surface temperature over time. Figure 2 shows that the Antarctic ozone hole grew bigger in the 1980s and 1990s, and then began getting smaller in the 2000s. The ozone hole started shrinking because of the success of the Montreal Protocol, an international agreement made in 1987 that led to a ban of ozone-depleting substances. If the hypothesis of a bigger ozone hole leading to more ultraviolet light causing global warming were correct, then a smaller ozone hole would lead to less warming. But Figure 2 shows that global warming continued increasing even as the ozone hole got smaller. In fact, as of this writing (2021), the ten hottest years on record have all occurred since 2005, when the ozone hole was shrinking.
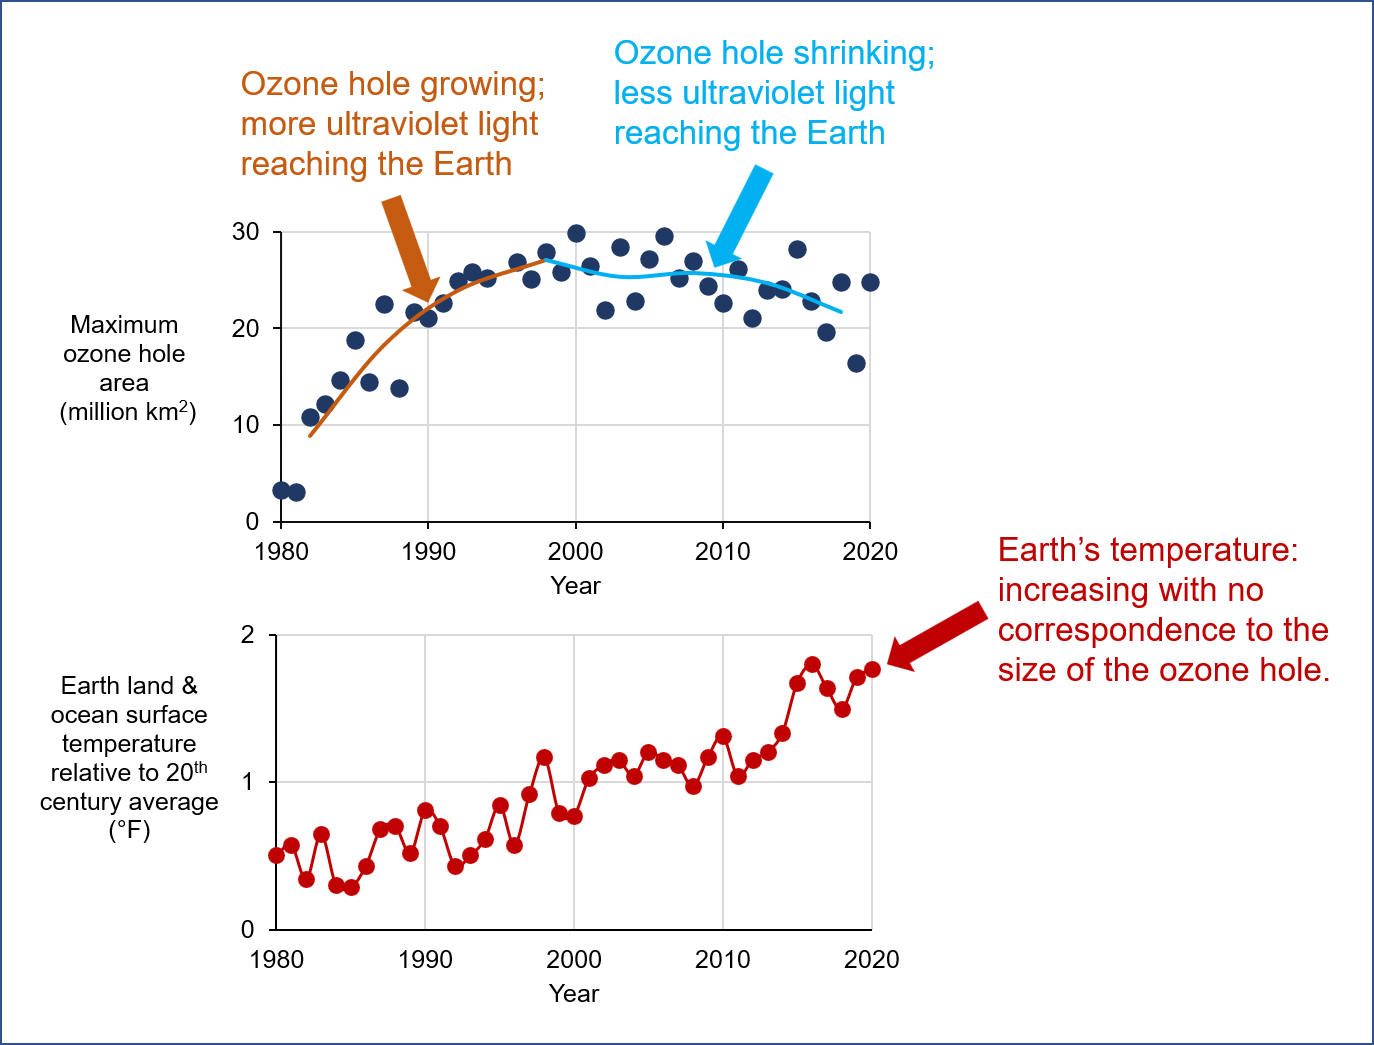
Figure 2: Comparison of trends in ozone hole size and Earth’s average surface temperature. Ozone hole data: NASA Ozone Watch. Temperature Data: NOAA National Centers for Environmental Information, Climate at a Glance. Figure by Ingrid Zabel for PRI's Earth@Home project (CC BY-NC-SA 4.0 license).
A bigger ozone hole does not cause global warming, but ozone is a greenhouse gas, so its presence has a warming effect. The main climate effect of a bigger ozone hole—that is, less ozone over Antarctica—has been to cool the stratosphere over Antarctica. This can affect large-scale wind patterns in the Southern Hemisphere, but it has not led to global warming. When it comes to greenhouse gases in the atmosphere, scientists are much more concerned about carbon dioxide than about stratospheric ozone.
Thank you to Jim Sommer (Schalmont High School) and Professor Suresh Dhaniyala (Clarkson University).
Learn More
Stratospheric ozone: https://www.epa.gov/ozone-layer-protection
NASA Ozone Hole Watch Program: https://ozonewatch.gsfc.nasa.gov/SH.html
Appendix: The Solar Spectrum
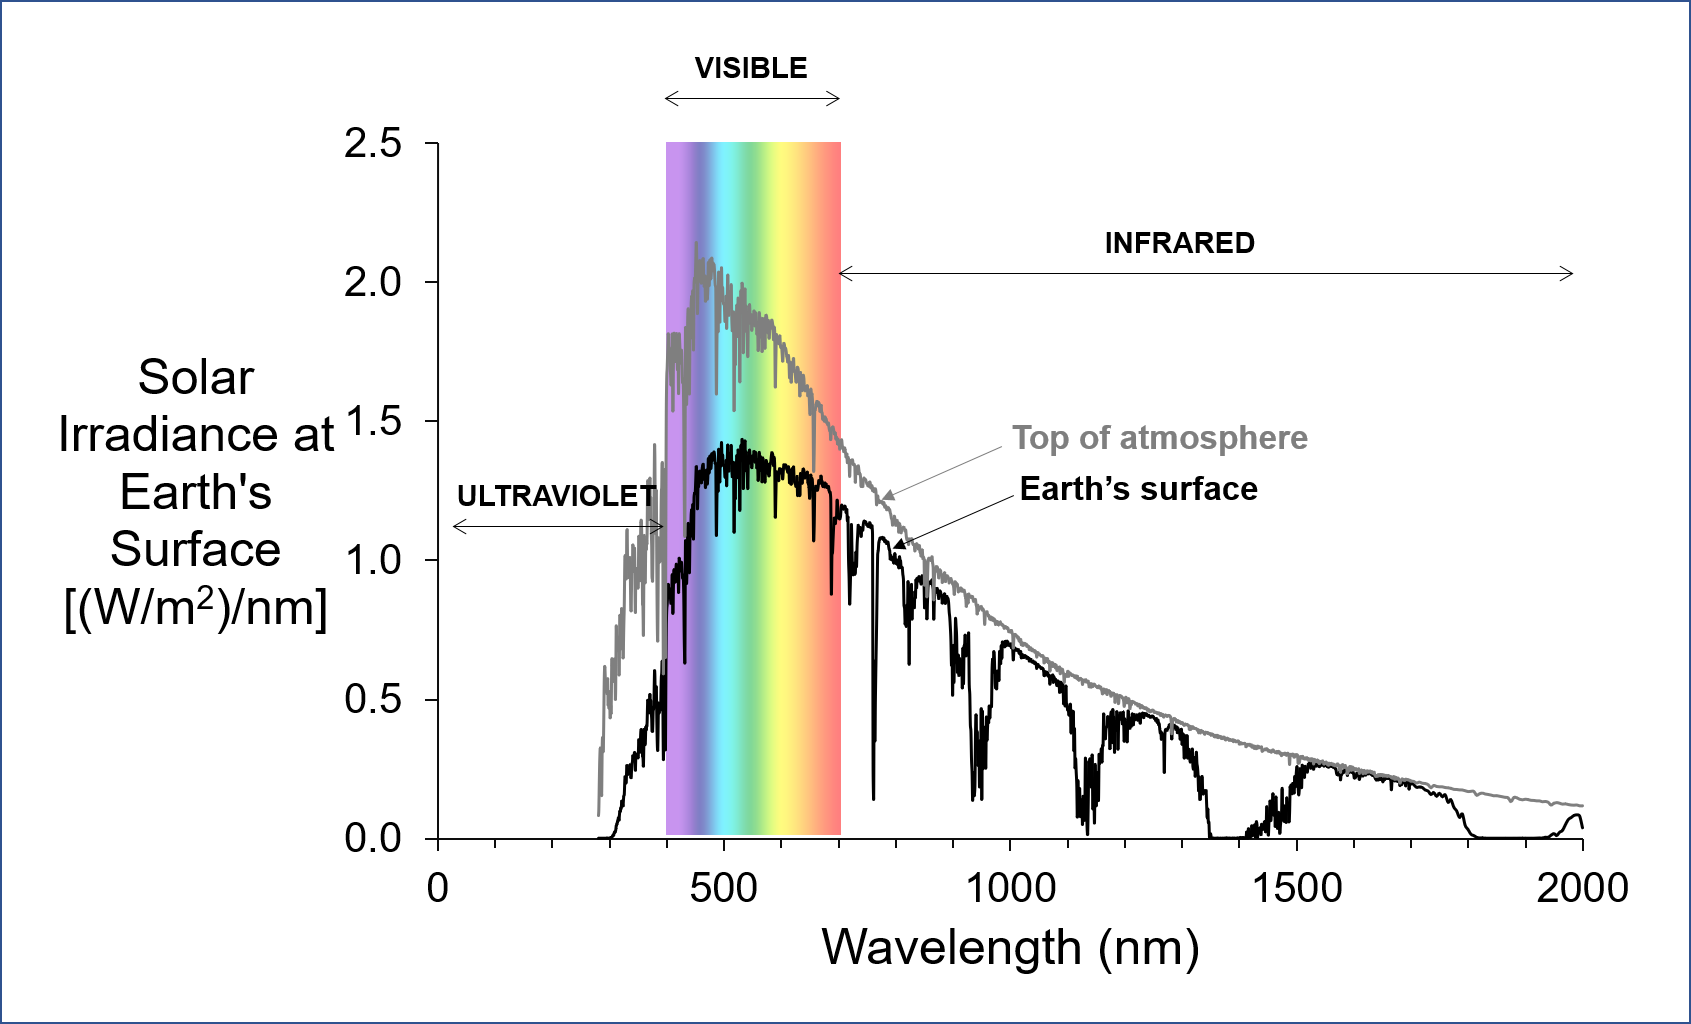
Figure 3: Spectrum of solar energy, at the top of the atmosphere (grey) and at the Earth’s surface, after passing through the atmosphere (black). Data from U.S. Department of Energy National Renewable Energy Laboratory. Figure by Ingrid Zabel for PRI's Earth@Home project (CC BY-NC-SA 4.0 license).
The Sun radiates different types of electromagnetic energy, including ultraviolet light, visible light, and infrared light. Figure 3 shows two spectra for sunlight—graphs of solar irradiance as a function of the wavelength of the sunlight. The grey curve shows the solar energy at the top of the Earth’s atmosphere, and the black curve shows the solar energy at the Earth’s surface, after passing through the atmosphere. We see that the black curve is lower overall than the grey curve, meaning that some energy is lost between the top of the atmosphere and the Earth’s surface. This is because some sunlight is reflected back out to space, and some is absorbed by gases in the atmosphere.
The area under the black curve represents the sunlight’s power per unit area at the Earth’s surface. One can see that the area under the curve in the ultraviolet portion of the spectrum is much smaller than the area under the curve in the visible or infrared portions of the spectrum. This is mainly because the Sun radiates visible light most strongly, but partly because ozone in the stratosphere absorbs a lot of ultraviolet light, preventing it from reaching the Earth.
Learn More
The solar spectrum: https://www.e-education.psu.edu/meteo300/node/683
What color is the Sun? http://solar-center.stanford.edu/SID/activities/GreenSun.html