

Page snapshot: Introduction to the climate of the south-central United States, including present, past, and future climate.
Topics covered on this page: Present climate of the south-central U.S.; Present temperature; Present Precipitation; Severe Weather; Regional climate variation; Past climate of the south-central U.S.; Paleozoic; Mesozoic; Cenozoic; Future climate of the south-central U.S.; Resources.
Credits: Most of the text of this page is derived from "Climate of the South Central US" by Richard A. Kissel and Judith T. Parrish, chapter 9 in The Teacher-Friendly Guide to the Earth Science of the South Central US, edited by Mark D. Lucas, Robert M. Ross, and Andrielle N. Swaby (published in 2015 by the Paleontological Research Institution; currently out of print). The book was adapted for the web by Elizabeth J. Hermsen and Jonathan R. Hendricks in 2021–2022. Changes include formatting and revisions to the text and images. Credits for individual images are given in figure captions.
Updates: Page last updated May 26, 2022.
Image above: A thunderstorm in Oklahoma, February 7, 2011. Photo by Sean Waugh, NOAA/NSSL (flickr, Creative Commons Attribution 2.0 Generic license, image cropped and resized).
Present climate of the south-central U.S.
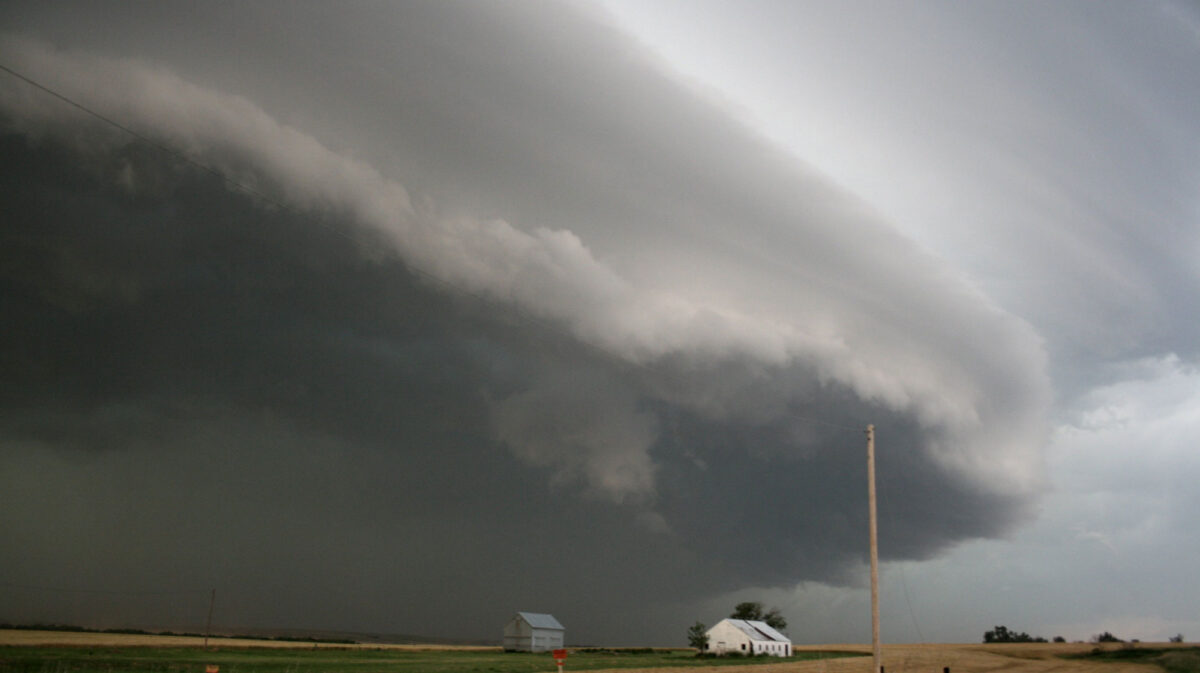
The location of the south-central U.S. and its direct relationship to the Gulf of Mexico strongly influence the area’s weather. Since it encompasses locations along the coast as well as areas farther inland, the south-central U.S. experiences nearly every variety of extreme weather. Heat waves and cold snaps, droughts, floods, blizzards, tornados, and hurricanes are all considerations for the residents of the south-central states. Average temperatures in the south-central U.S. tend to decrease northward, which is simply the influence of latitude: lower latitudes receive more heat from the sun over the course of a year.
Temperature
The warmest temperatures are found in Louisiana and Texas, and the coolest found in Missouri and Kansas. The south-central states' overall average high temperature of 20°C (68°F) and average low of 9°C (49°F) are indicative, on the whole, of a more uniform climate than that found in most other regions of the United States. By comparison, the average high and low temperatures for the entire United States are 17ºC (63ºF) and 5°C (41°F), respectively.
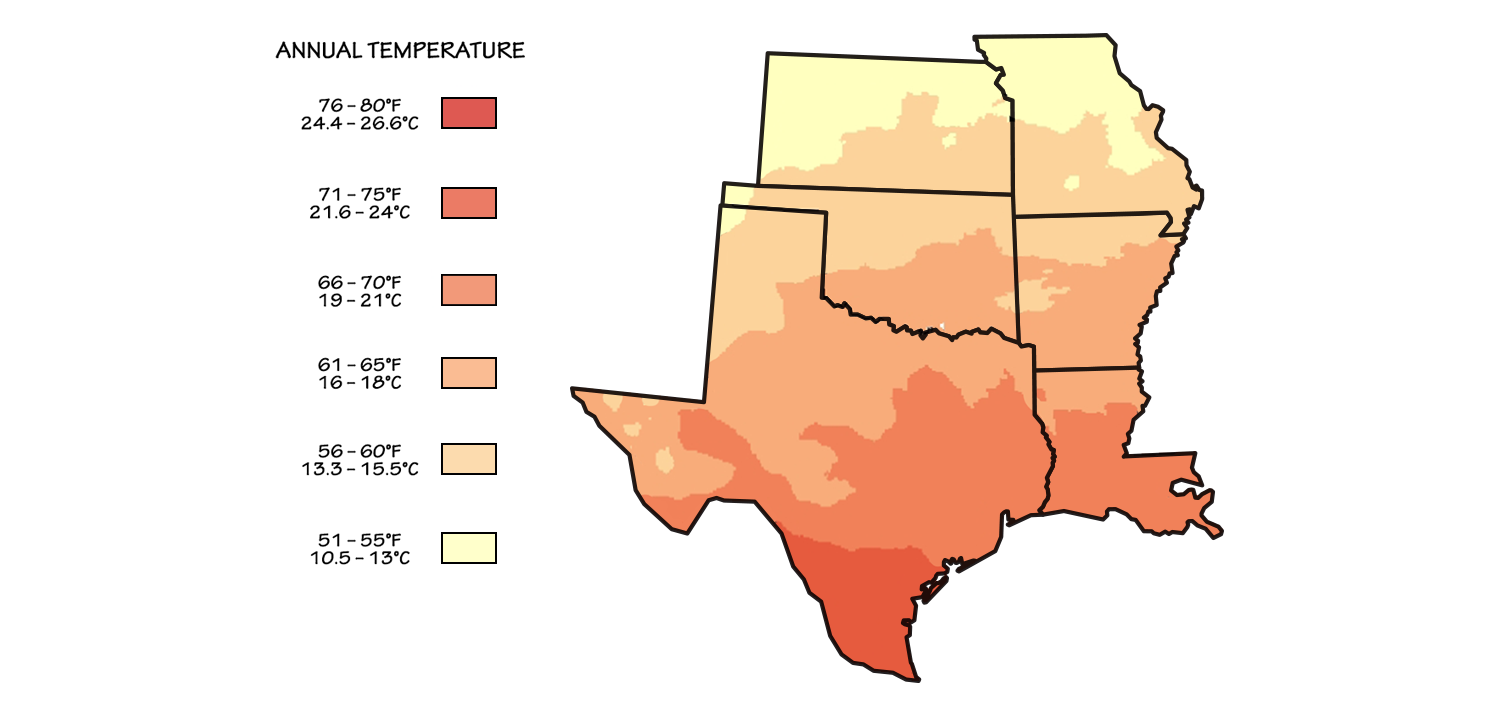
Average annual temperatures for the south-central U.S. Image adapted from an image by Scenarios for Climate Assessment and Adaptation, first published in The Teacher-Friendly Guide to the Earth Science of the South Central US.
Another factor besides latitude that influences temperature in the south-central U.S. is proximity to the ocean, which has a moderating influence: air masses that have passed the Gulf of Mexico rarely get either extremely hot or extremely cold. Thus, the most extreme temperatures in the south-central U.S. are found toward the center of the continent. Record high and low temperatures are both held by Kansas, which has experienced a high of 49ºC (121°F) and a low of -40°C (-40°F).
Average Annual Temperatures in the South-central United States
| Louisiana | 19.2°C (66.6°F) | 13.2°C (55.7°F) | 22.1°C (71.8°F) |
| Texas | 18.7°C (65.6°F) | 11.8°C (53.3°F) | 23.2°C (73.7°F) |
| Arkansas | 15.8°C (60.5°F) | 9.6°C (49.3°F) | 22.1°C (71.8°F) |
| Oklahoma | 15.7°C (60.2°F) | 8.8°C (47.8°F) | 20.9°C (69.6°F) |
| Missouri | 12.8°C (55.0°F) | 6.5°C (43.7°F) | 17.3°C (63.2°F) |
| Kansas | 12.6°C (54.7°F) | 5.6°C (42.1°F) | 16.7°C (62.1°F) |
Precipitation
The average amount of precipitation for the United States is 85.6 centimeters (33.7 inches). In the south-central states, however, average precipitation ranges from 146.3 centimeters (57.6 inches) in Louisiana to 74.4 centimeters (29.3 inches) in Kansas, demonstrating the impact of moisture carried inland from the adjacent Gulf of Mexico.
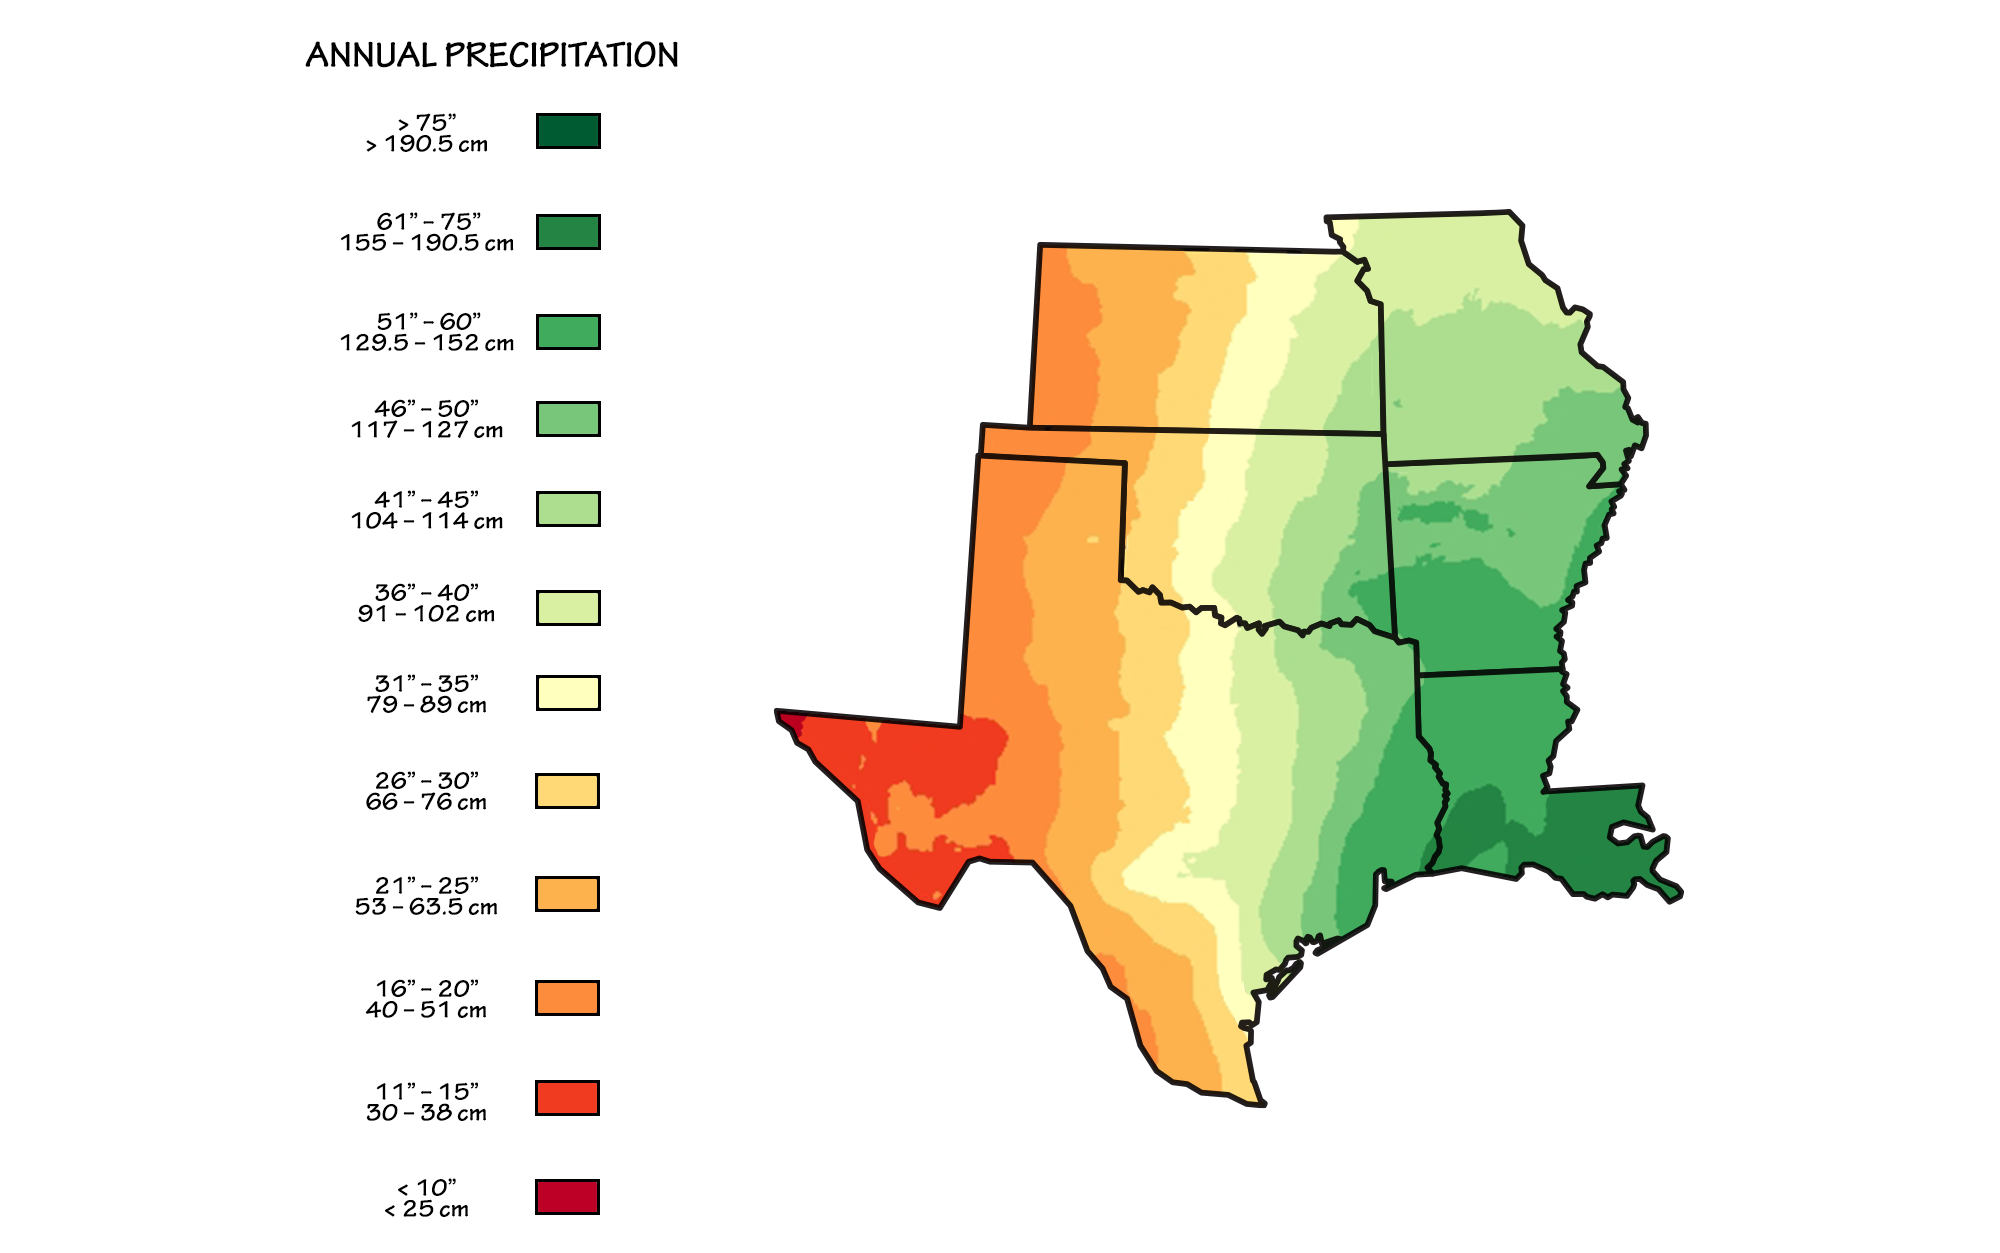
Average annual preciptiation for the south-central U.S. Image adapted from an image by Scenarios for Climate Assessment and Adaptation, first published in The Teacher-Friendly Guide to the Earth Science of the South Central US.
Severe Weather
Hurricanes
In the summer and fall tropical cyclones (hurricanes) often bring heavy rains to the Gulf and Atlantic coasts. Some of these cyclones, such as Hurricane Katrina in 2005, are extremely powerful and have devastated communities in the south-central states, particularly Louisiana and Texas. Five-hundred-year or thousand-year weather events, referring to a 1-in-500 or 1-in-1000 chance of an event of a given intensity happening in a given year, have increased in frequency in recent years; climate models predict a continuation of that increase. One such event occurred in August 2017, when the heavy rains of Hurricane Harvey brought nearly 61 centimeters (about 24 inches) of rain to Houston, Texas, over the course of two days, causing widespread flooding.
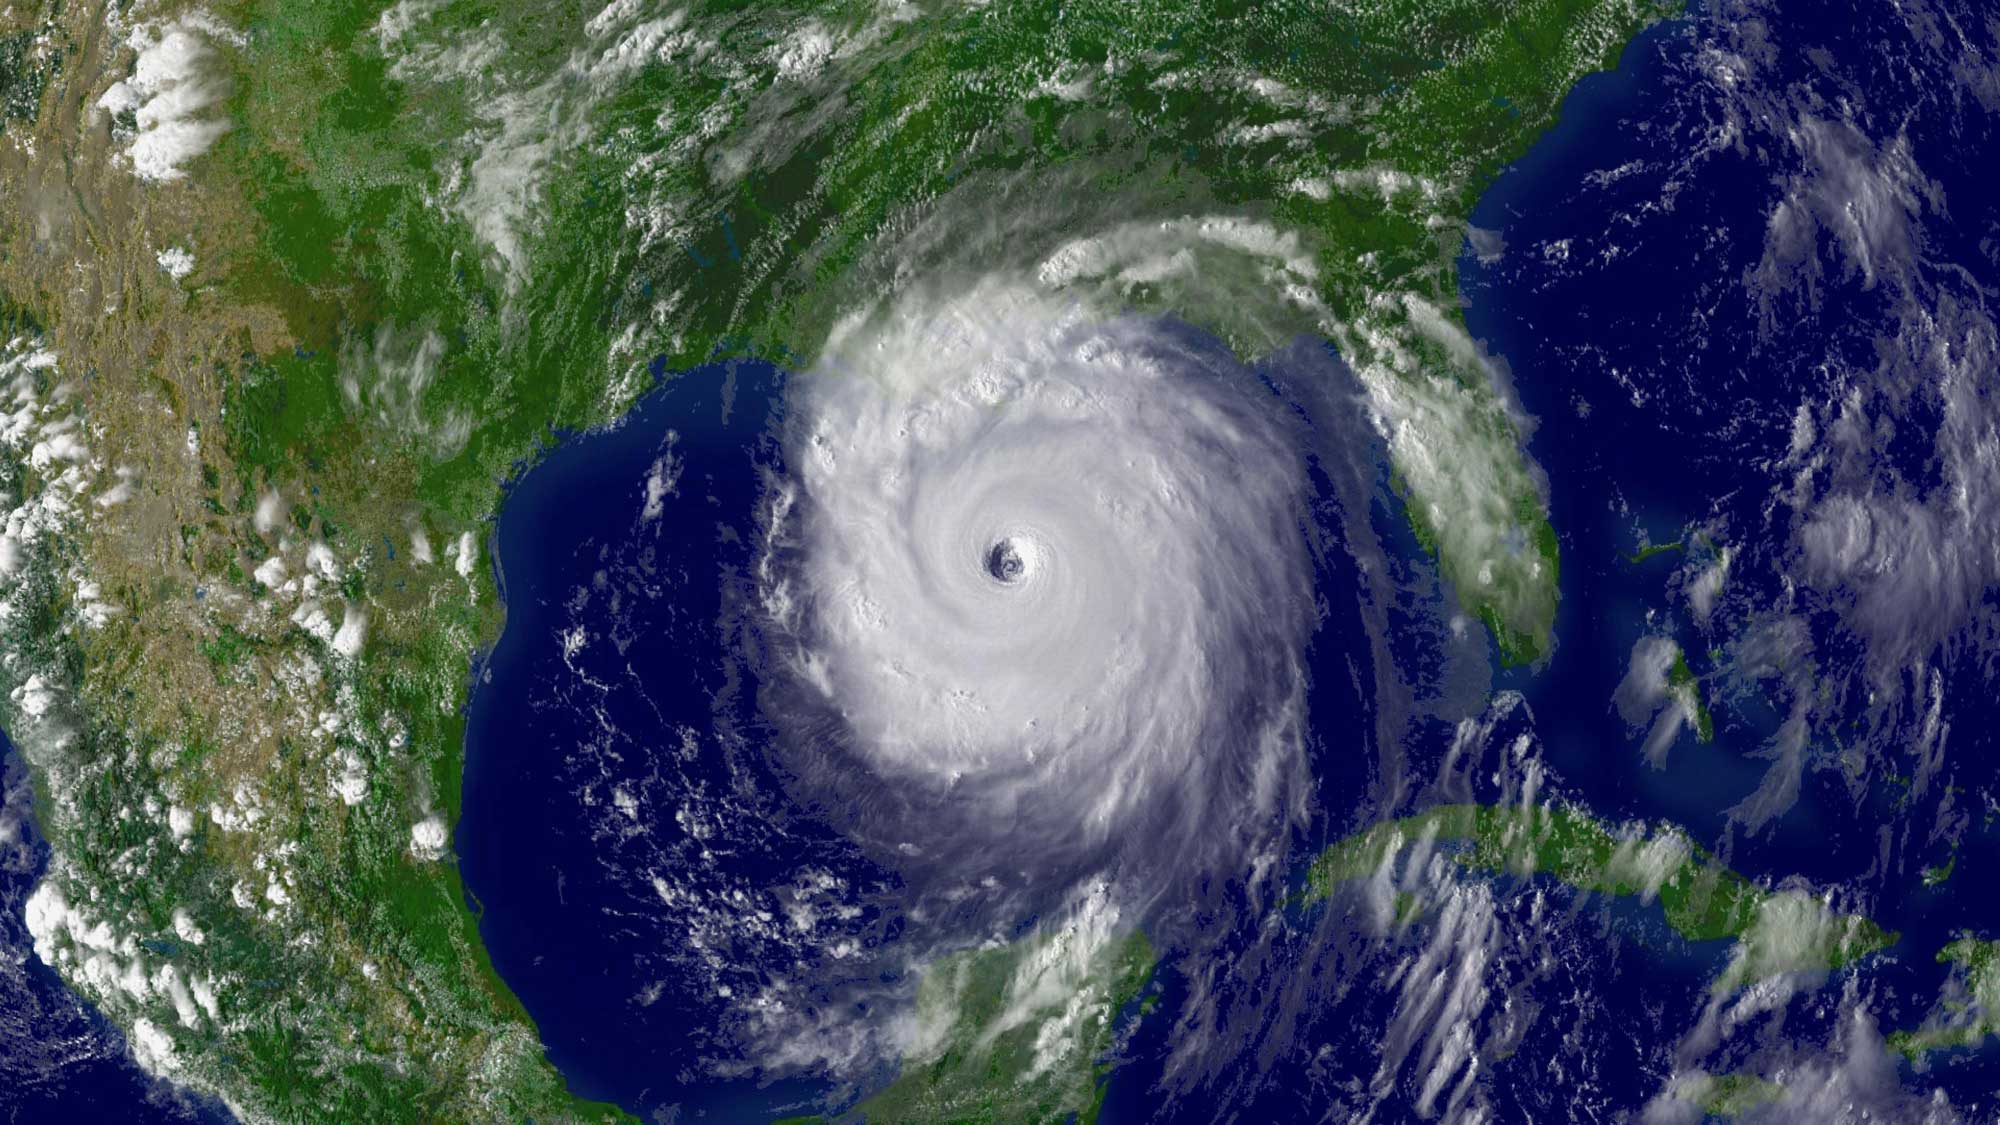
Satellite image of Hurricane Katrina as it approached the Louisiana coastline in 2005. Image by NOAA (public domain).
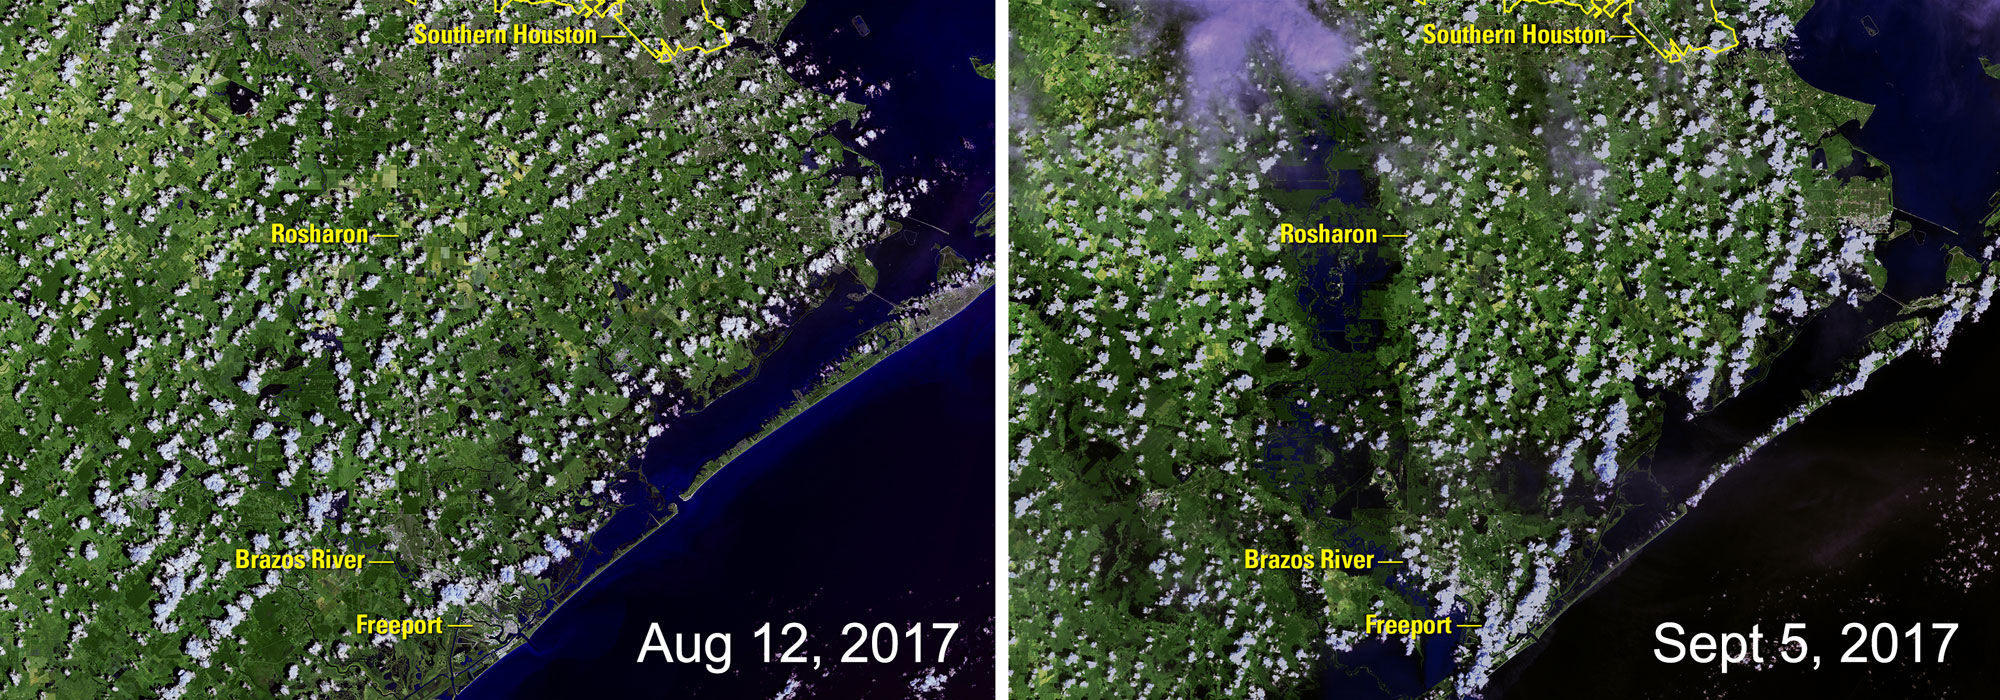
The area south of Houston, Texas, before (August 12, 2017) and after (September 5, 2017) Hurricane Harvey showing the extent of flooding caused by rainfall from the storm. Photographs by USGS EROS (public domain).
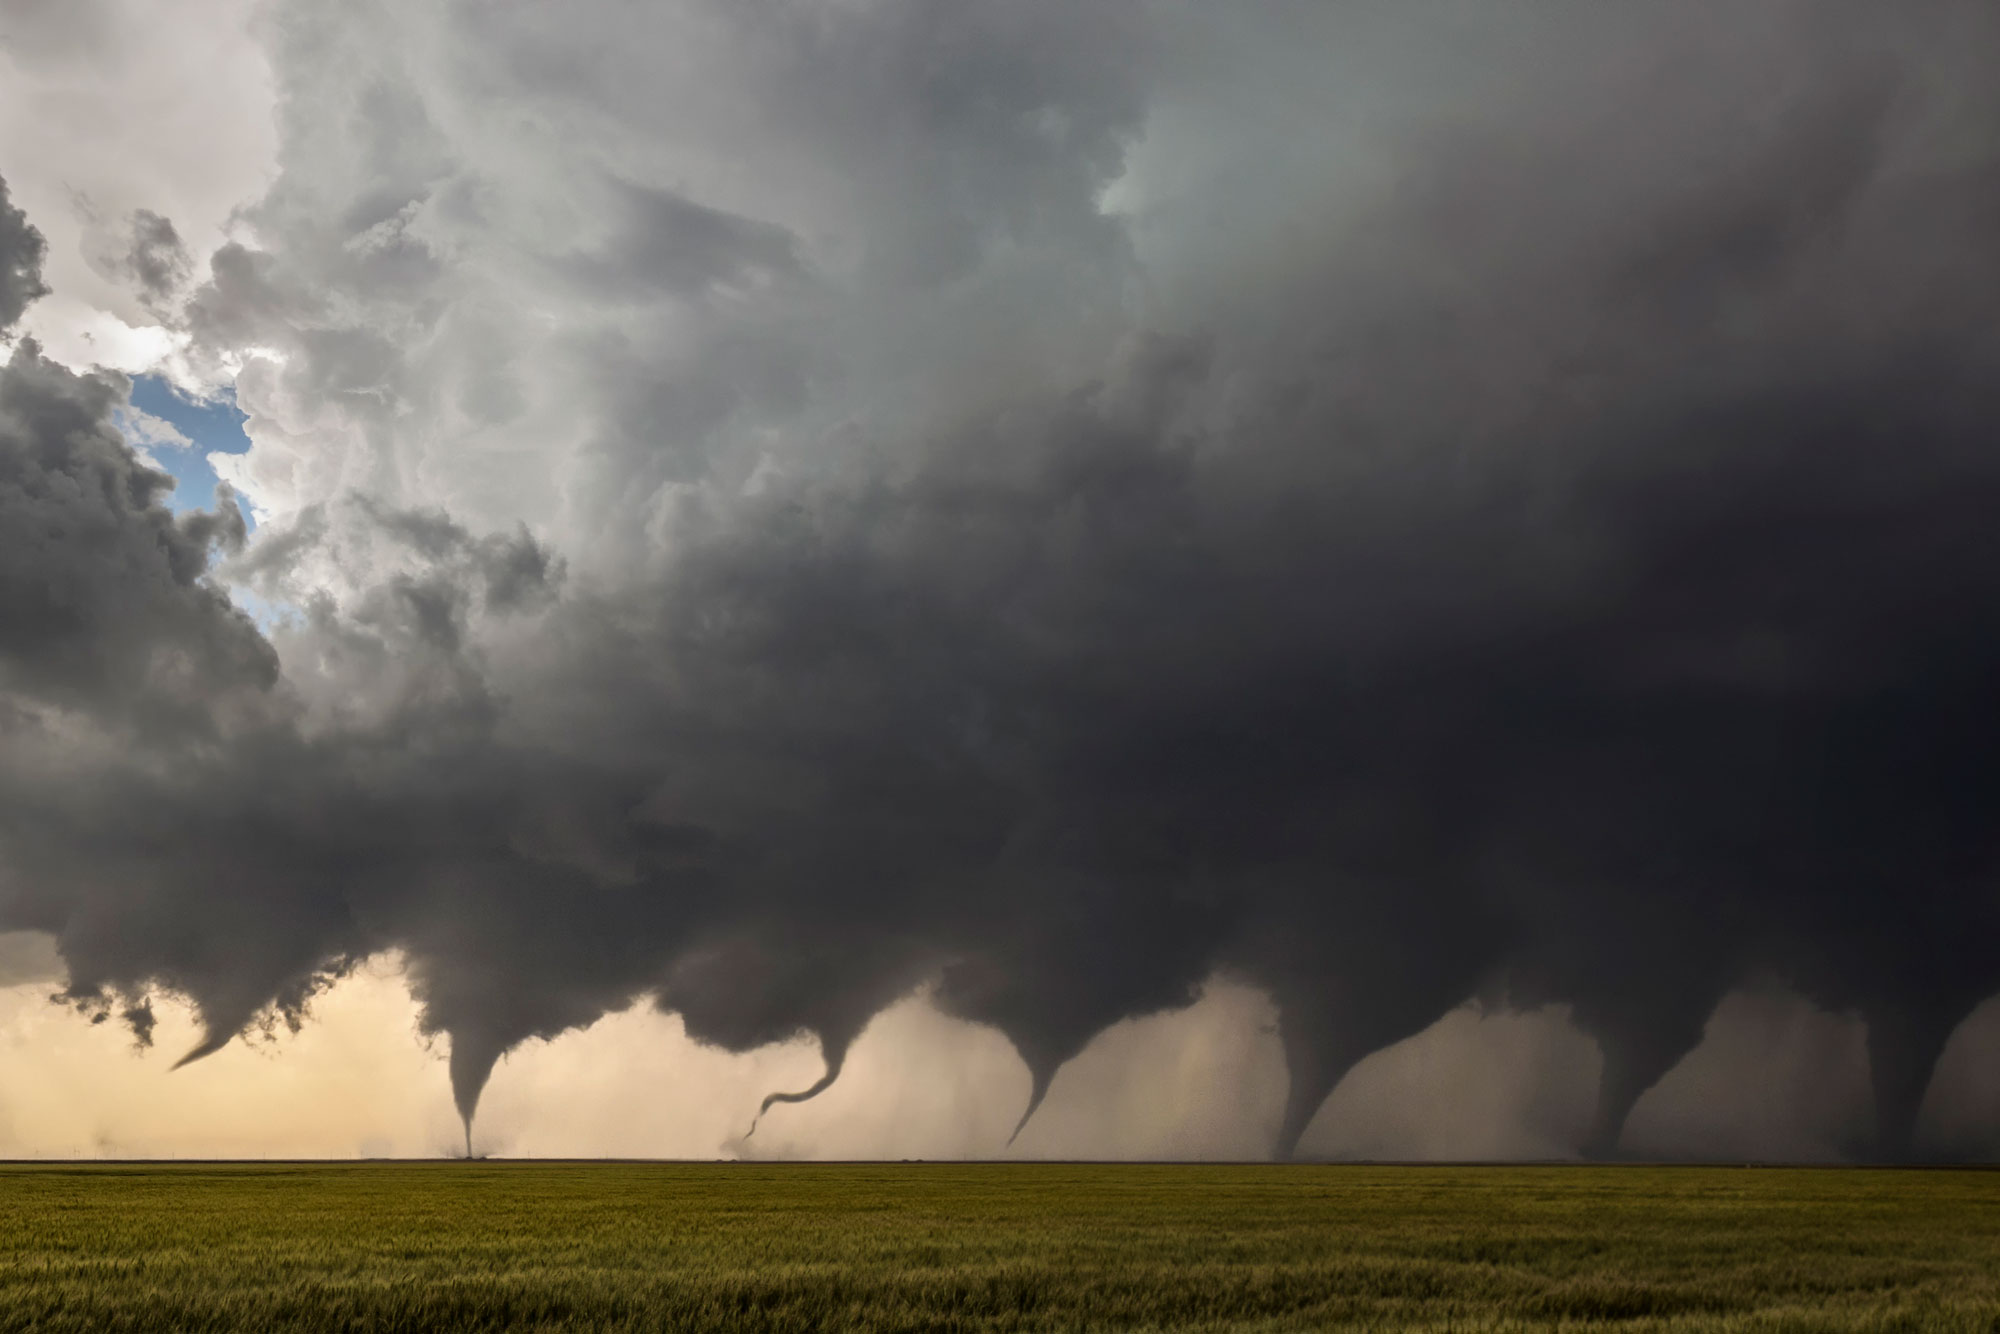
Thunderstorms and tornados
The geography and climate of the south-central U.S. are nearly ideal for their formation of thunderstorms and tornados, especially in the summer.
Storms form when there is strong convection in the atmosphere. Convection occurs when buoyant warm air rises (moves up) while denser cool air sinks (moves down). Convective mixing forces the moisture in warm air to condense as it comes into contact with cool air, forming vapor (clouds) and precipitation (for example, rain or hail). A strong difference in air temperature at different heights creates instability; the warmer the air near the surface is relative to the air above it, the more potential (stored) energy the warm air has to move up, and the more potential for a storm. The final ingredient is wind. Wind moves the air, promoting mixing. The formation of precipitation also causes electrical charging of particles in the atmosphere, which in turn produces lightning.
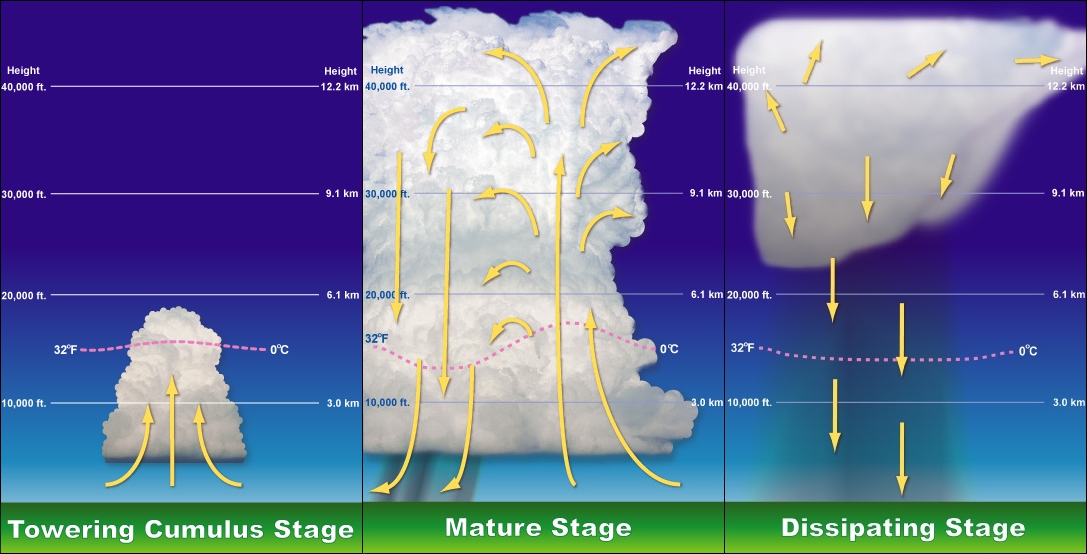
Stages in the formation of a thunderstorm. Left: Warm air rises. Moisture condenses out of the warm air as it comes into contact with cool air, forming clouds. Center: As warm air rises, cool air sinks. Precipitation forms. Right: As the vertical column of air turns over, with warm air at the top and cool air at the bottom, the storm begins to dissipate. Image by The High Fin Sperm Whale, created from images by NOAA National Weather Service training material (Wikimedia Commons, public domain).
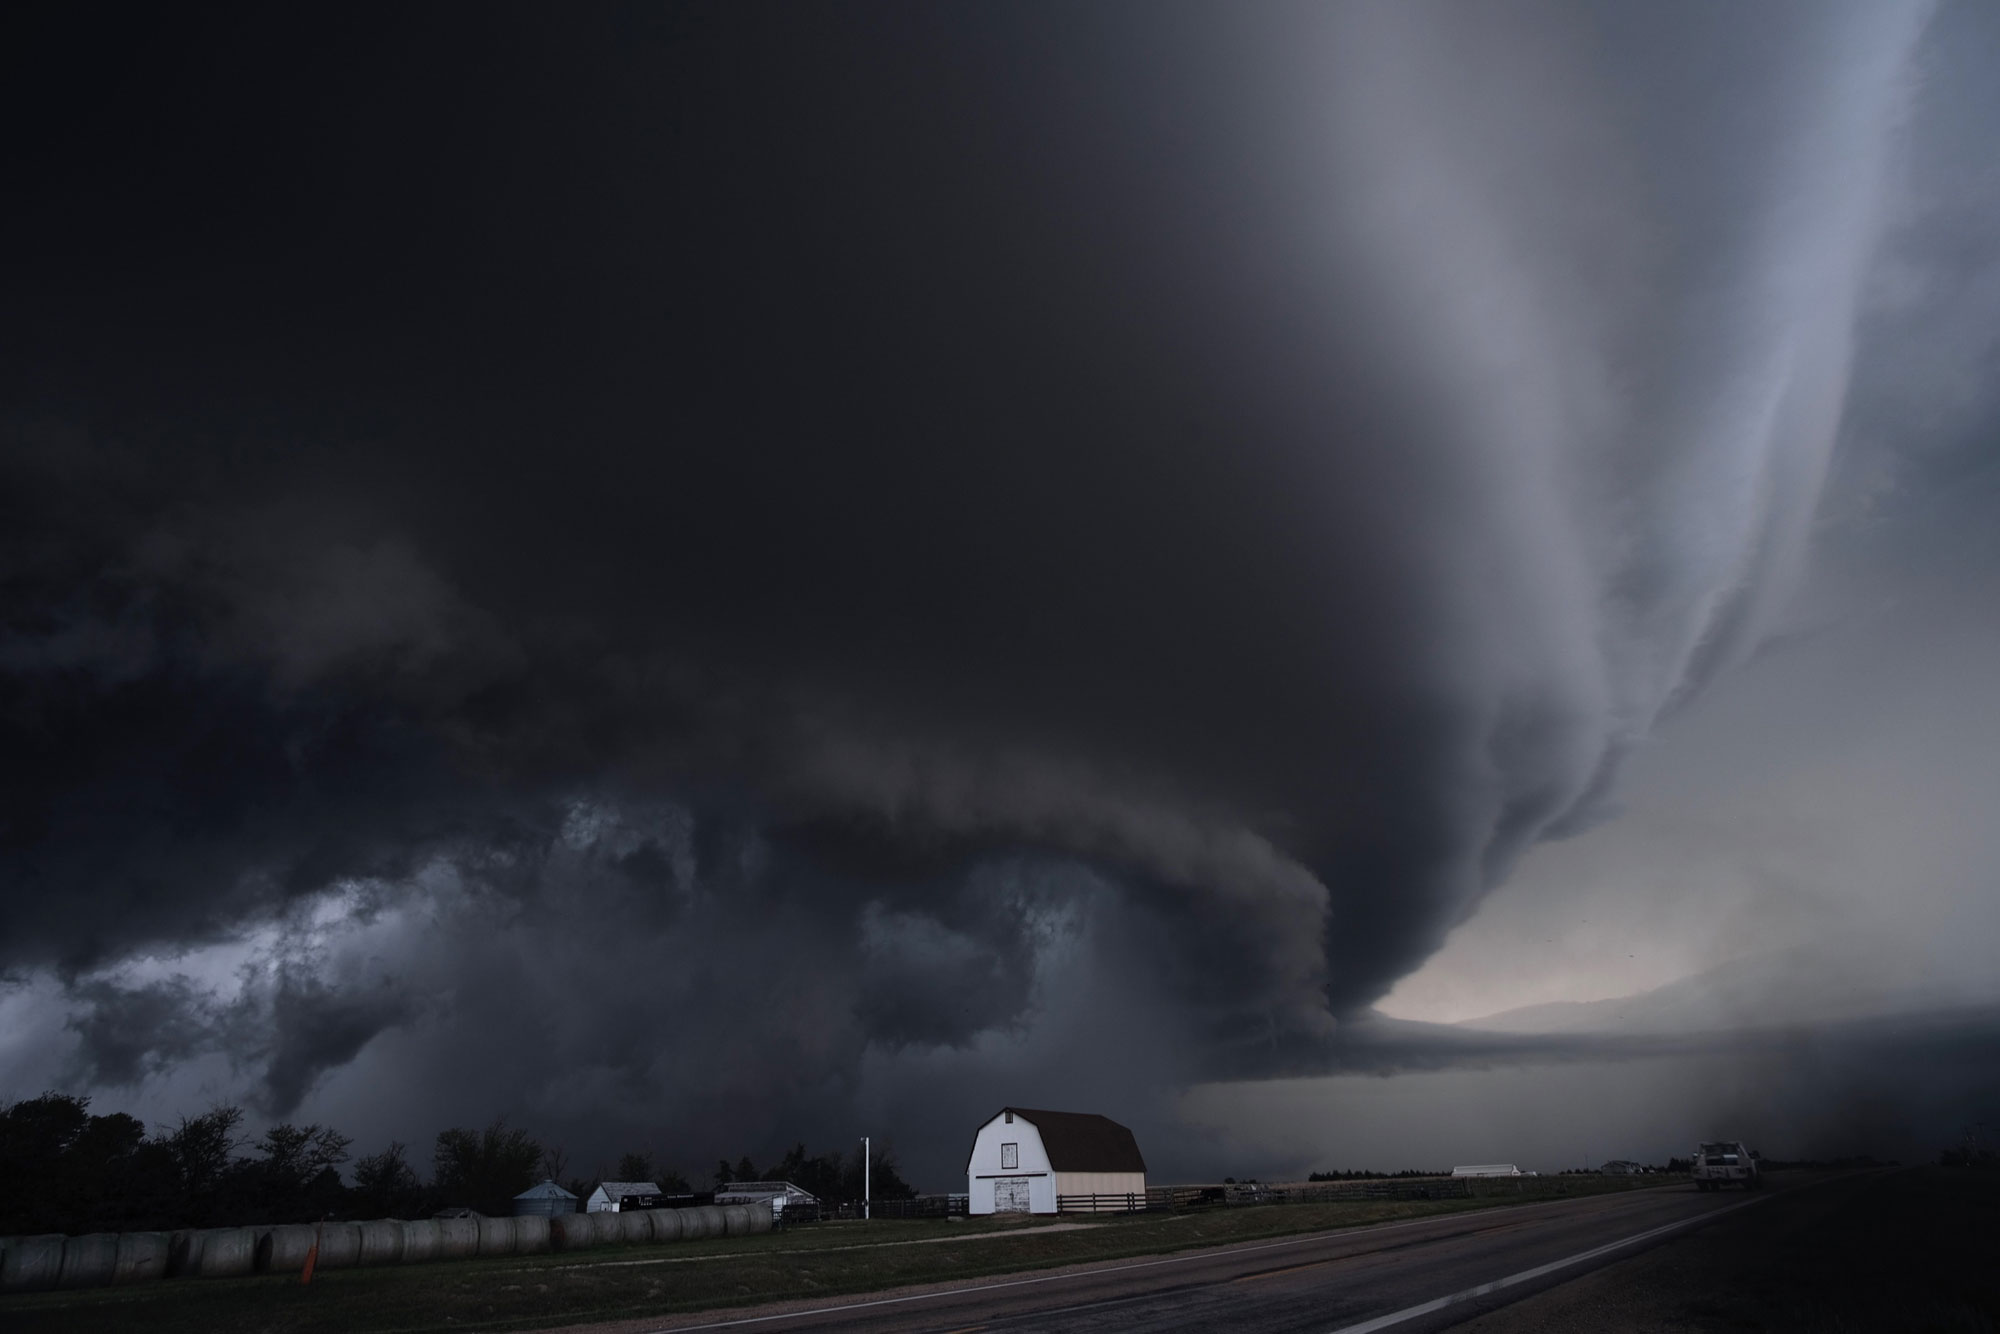
Original caption: "A supercell thunderstorm in Kansas." May 27, 2019. Photo by Mike Coniglio, NOAA NSSL (flickr, public domain).
Typically, a storm blows itself out once the warm air has moved up and the cool air has moved down. Convective mixing stops because the vertical column of air has turned over so that the cool air is at the bottom and the warm air is at the top. The directions of air currents in the south-central U.S., however, promote mixing. The south-central U.S. receives warm, moist air from the Gulf of Mexico, and cold, dry air from the Rocky Mountains and the northern U.S. The warmer, lower air from the Gulf is moving north, constantly adding more heat and moisture. The colder, higher air is moving west. Where these air masses meet, vigorous mixing causes storms. The inputs of warm, dry air from the Gulf of Mexico allow these storms to persist and strengthen. This movement in different directions is also the reason for the south-central states' unusually high incidence of powerful tornados. A large swath of the south-central U.S. is part of an area with frequent tornados known as "Tornado Alley."
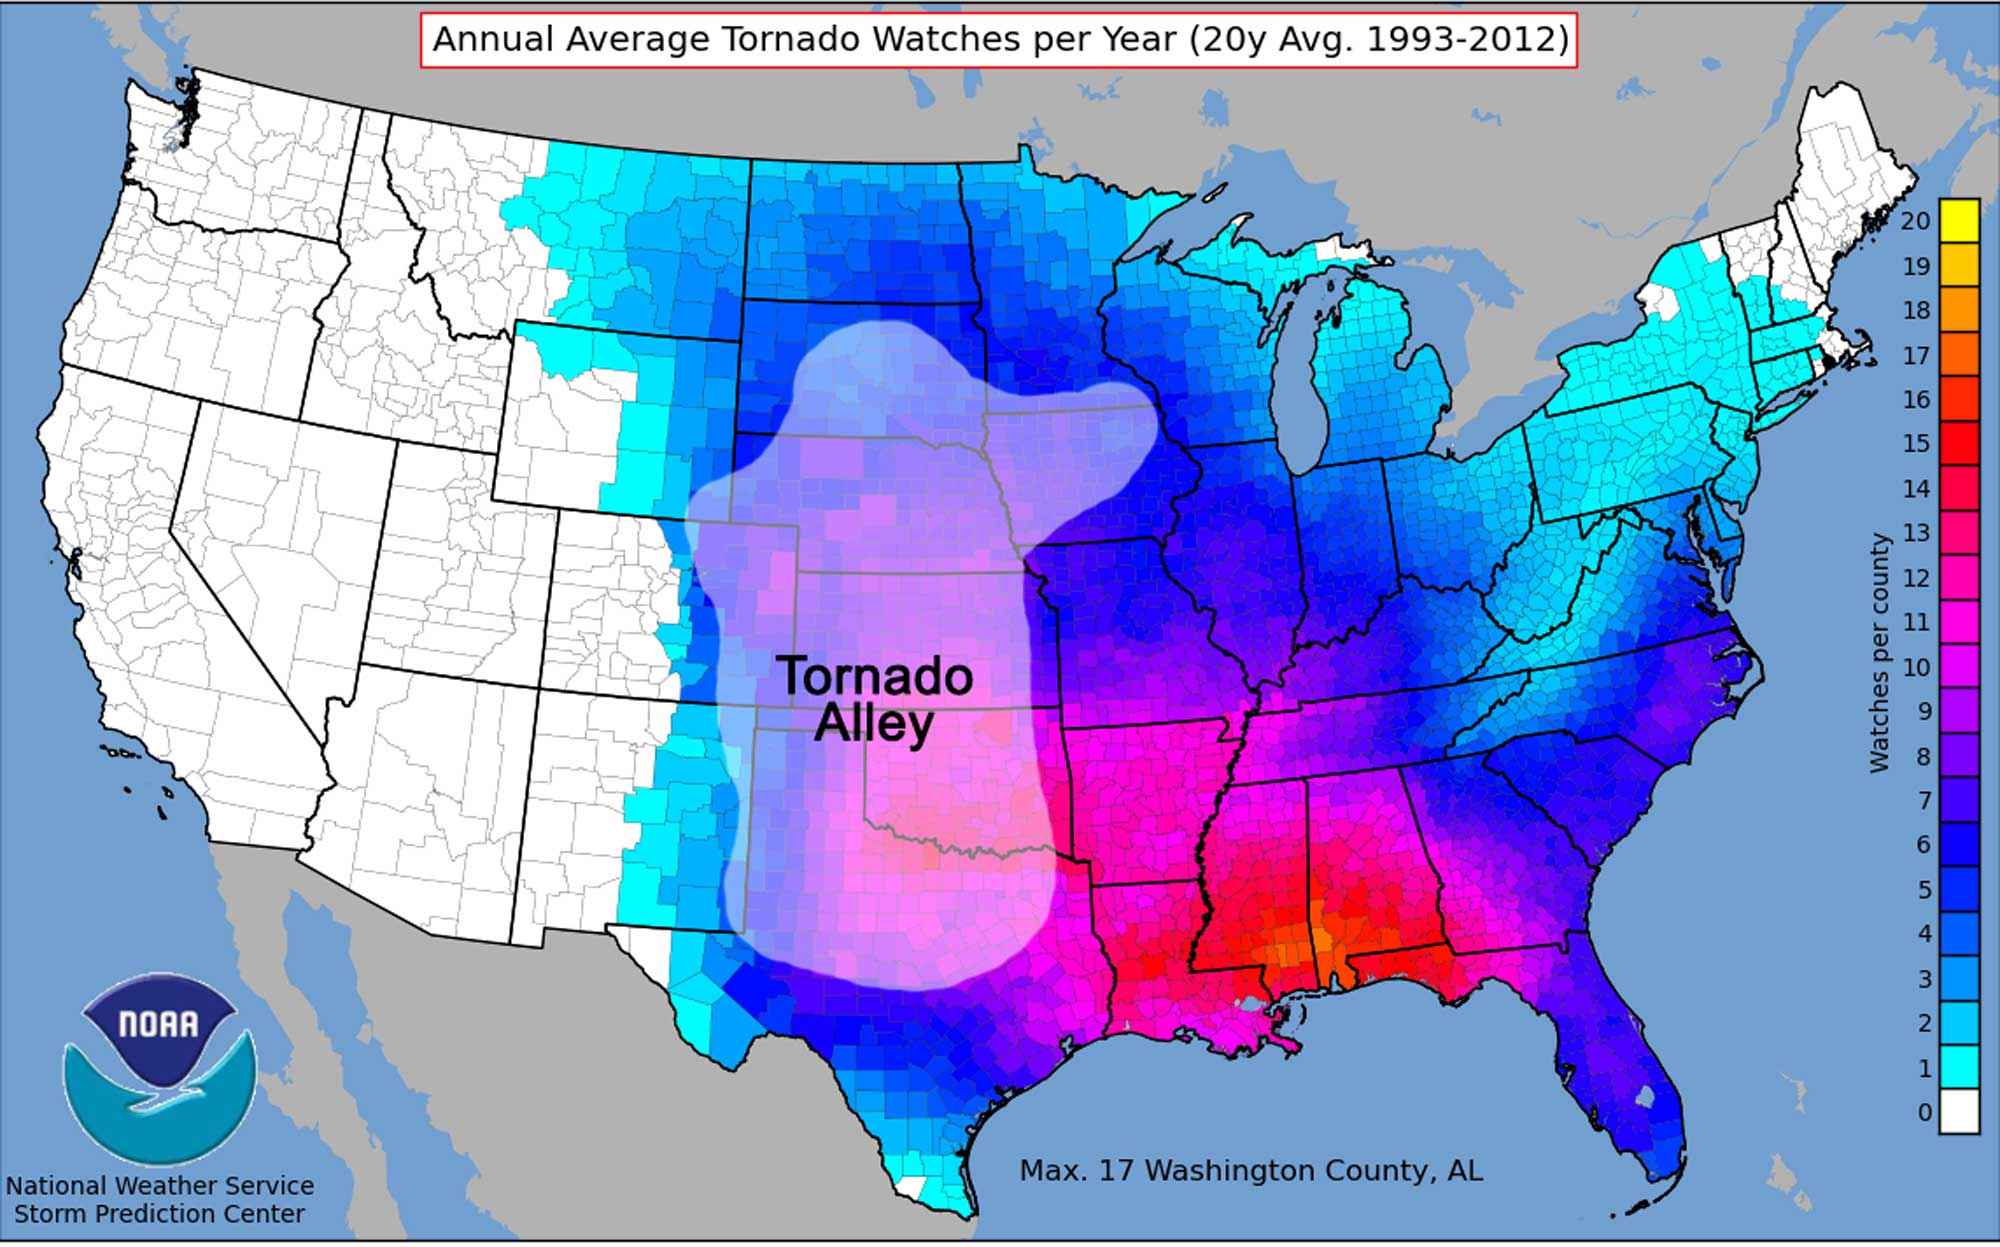
Average yearly tornado watches in each county of the United States between 1993 and 2012. Tornado Alley is identified. Map by NOAA (public domain) modified for the Earth@Home project.
Photomontage showing the formation and touch-down of a tornado north of Minneola, Kansas, on May 24, 2016. Photomontage by JasonWeingart (Wikimedia Commons, Creative Commons Attribution-ShareAlike 4.0 International license, image resized).
Regional climate variation
Today, the south-central U.S. lies at the intersection of several distinct climate zones, with much of the region characterized as warm temperate. Northern Missouri and northern Kansas are characterized as continental, and the western parts of Kansas and Texas are semi-arid.
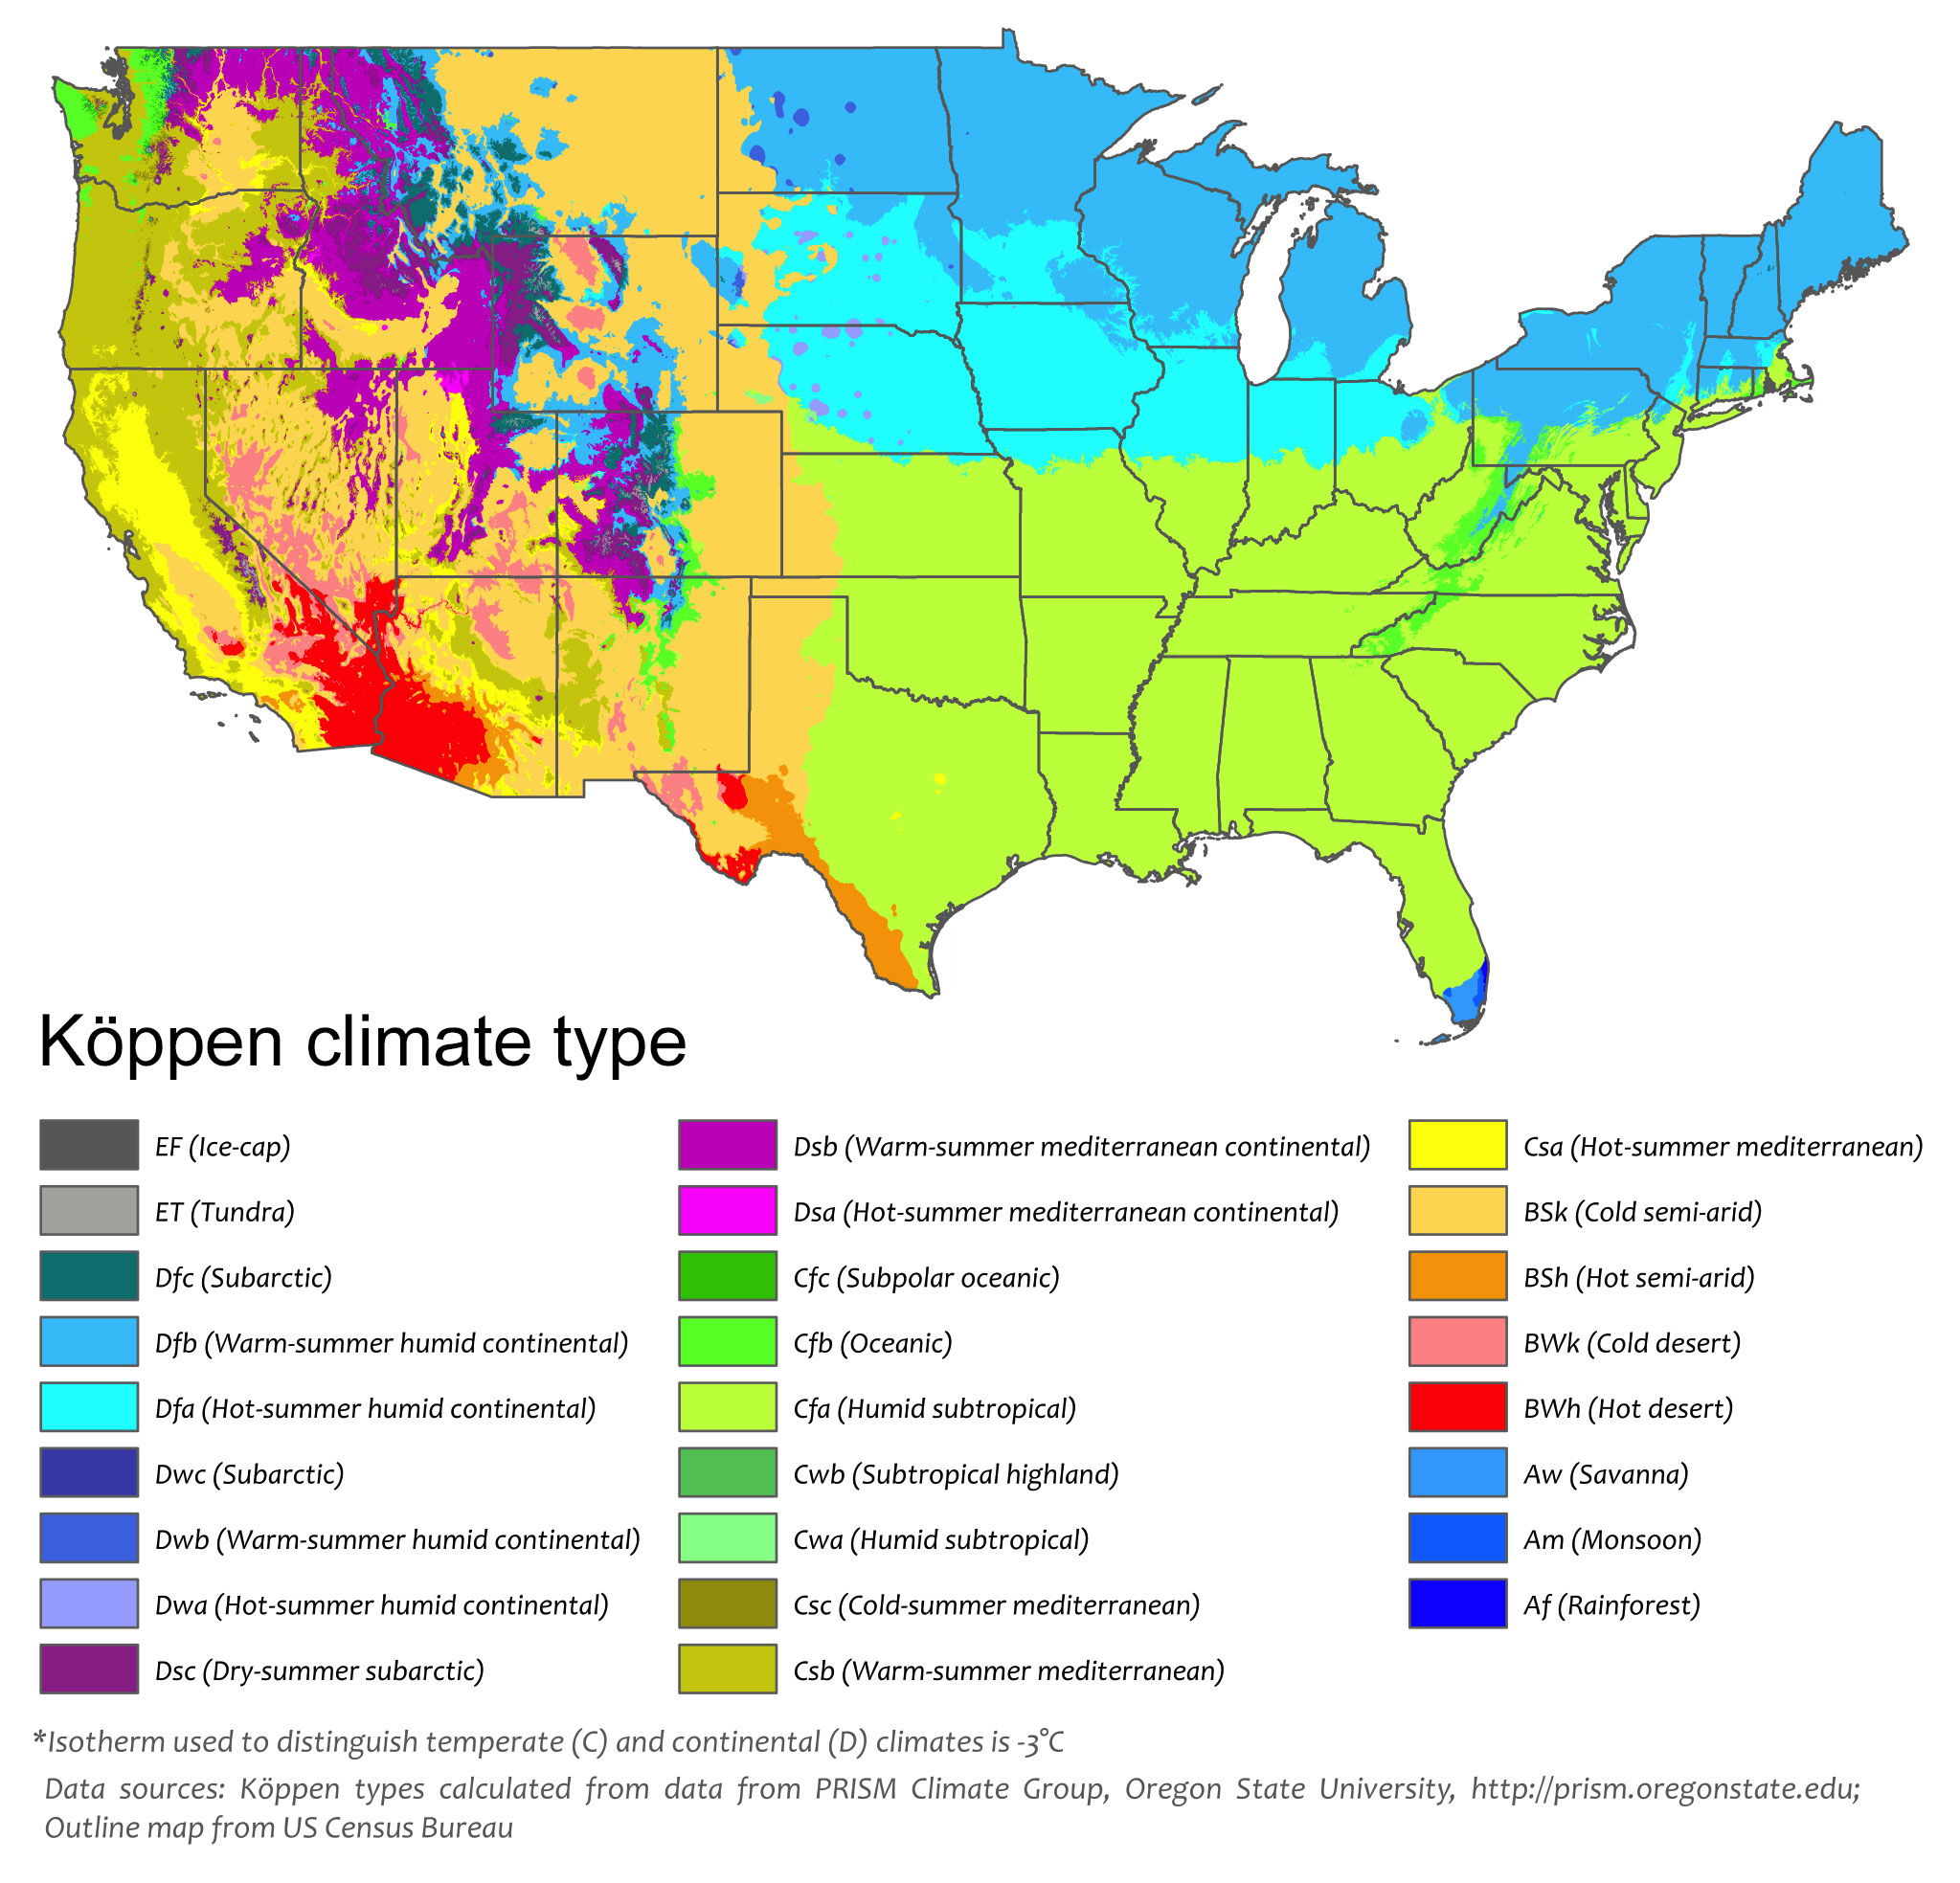
Köppen climate map of the 48 contiguous states of the continental United States. The first letter of each zone in the key indicates its major classification. A = Tropical (equatorial), B = Arid, C = Temperate (warm temperate), D = Continental (cold), E = polar. Modified from a map by Adam Peterson (Wikimedia Commons, Creative Commons Attribution-ShareAlike 4.0 International license).
Arkansas
Arkansas’ climate is influenced by its topography as well as its relative proximity to the Gulf of Mexico. The state’s winters are short, while its summers are hot and humid with heavy precipitation. Arkansas is often subject to heavy rainfall from the remnants of tropical storms that arrive from the Gulf. The state is known for its extreme weather and abundant storms, including thunderstorms and tornados.
The Ouachita Mountains, running northeast through southern Arkansas, are high enough to influence the state’s climate as well. Due to a minor rain shadow effect, the land north of the mountain chain is drier than that to the south, as the mountains block northward-moving precipitation. Snow does fall in the winters, but it is primarily restricted to the northwestern section of the state.
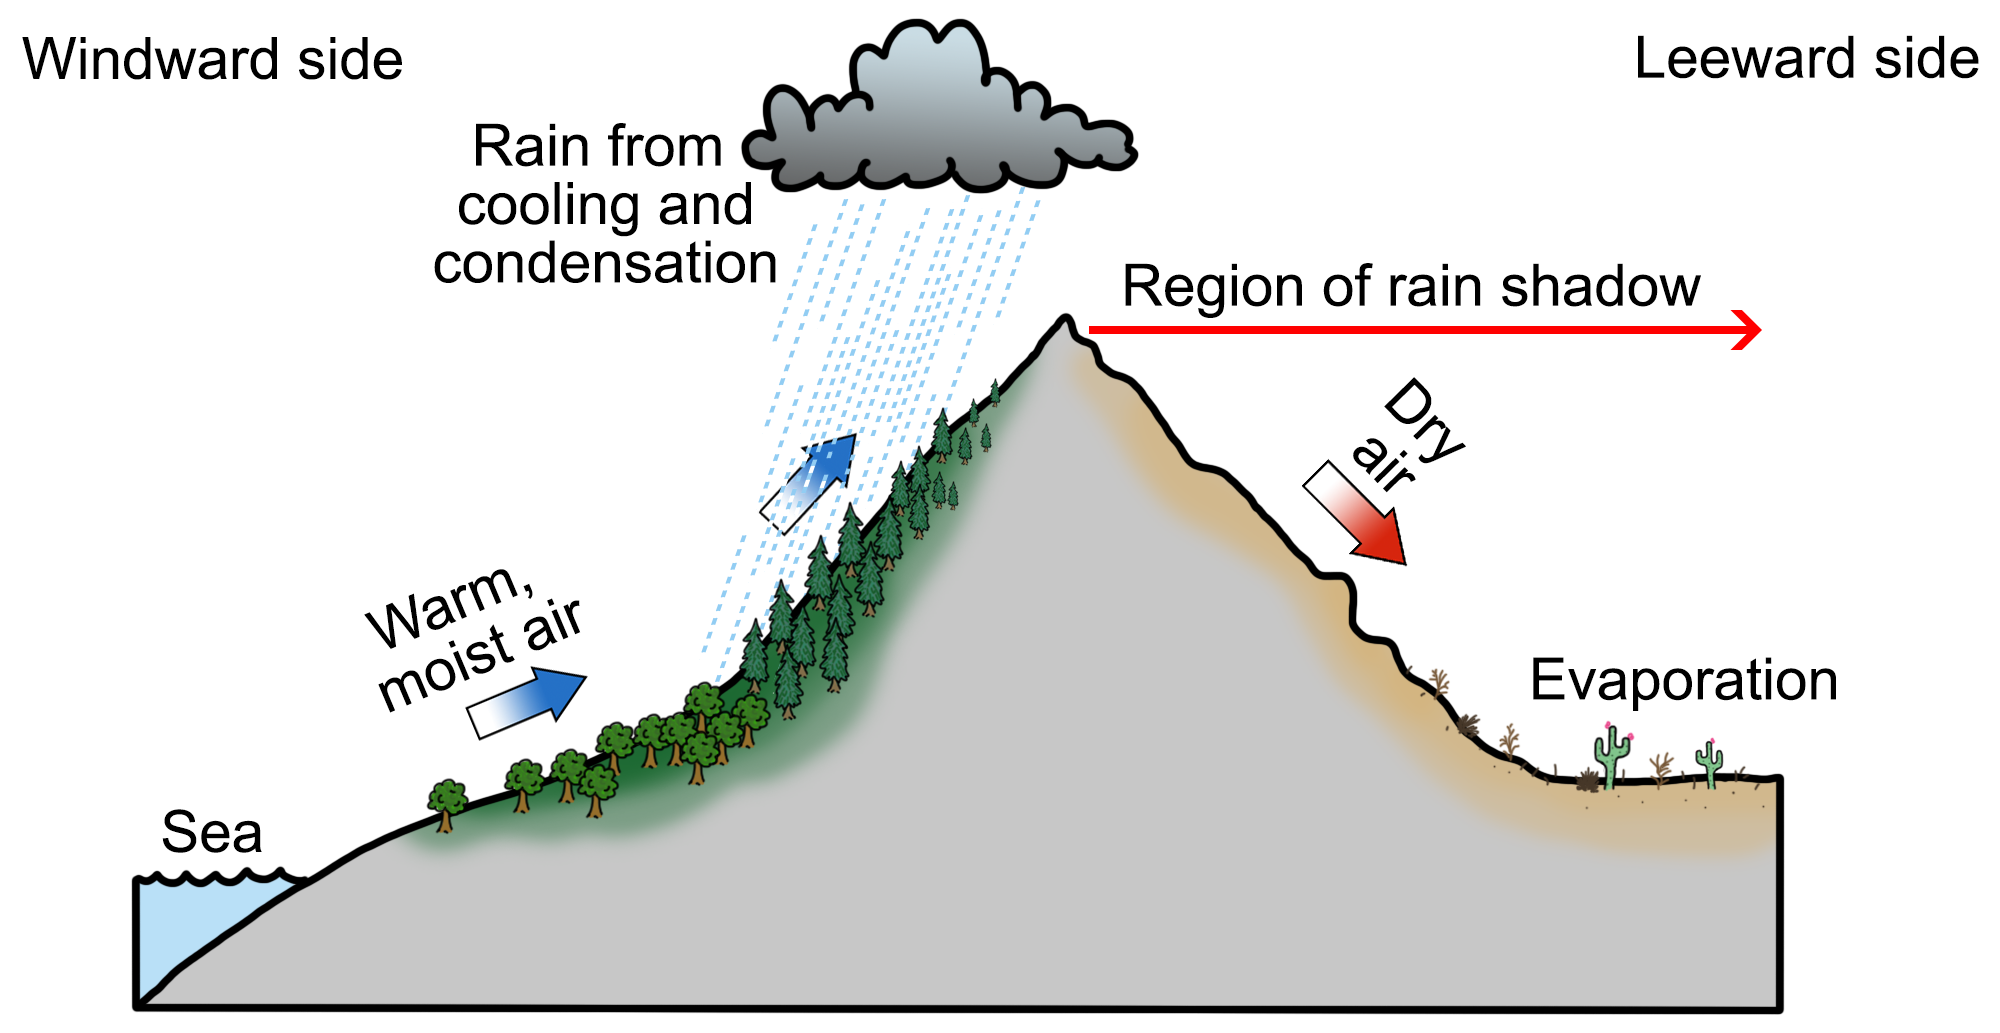
The rain shadow effect occurs when moisture-laden air rises up the windward side of a mountain, only to release this moisture as precipitation due to cooling and condensation. Once the air reaches the leeward side, it warms due to compression, promoting evaporation and a lack of precipitation. Diagram by Wade Greenberg-Brand, originally published in the Teacher Friendly Guide to Earth Science series, modified for Earth@Home.
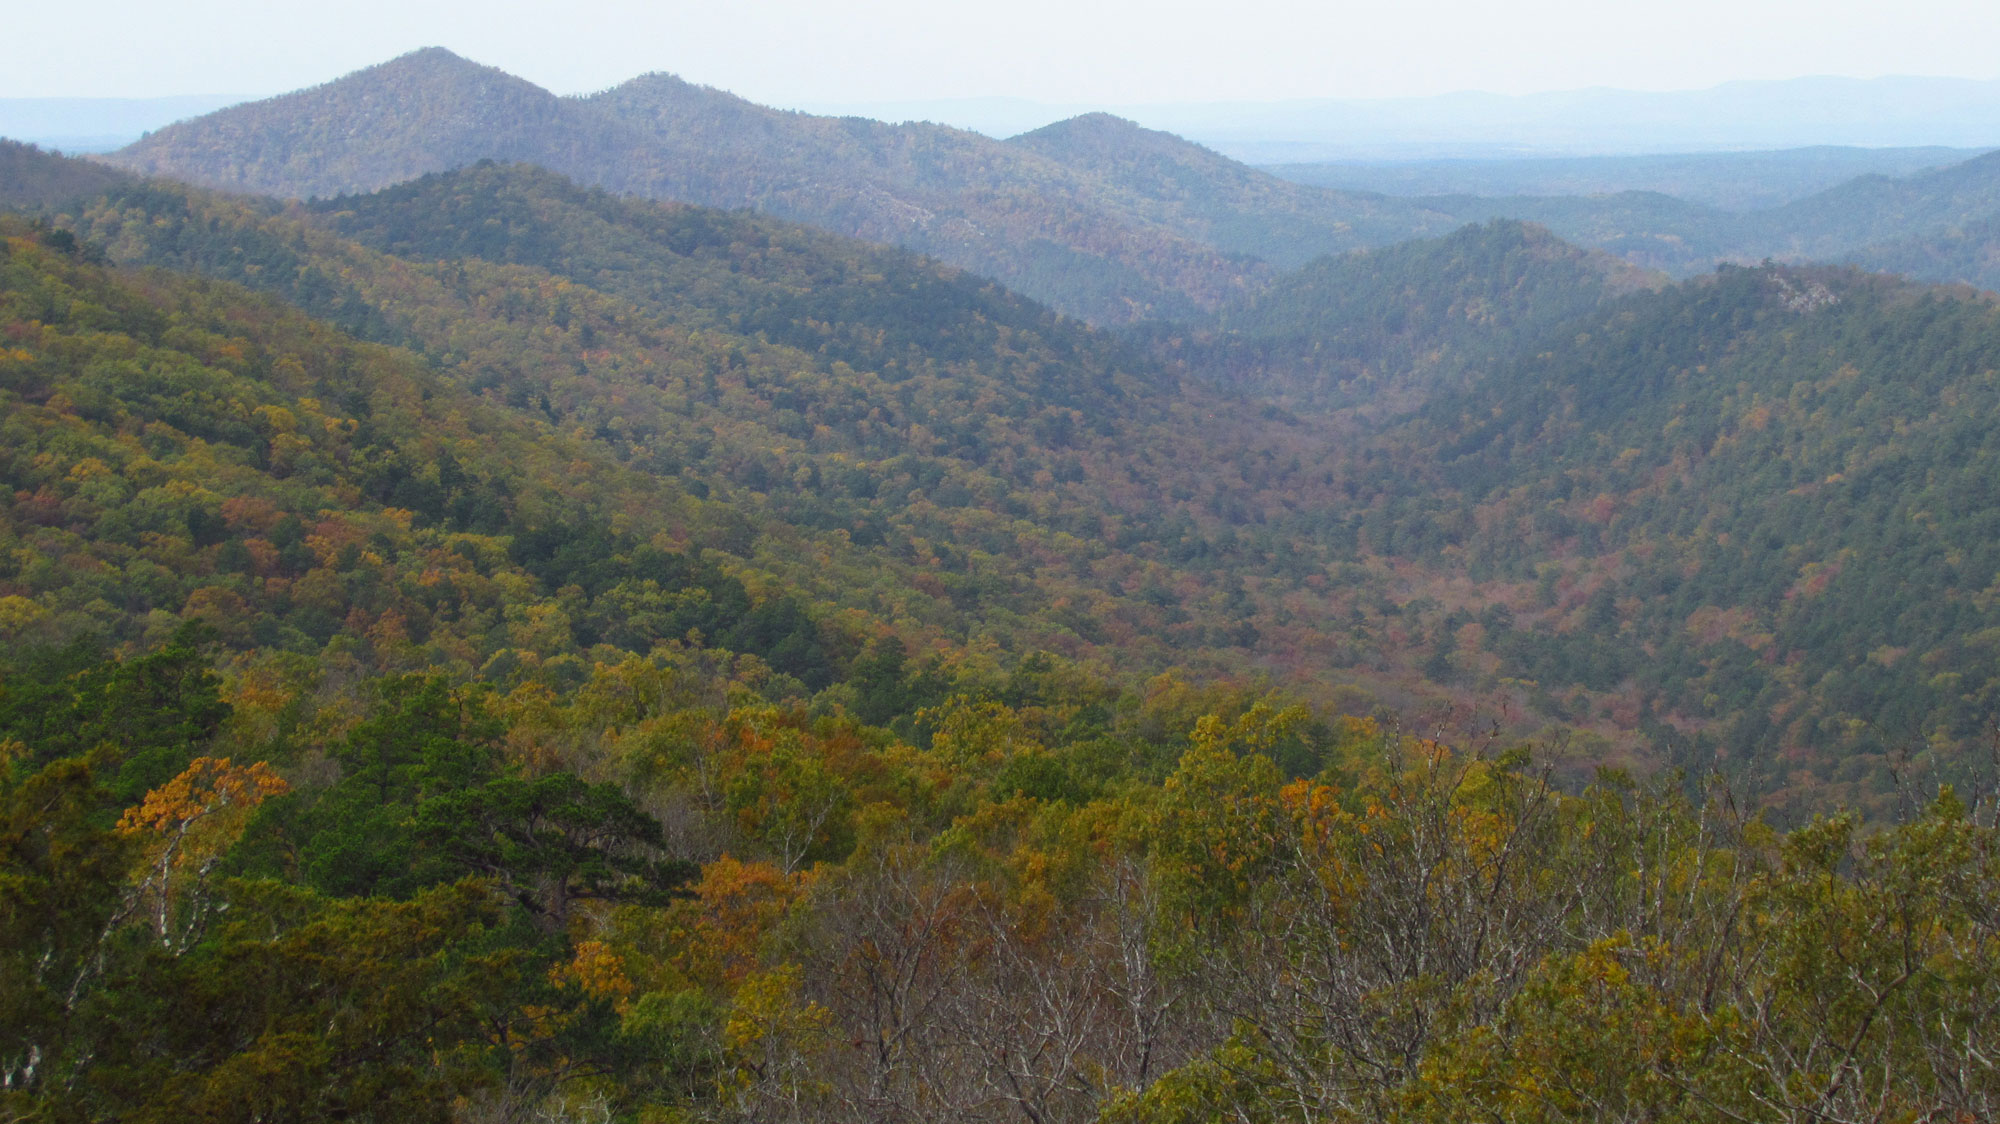
Caney Creek Wilderness, Ouachita Mountains, Arkansas. Photo by Tammo2011 (Wikimedia Commons, CC0 1.0/Public Domain Dedication).
Kansas and Oklahoma
In Oklahoma, summers are long and warm, and winters are shorter than in adjacent states. Because of moist warm air moving northward from the Gulf, rainfall increases dramatically toward the state’s eastern portion, with an average of 43 centimeters (17 inches) in the west and 142 centimeters (56 inches) in the far southeast. In the winter, snowfall follows the reverse pattern, with more snow in the west than in the east, due to the state’s elevation gradient. This same pattern is also present in Kansas, where the annual average precipitation ranges from 107 centimeters (42 inches) in the southeast to 51 centimeters (20 inches) in the west, and the annual average snowfall ranges from 38 to 102 centimeters (15 to 40 inches) along the reverse gradient. With its low topographic relief, Kansas is also commonly home to tornados and dust storms.
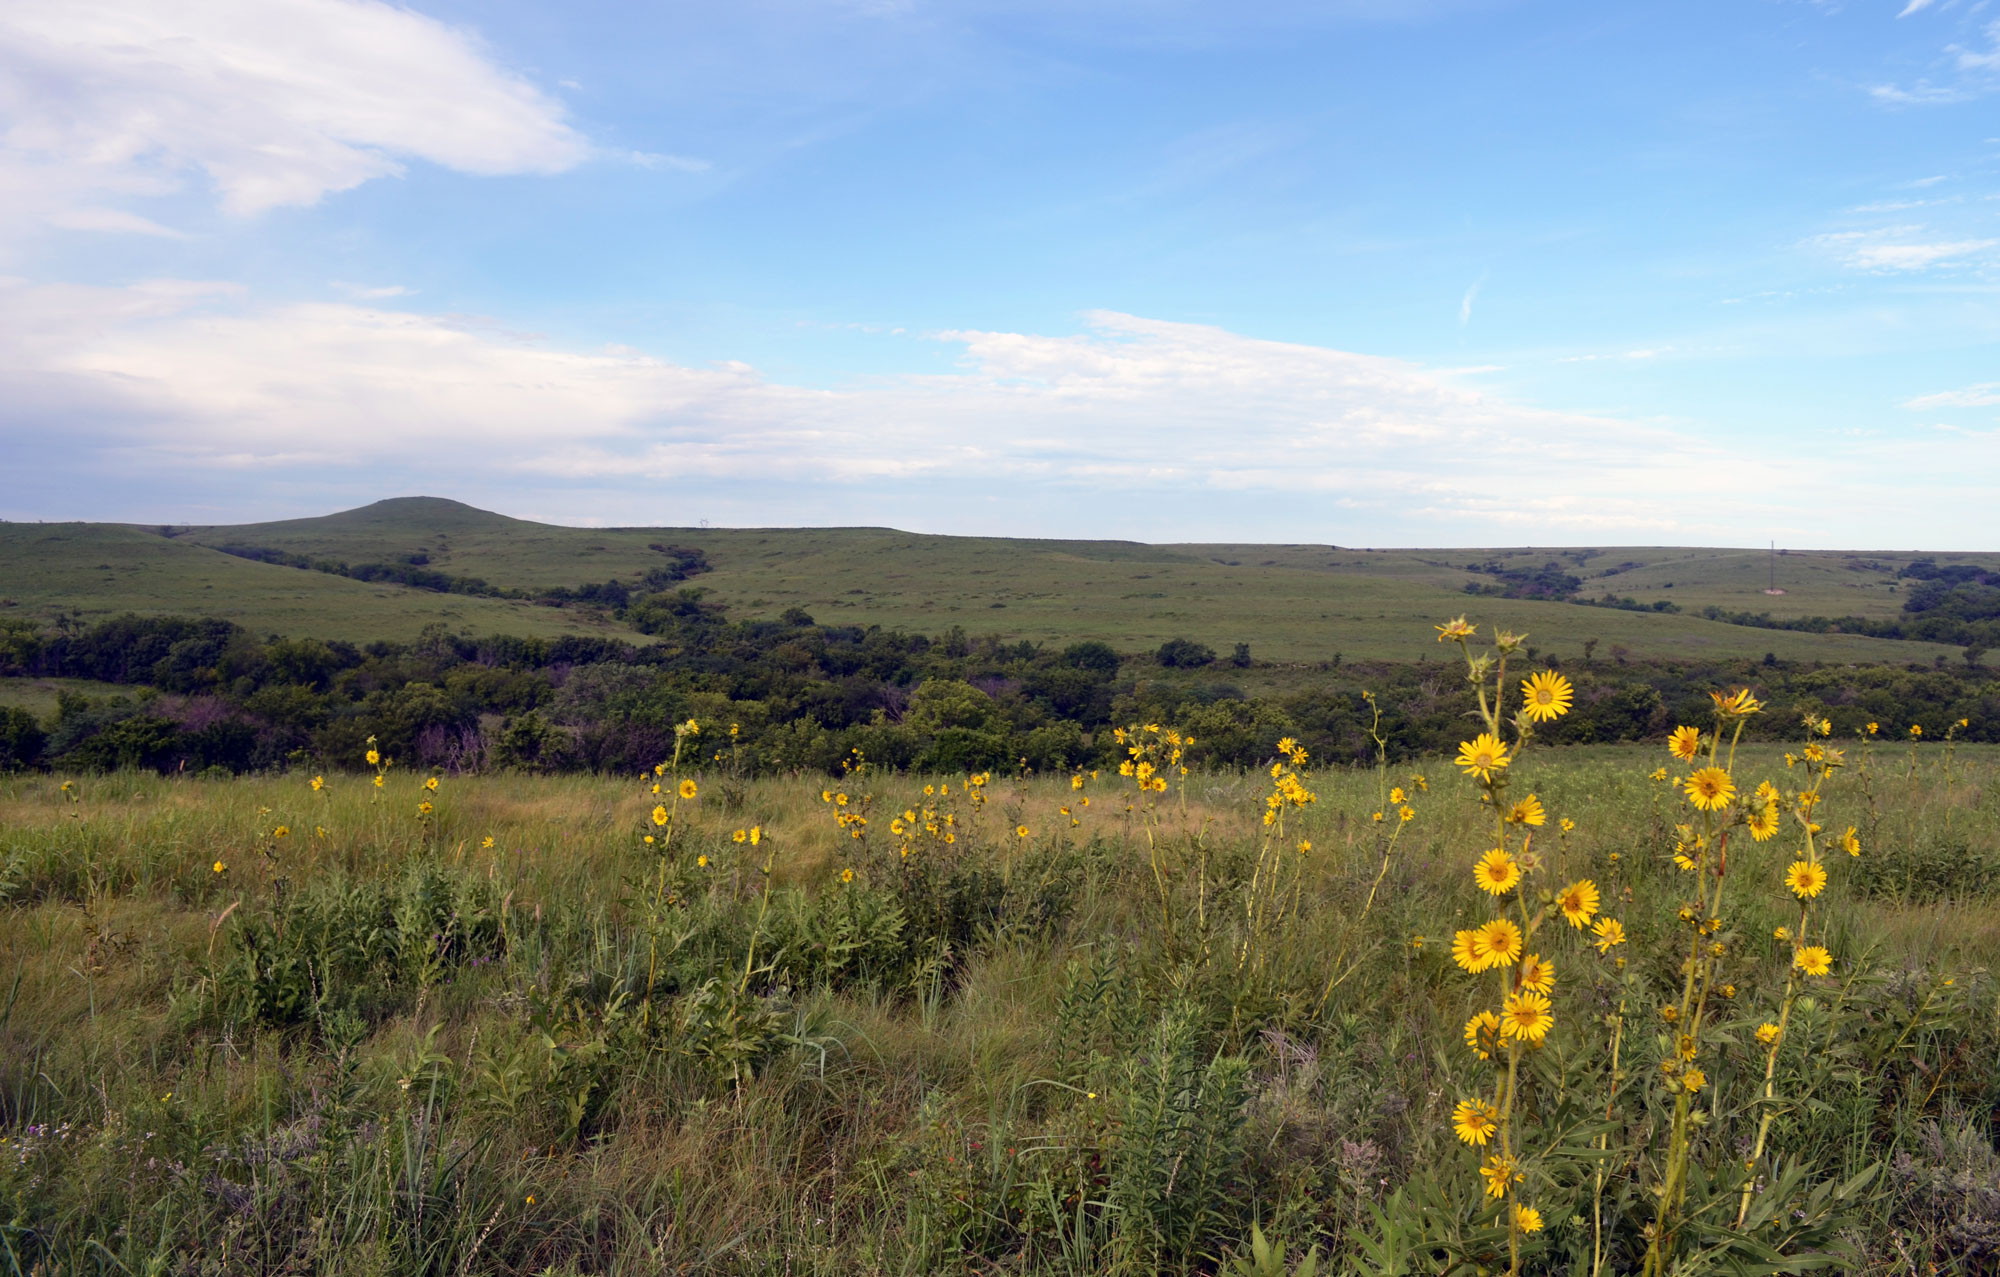
Konza Prairie, Flint Hills, central Kansas. Photo by Joanna Gilkeson, US Fish and Wildlife Service/USFWS (flickr, public domain).
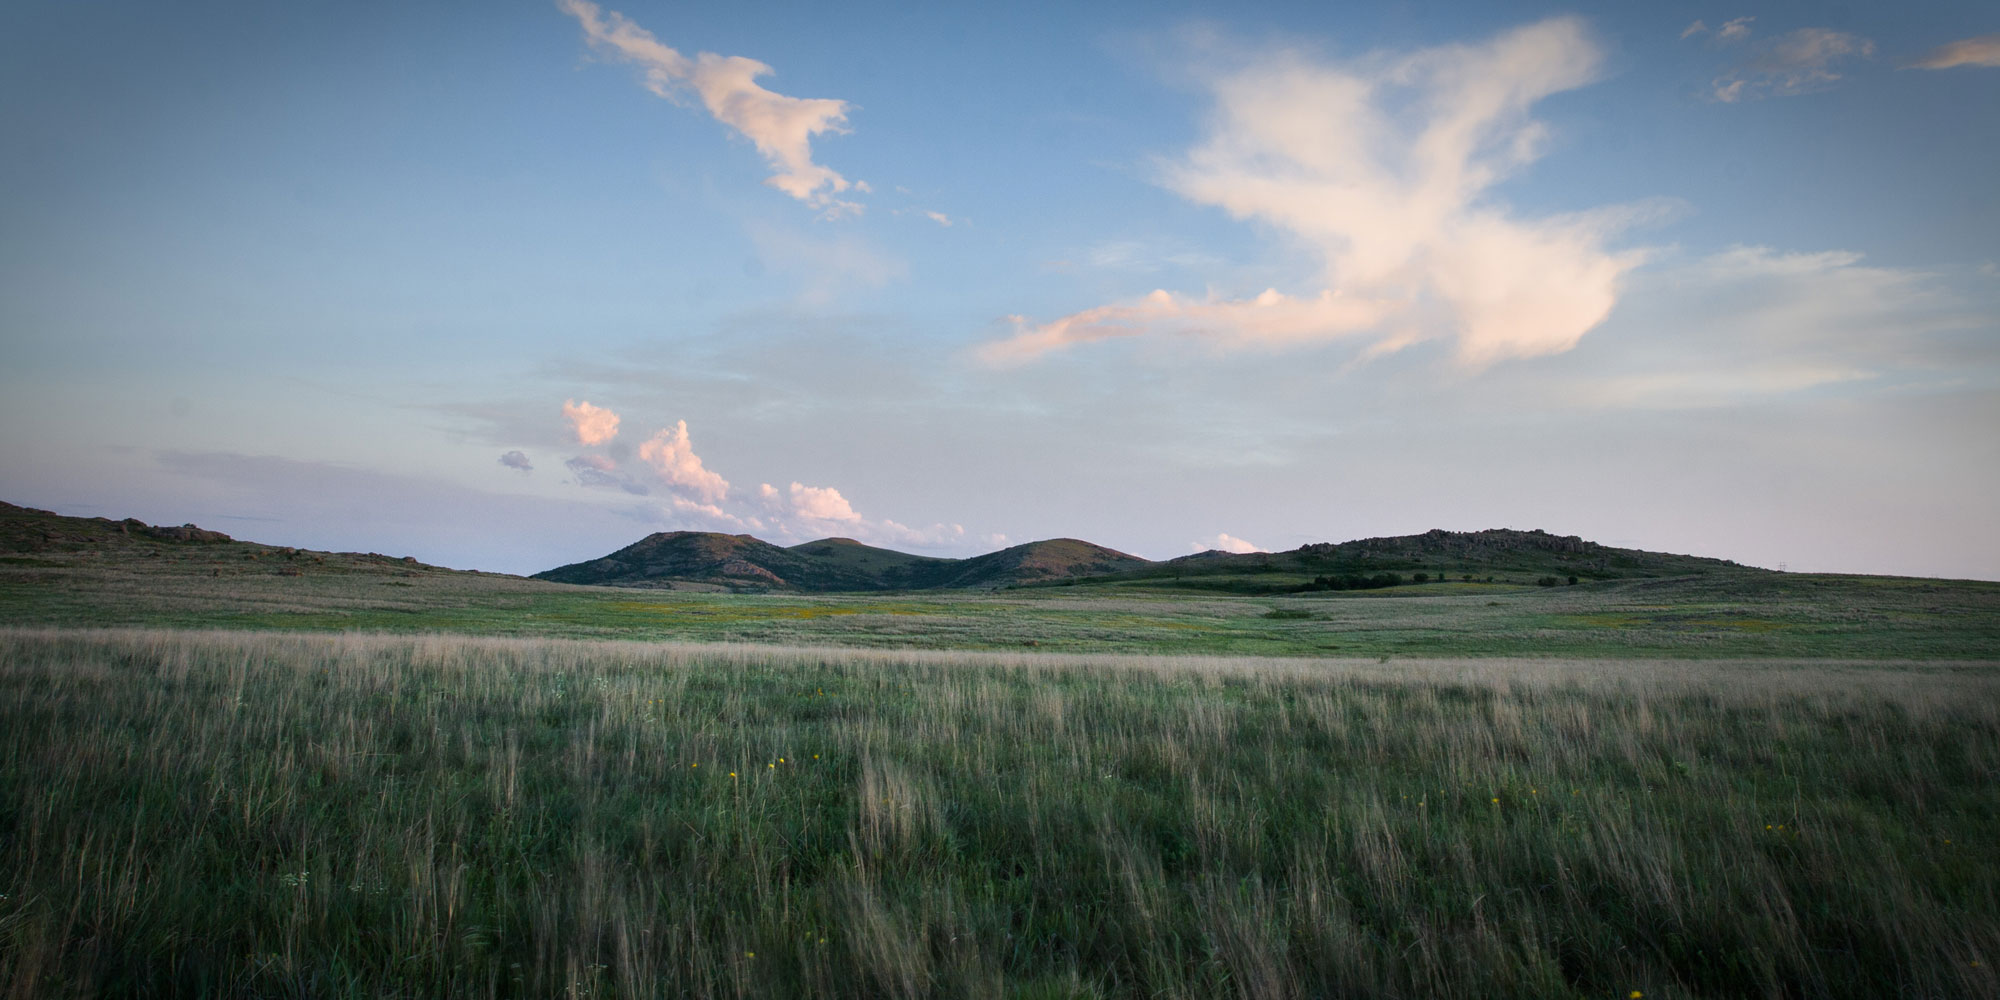
Tallgrass prairie in Wichita Mountains National Wildlife Refuge, Oklahoma. Photo by Justin Meissen (flickr, Creative Commons Attribution-ShareAlike 2.0 Generic license, image resized).
Louisiana
During the summer months, rainfall increases in southeastern Louisiana, where moist tropical air arriving from the Gulf of Mexico results in almost daily showers. The state is also commonly in the path of tropical storms and hurricanes moving northward off of the Gulf. Louisiana is south of the path of many winter storm centers, which travel from the northwest, but the northern parts of the state are susceptible. For this reason, Louisiana’s winter precipitation pattern is reversed from the summer, with the heaviest precipitation found in the state’s north.
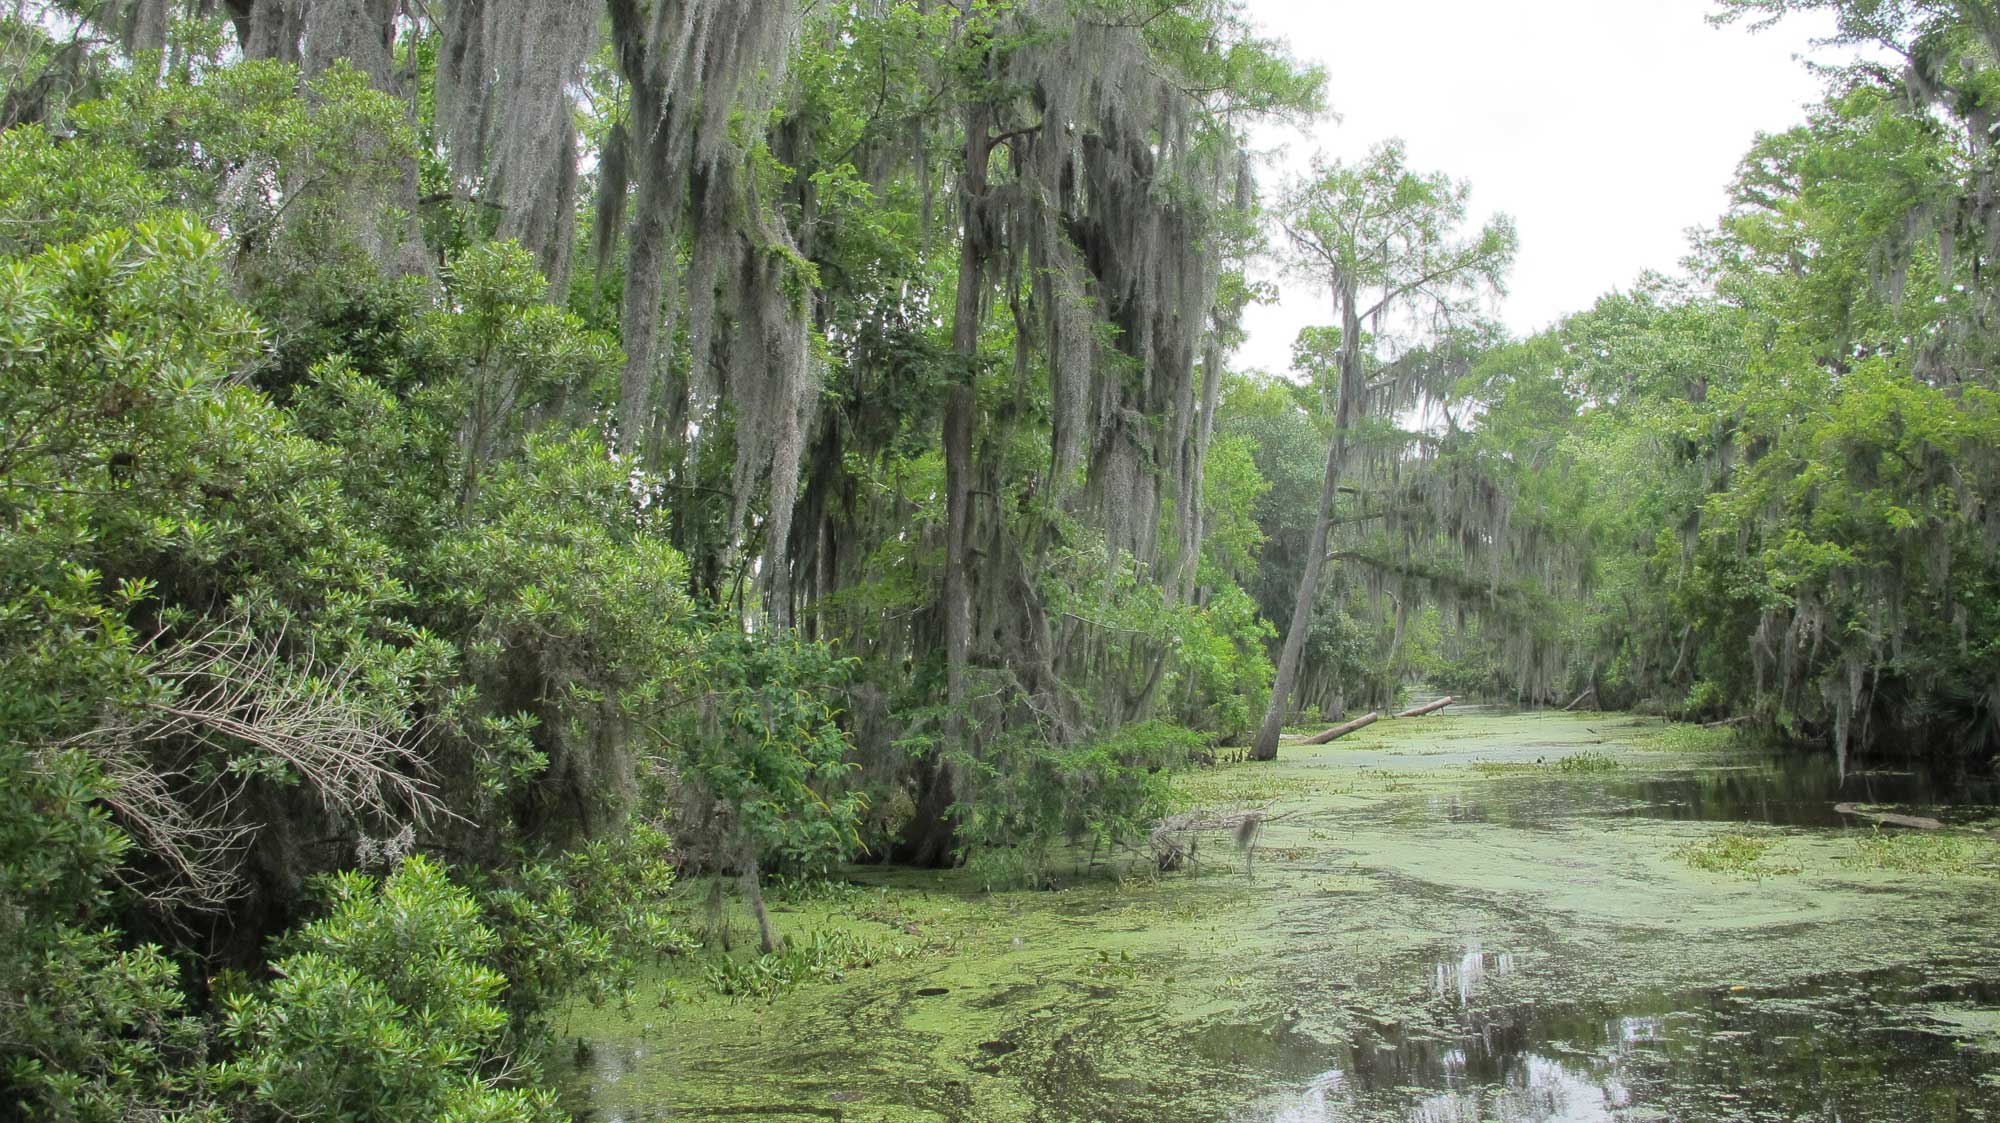
Swamp habitat in southern Louisiana, which experiences warm temperature and summer rains. Photo by Ed Beirman, 2015 (flickr, Creative Commons Attribution 2.0 Generic license, image resized).
Missouri
Missouri’s location in the U.S. interior, and the absence of nearby large bodies of water or mountain ranges that would moderate the state’s climate, means that it is subject to major temperature extremes. The warm, moist air of the Gulf influences summer precipitation, while Arctic air from the north affects the winters. Missouri experiences a temperature fluctuation of approximately 17 to 22 degrees Celsius (30 to 40 degrees Fahrenheit) in any 24-hour period.
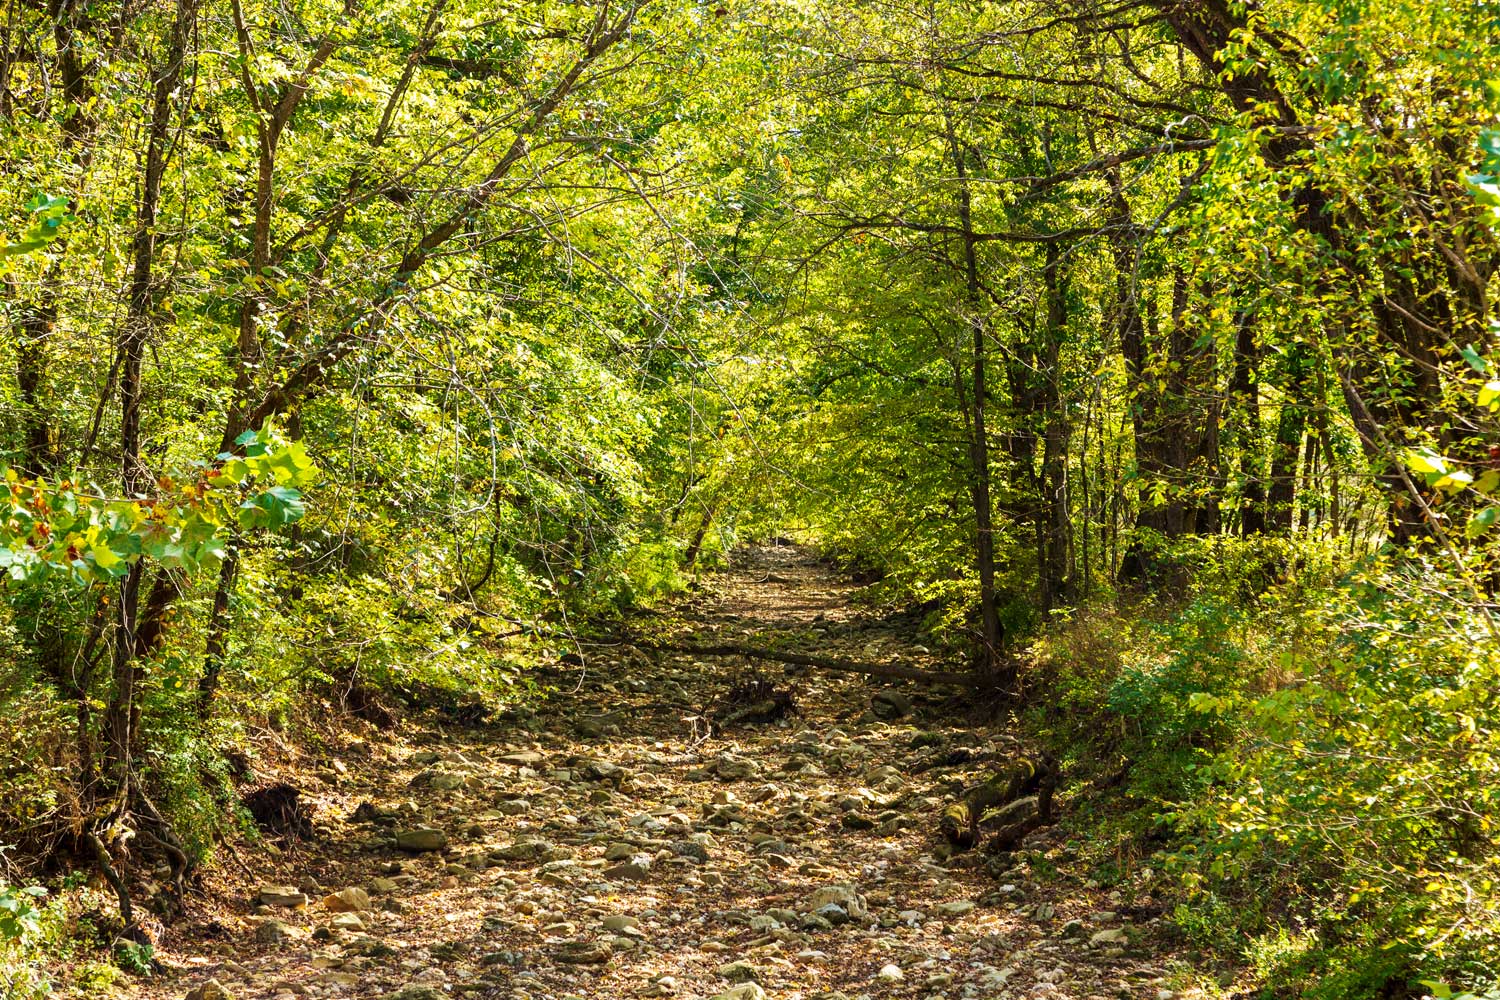
Mark Twain National Forest, Ozark Mountains, Missouri. Photo by Richard Ricciardi, 2020 (flickr, Creative Commons Attribution 2.0 Generic license, image resized).
Texas
Covering nearly 700,000 square kilometers (270,000 square miles), Texas is the second largest U.S. state and encompasses a wide variety of climate regions. The rugged terrain of western Texas receives little rainfall and ranges from desert to semi-arid climate, although the area’s highest peaks do receive significant snowfall in the winter.
The central and eastern areas of Texas possess significantly less complicated topography, with the terrain descending from northwest to southeast. In areas where the terrain drops abruptly, such as in the Caprock Escarpment, topography affects the local climate, enhancing precipitation and promoting the formation of thunderstorms. Overall, precipitation along Texas’ topographic gradient ranges from near-desert conditions in the west to annual accumulations close to 152 centimeters (60 inches) along the coast thanks to moisture from the Gulf. Although the humid air amplifies summer heat, the Gulf’s waters cool during the winter, moderating coastal temperatures during the spring. Texas’ coastal area is prone to severe thunderstorms and tornados. It is also vulnerable to the occasional hurricane.
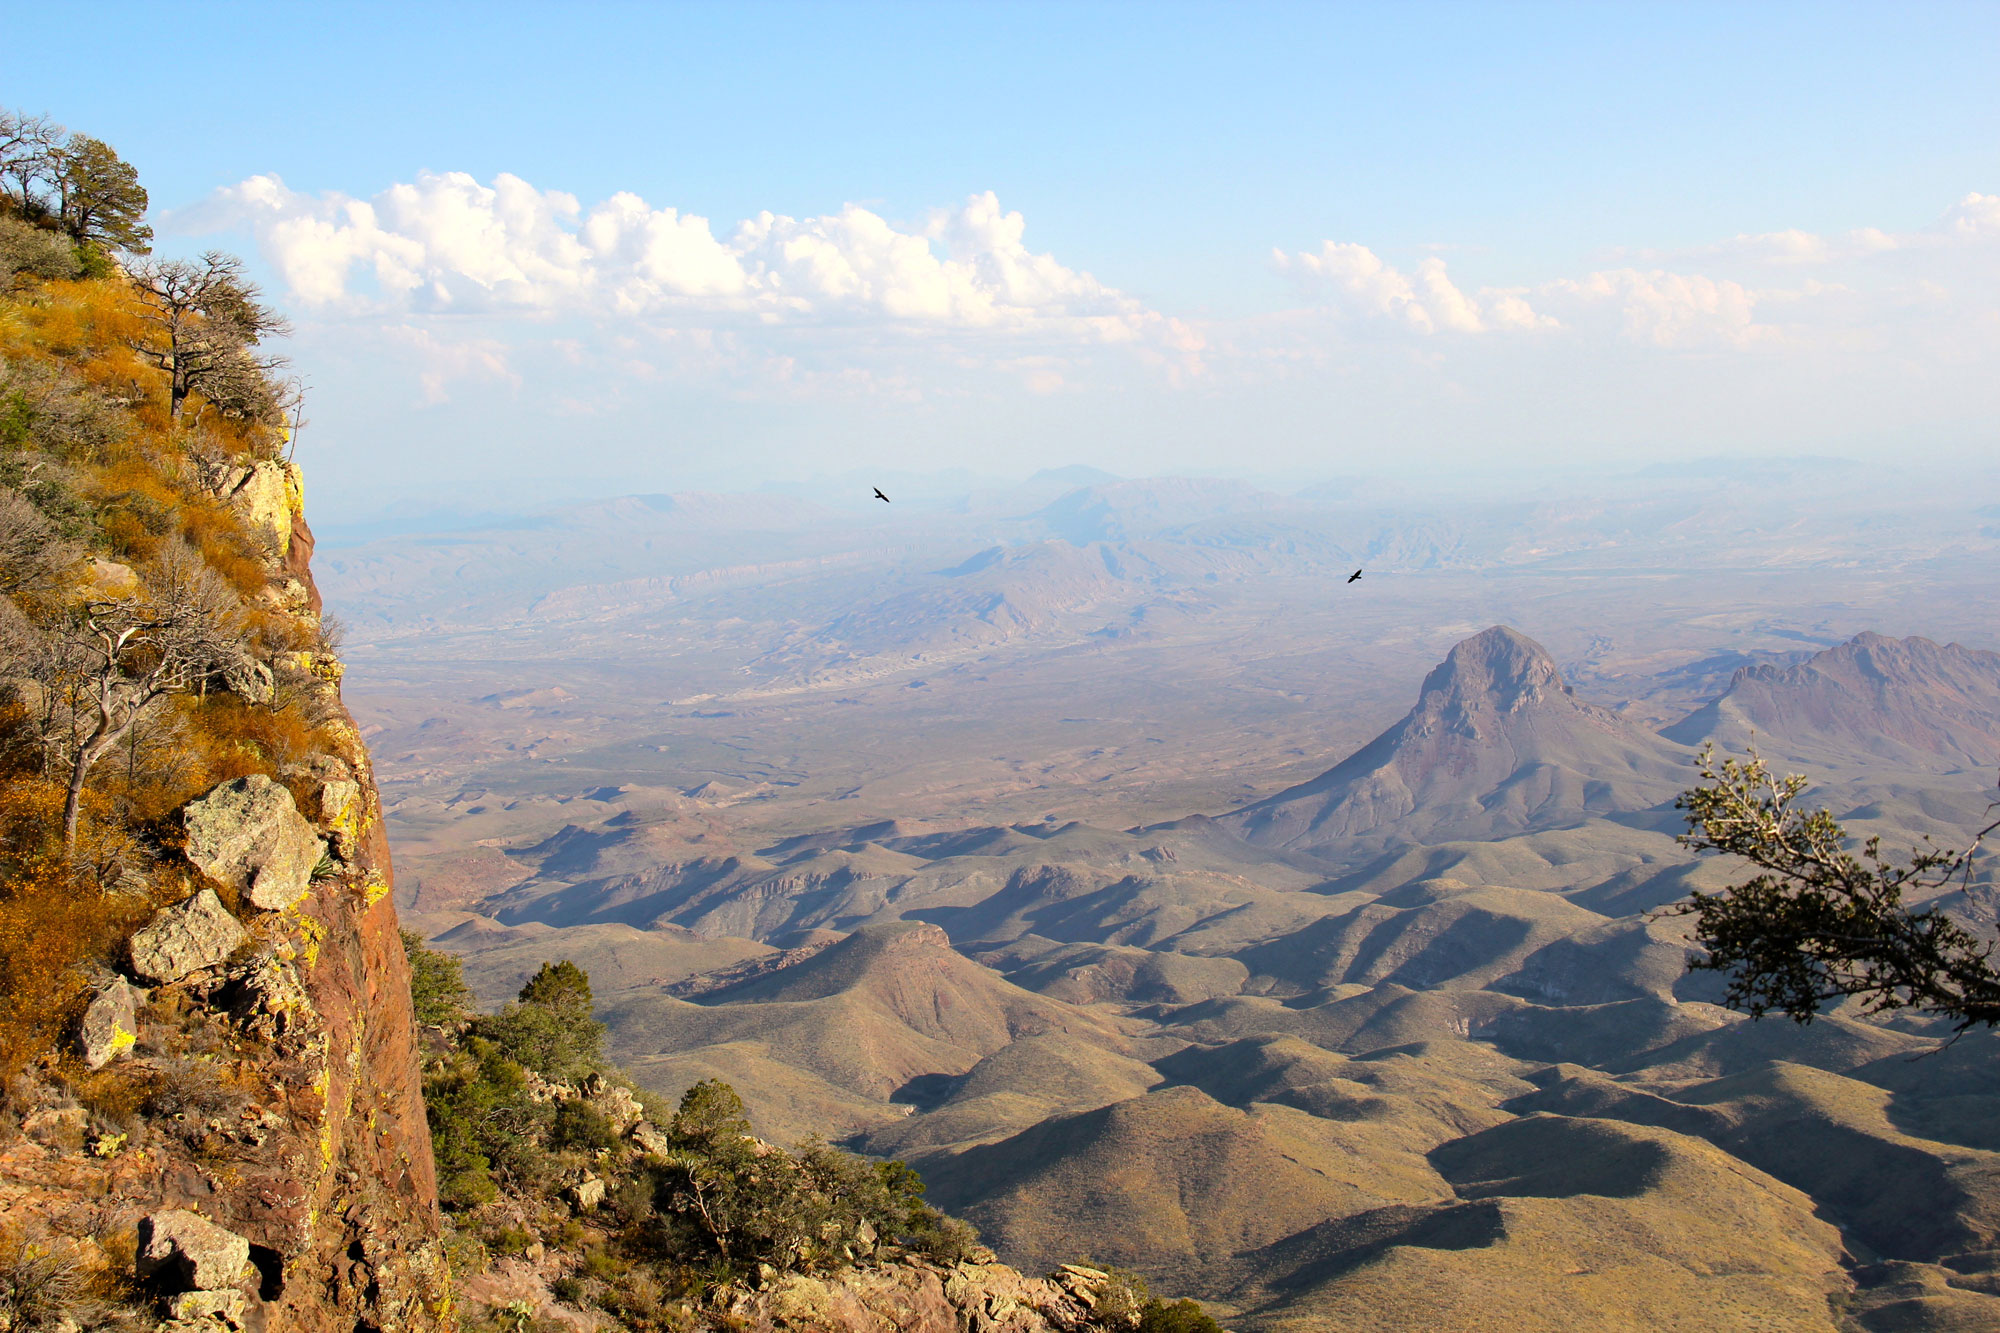
The dry landscape of the Chihuahuan Desert observed from the Chisos Mountains, Big Bend National Park, Texas, 2012. Photo by daveynin (Wikimedia Commons, Creative Commons Attribution 2.0 Generic license, image resized).
Past climate of the south-central U.S.
This section covers the climate of the south-central U.S. through the Phanerozoic, from about 541 million years ago to the recent. For the climate on early Earth prior to 541 million years ago, see the Introduction to Climate section.
Paleozoic (541 to 252 million years ago)
Cambrian to Devonian (541 to 359 million years ago)
With the start of the Paleozoic era, climates across the world were warm, and North America was located in the low and warmer latitudes of the Southern Hemisphere. As the Cambrian progressed, North America moved northward; by about 480 million years ago, what would become the south-central U.S. was located just below the equator.
In Texas, the presence of Cambrian sandstone indicates that sediments were carried to the sea from the land to the northwest. East of the sandstone, a rich and diverse marine fauna, including trilobites, brachiopods, bivalves, sponges, and other invertebrates, is contained within dolomite and limestone units. Most of the south-central was probably home to warm, shallow seas that persisted into the Ordovician.
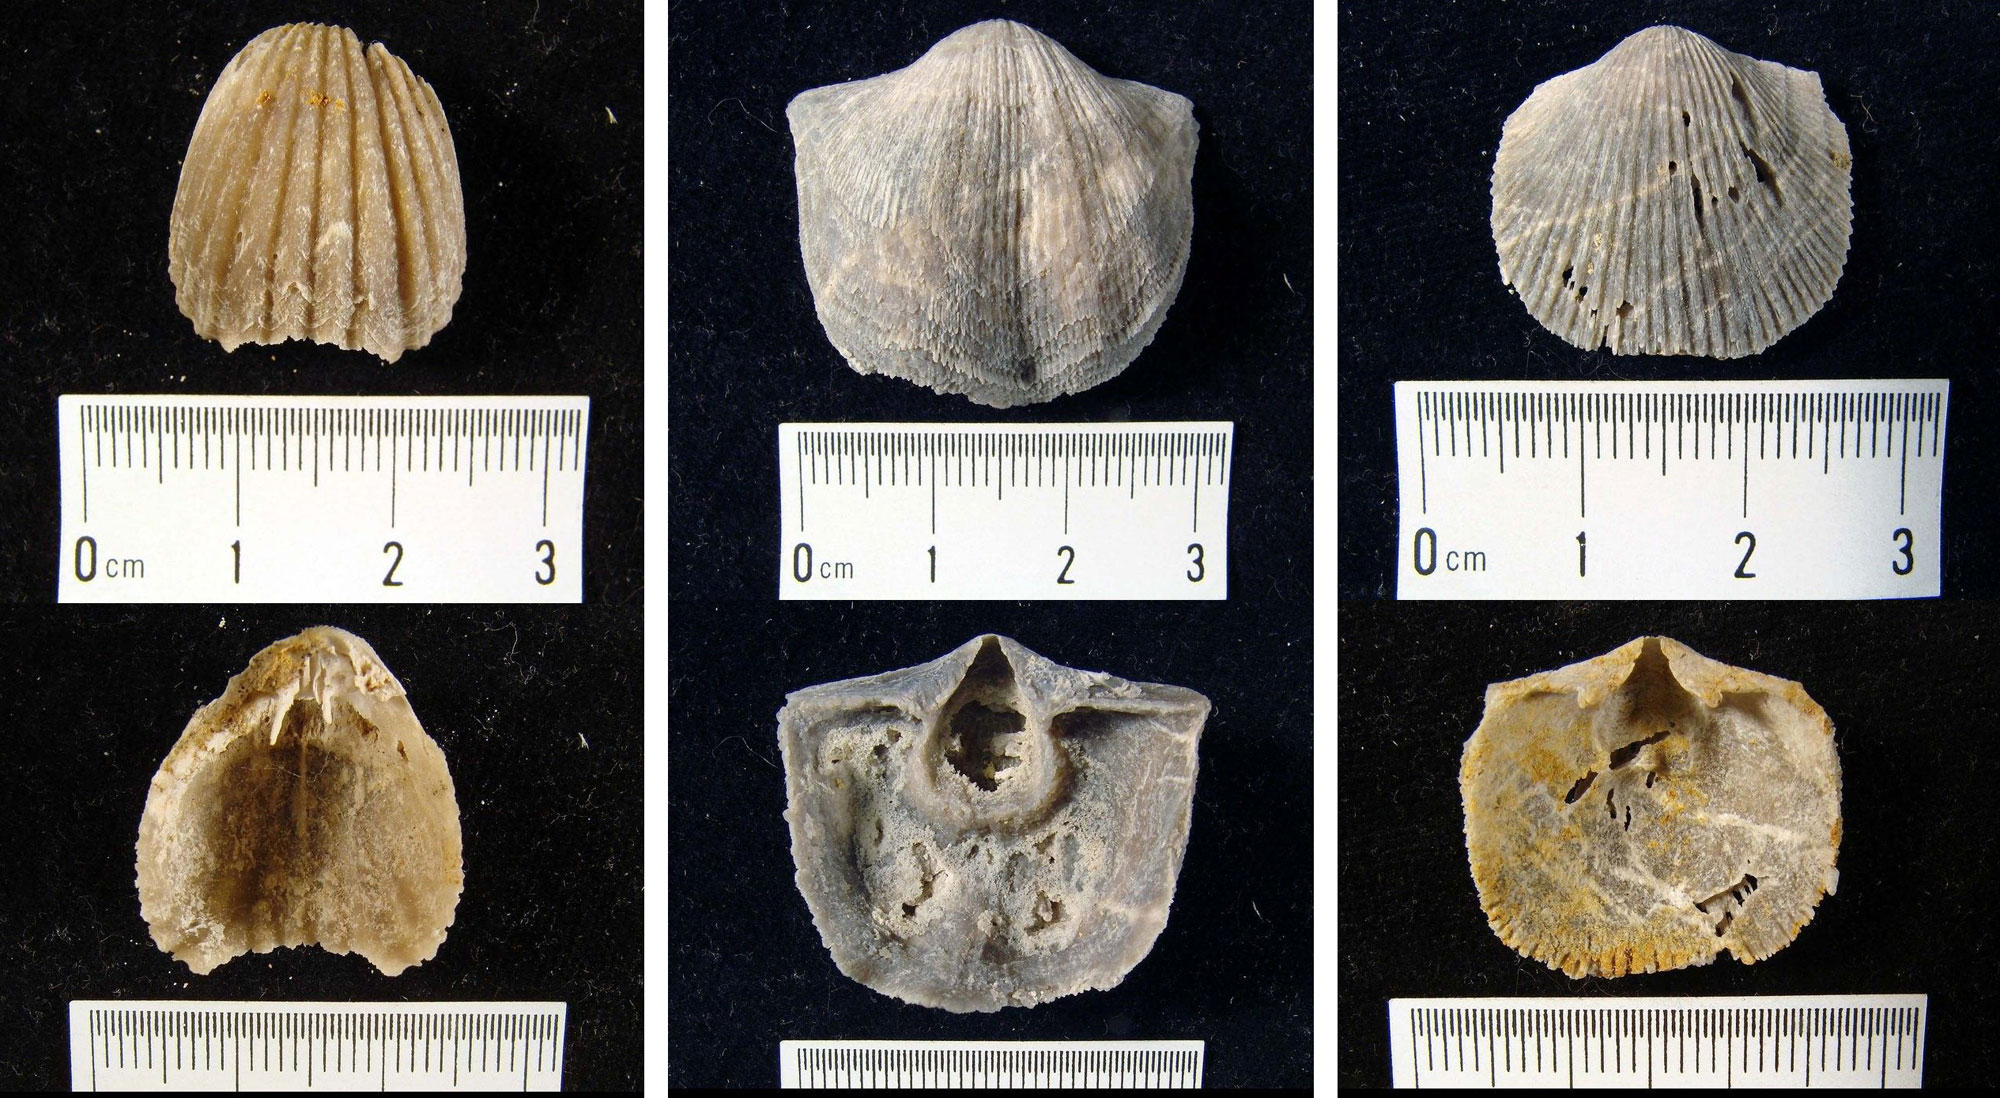
Brachiopods from the upper Ordovician Fernvale Formation, Cape Girardeau, Missouri. In each panel, the upper image shows the outside of the shell, and the lower image shows the inside. Left to right, Rhynchotrema manniensis (YPM IP 068498), Herbertella sinuata (YPM IP 068509), and Austinella whitfieldi (YPM IP 068507). All photos by Jessica Utrup (YPM/Yale Peabody Museum of Natural History, CC0 1.0 Universal/Public Domain Dedication, accessed via Global Biodiversity Information Facility/GBIF.org).
At the end of the Ordovician, from 460 to 430 million years ago, the Earth fell into another ice age. Silurian and Devonian fossils in Oklahoma (including trilobites and brachiopods) indicate, however, that the south-central U.S. still contained warm, shallow seas through the early Devonian.
After an episode of uplift and erosion, the environment changed dramatically. The seas became deeper, and plankton productivity grew so high that it depleted all the oxygen from the seafloor and sediments. The lack of oxygen allowed organic matter to accumulate instead of decaying, leading to the deposition of black, carbon-rich shale. Drill cores show us that this rock occurs throughout the subsurface in the western two-thirds of Oklahoma and northern Texas; it is one of the richest sources of petroleum in those states.
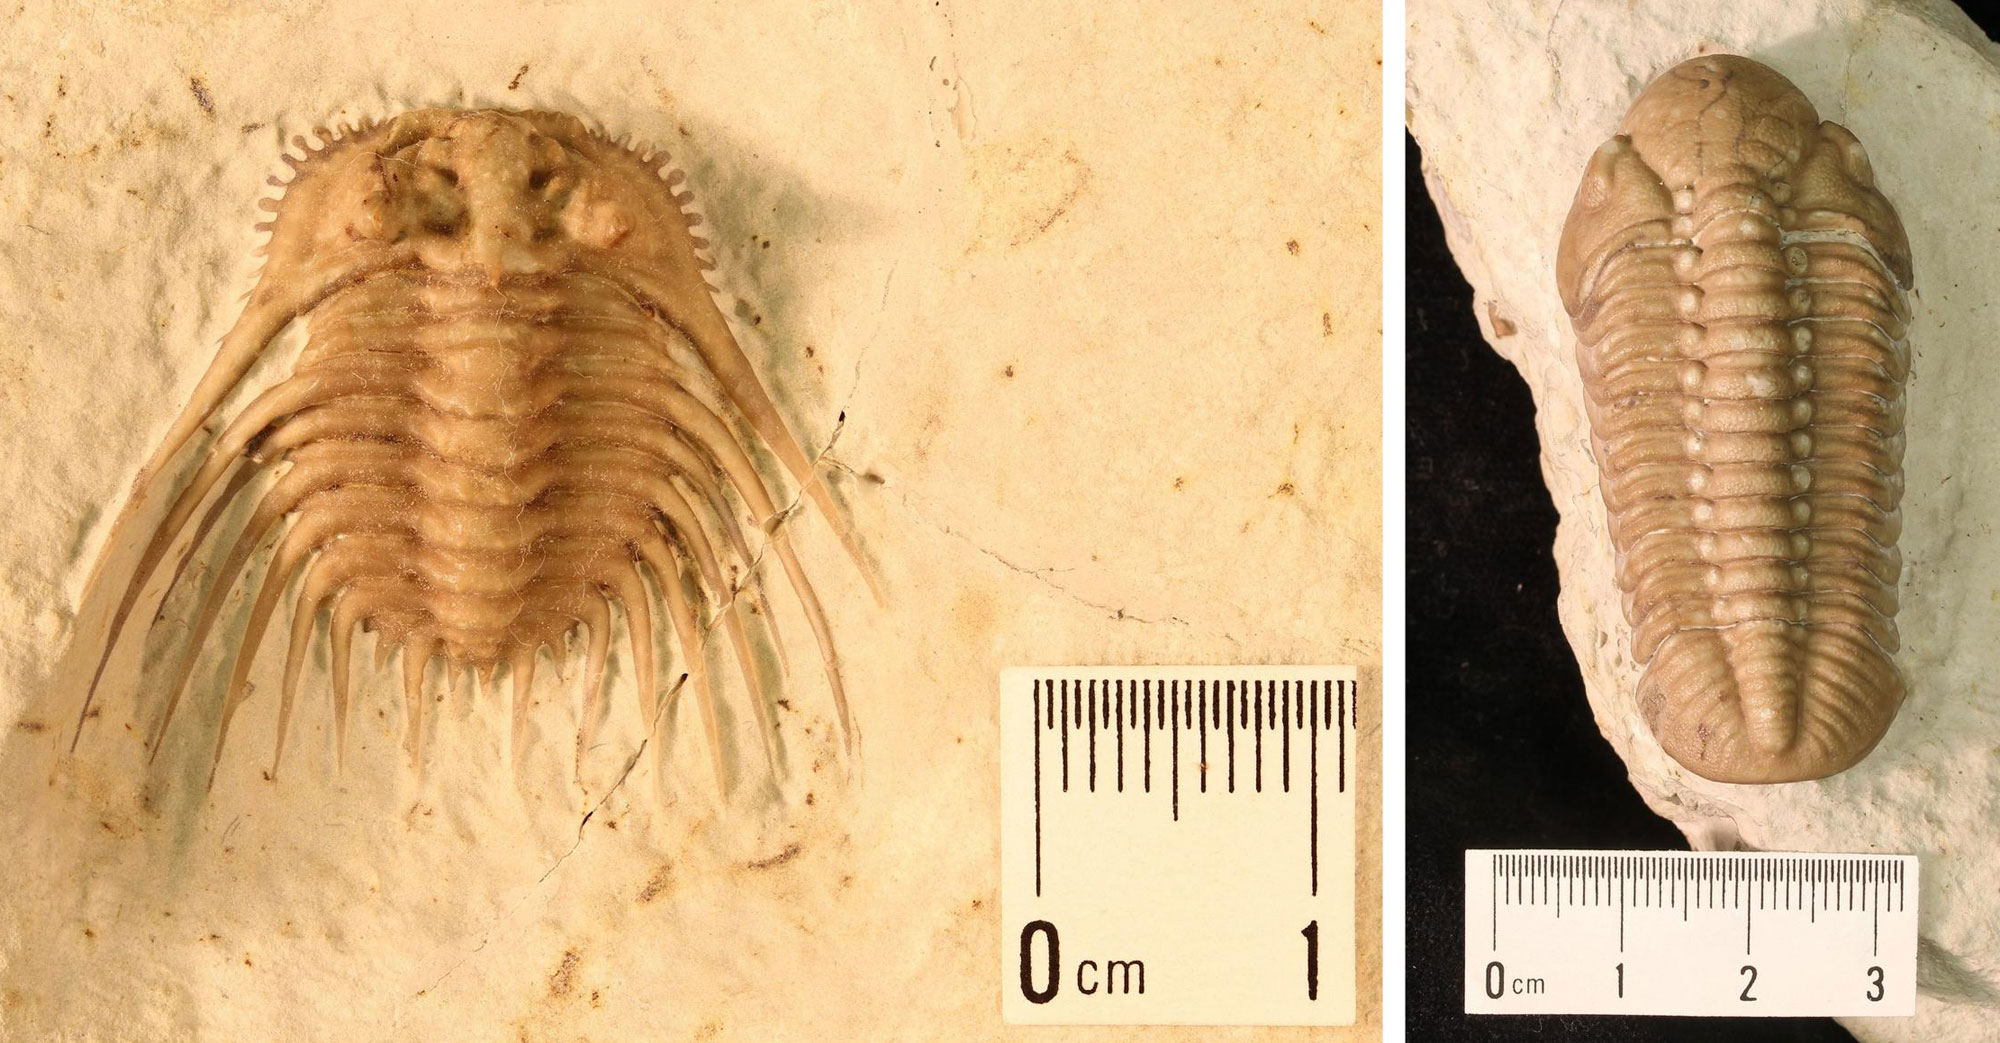
Trilobites from the lower Devonian Haragan Limestone, Coal County, Oklahoma. Left: Kettneraspis williamsi (YPM IP 428842). Right: Reedops deckeri (YPM IP 531078). Photos by Jessica Utrup (YPM/Yale Peabody Museum of Natural History, CC0 1.0 Universal/Public Domain Dedication, accessed via Global Biodiversity Information Facility/GBIF.org).
From 430 to 300 million years ago, ancient North America moved north across the equator, and the cycle of warming and cooling was repeated yet again. Glaciation in the southern hemisphere occurred during the late Devonian, while the supercontinent Gondwana was located over the South Pole. While the south-central states were still submerged, the oceans between Gondwana and North America began to close.
Carboniferous to Permian (359 to 252 million years ago)
In the early Carboniferous (Mississippian), ice capped the South Pole and began to expand northward. Although the Earth's temperature fell during this time and glaciers growing far to the south caused sea levels to drop. The northern part of the south-central U.S. returned to a warm, shallow sea . Limestone accumulated in this region, which supported abundant marine life, including brachiopods, corals, and echinoderms. Meanwhile, the southern part of the sea accumulated thick deposits of sandstone and shale.
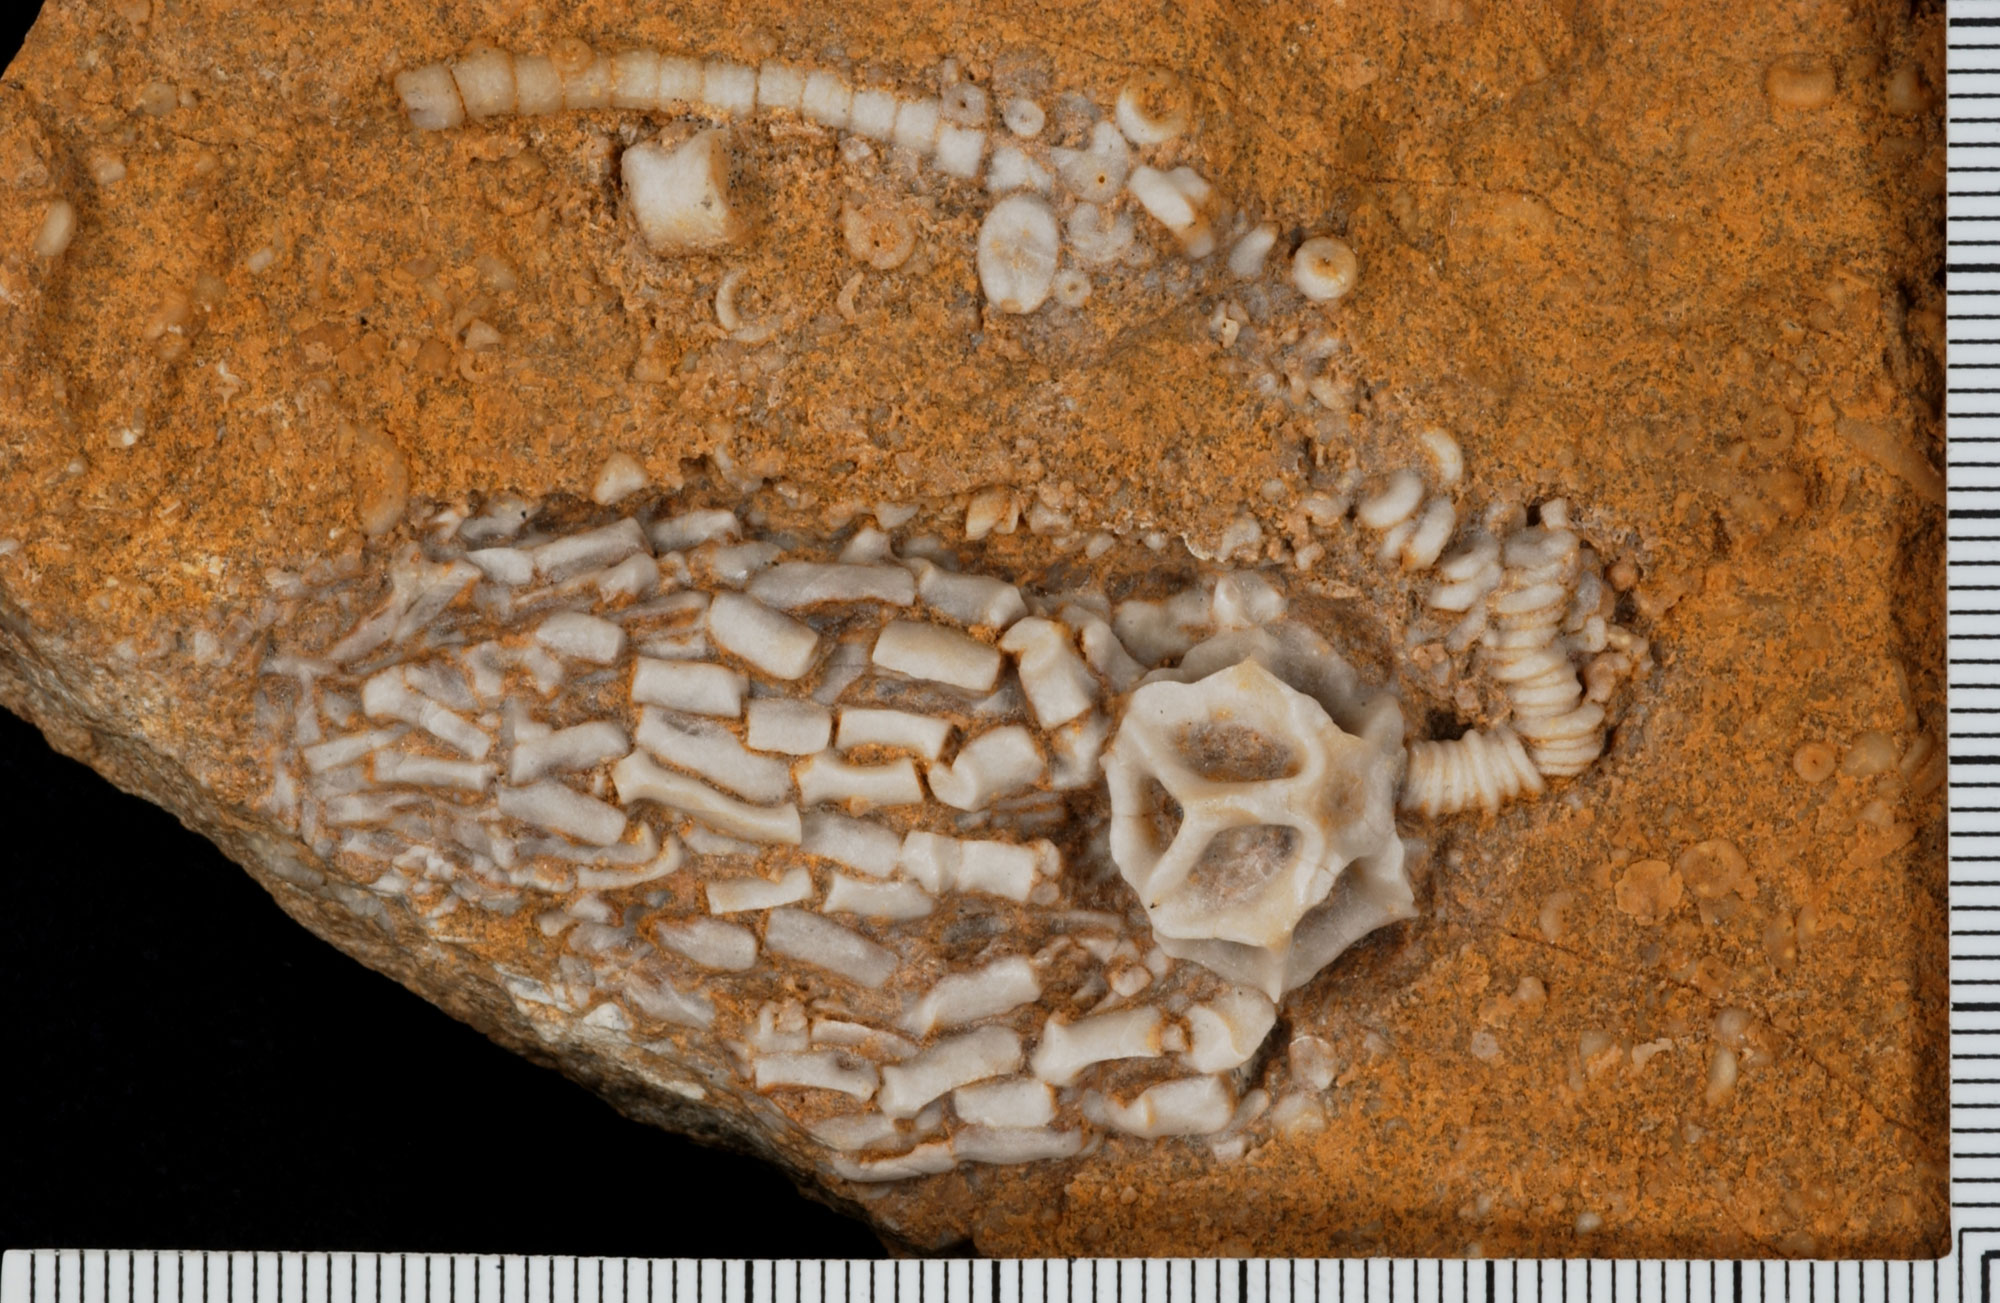
Calyx, arms, and stalk of Cyathocrinites deroseri, Mississippian, Burlington Limestone, Missouri. Scale bars are in millimeters (10 millimeters = 1 centimeter = 0.4 inches). Photo of USNM PAL 509798 (Natural History Museum, Smithsonian Instituion, public domain).
By the late Carboniferous (Pennsylvanian), North America had collided with Gondwana, advancing the formation of Pangaea. Pangaea was a supercontinent composed of nearly all the landmass on Earth. The Ouachita Mountains, remnants of what was once a chain of mountains that may have been as high and broad as the Tibetan Plateau, bear witness to this event.
Sedimentary rocks indicate that most of the south-central U.S. was covered by rivers and plains. Oklahoma, Kansas, and Arkansas had flourishing coastal swamps filled with vegetation that has since been transformed into rich coal beds by heat and pressure. Many Carboniferous rocks in the south-central U.S., especially in Kansas, are cyclic, showing repeated episodes of sea level fall and rise as the ice cap in the Southern Hemisphere advanced and retreated.
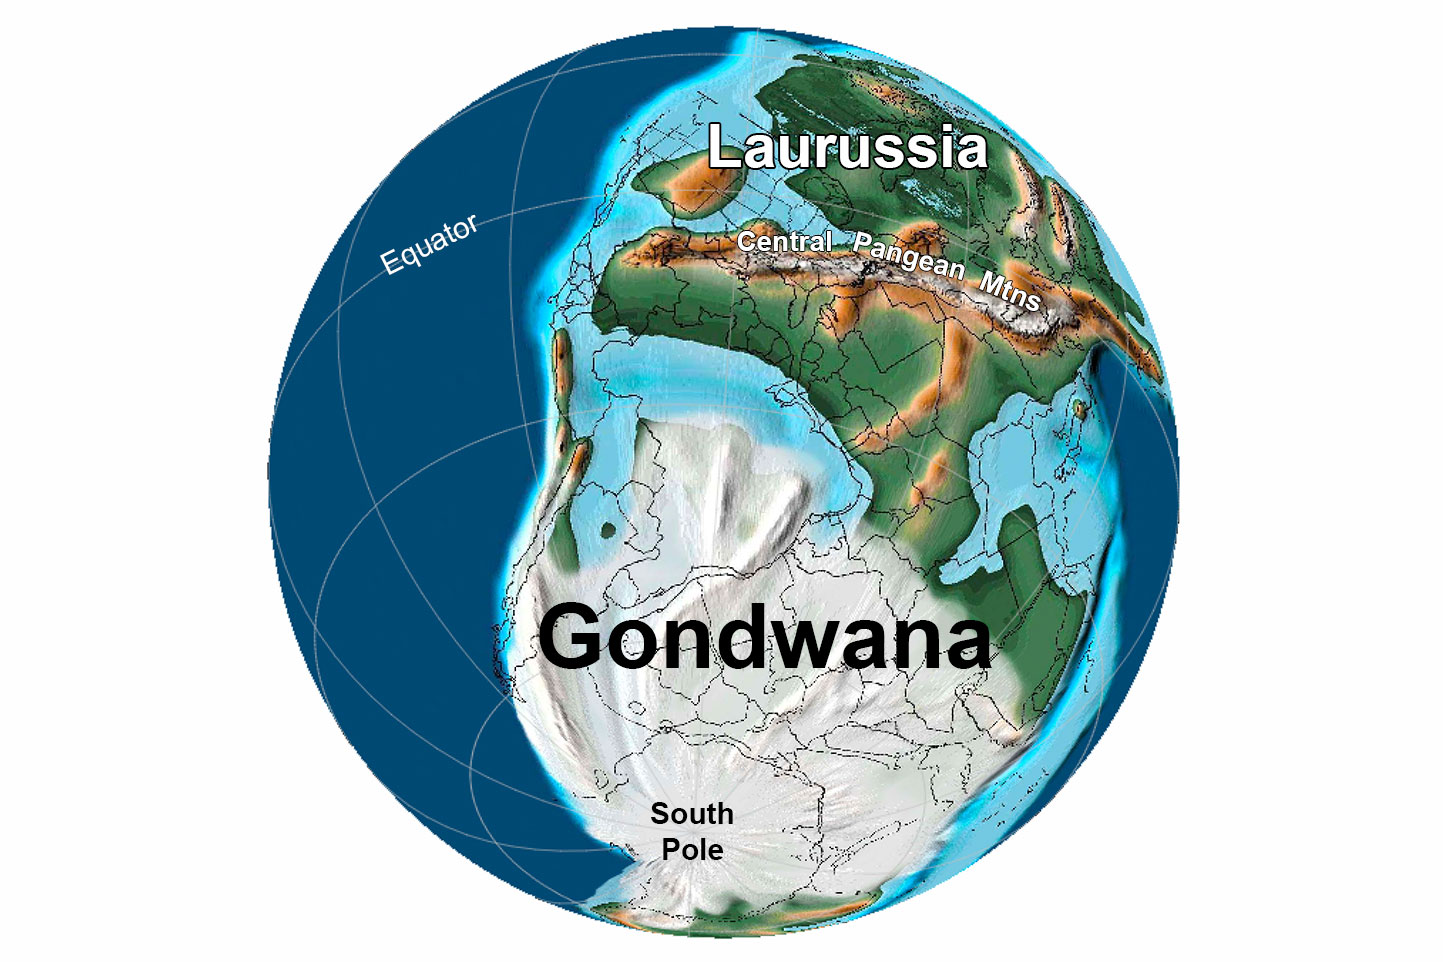
Earth 300 million years ago, during the end of the Carboniferous Period (Pennsylvanian). Pangaea was completed when North America finally collided with Gondwana. Reconstruction created using basemap from the PALEOMAP PaleoAtlas for GPlates and the PaleoData Plotter Program, PALEOMAP Project by C. R. Scotese (2016); map annotations by Jonathan R. Hendricks & Elizabeth J. Hermsen for PRI's Earth@Home project (CC BY-NC-SA 4.0 license).
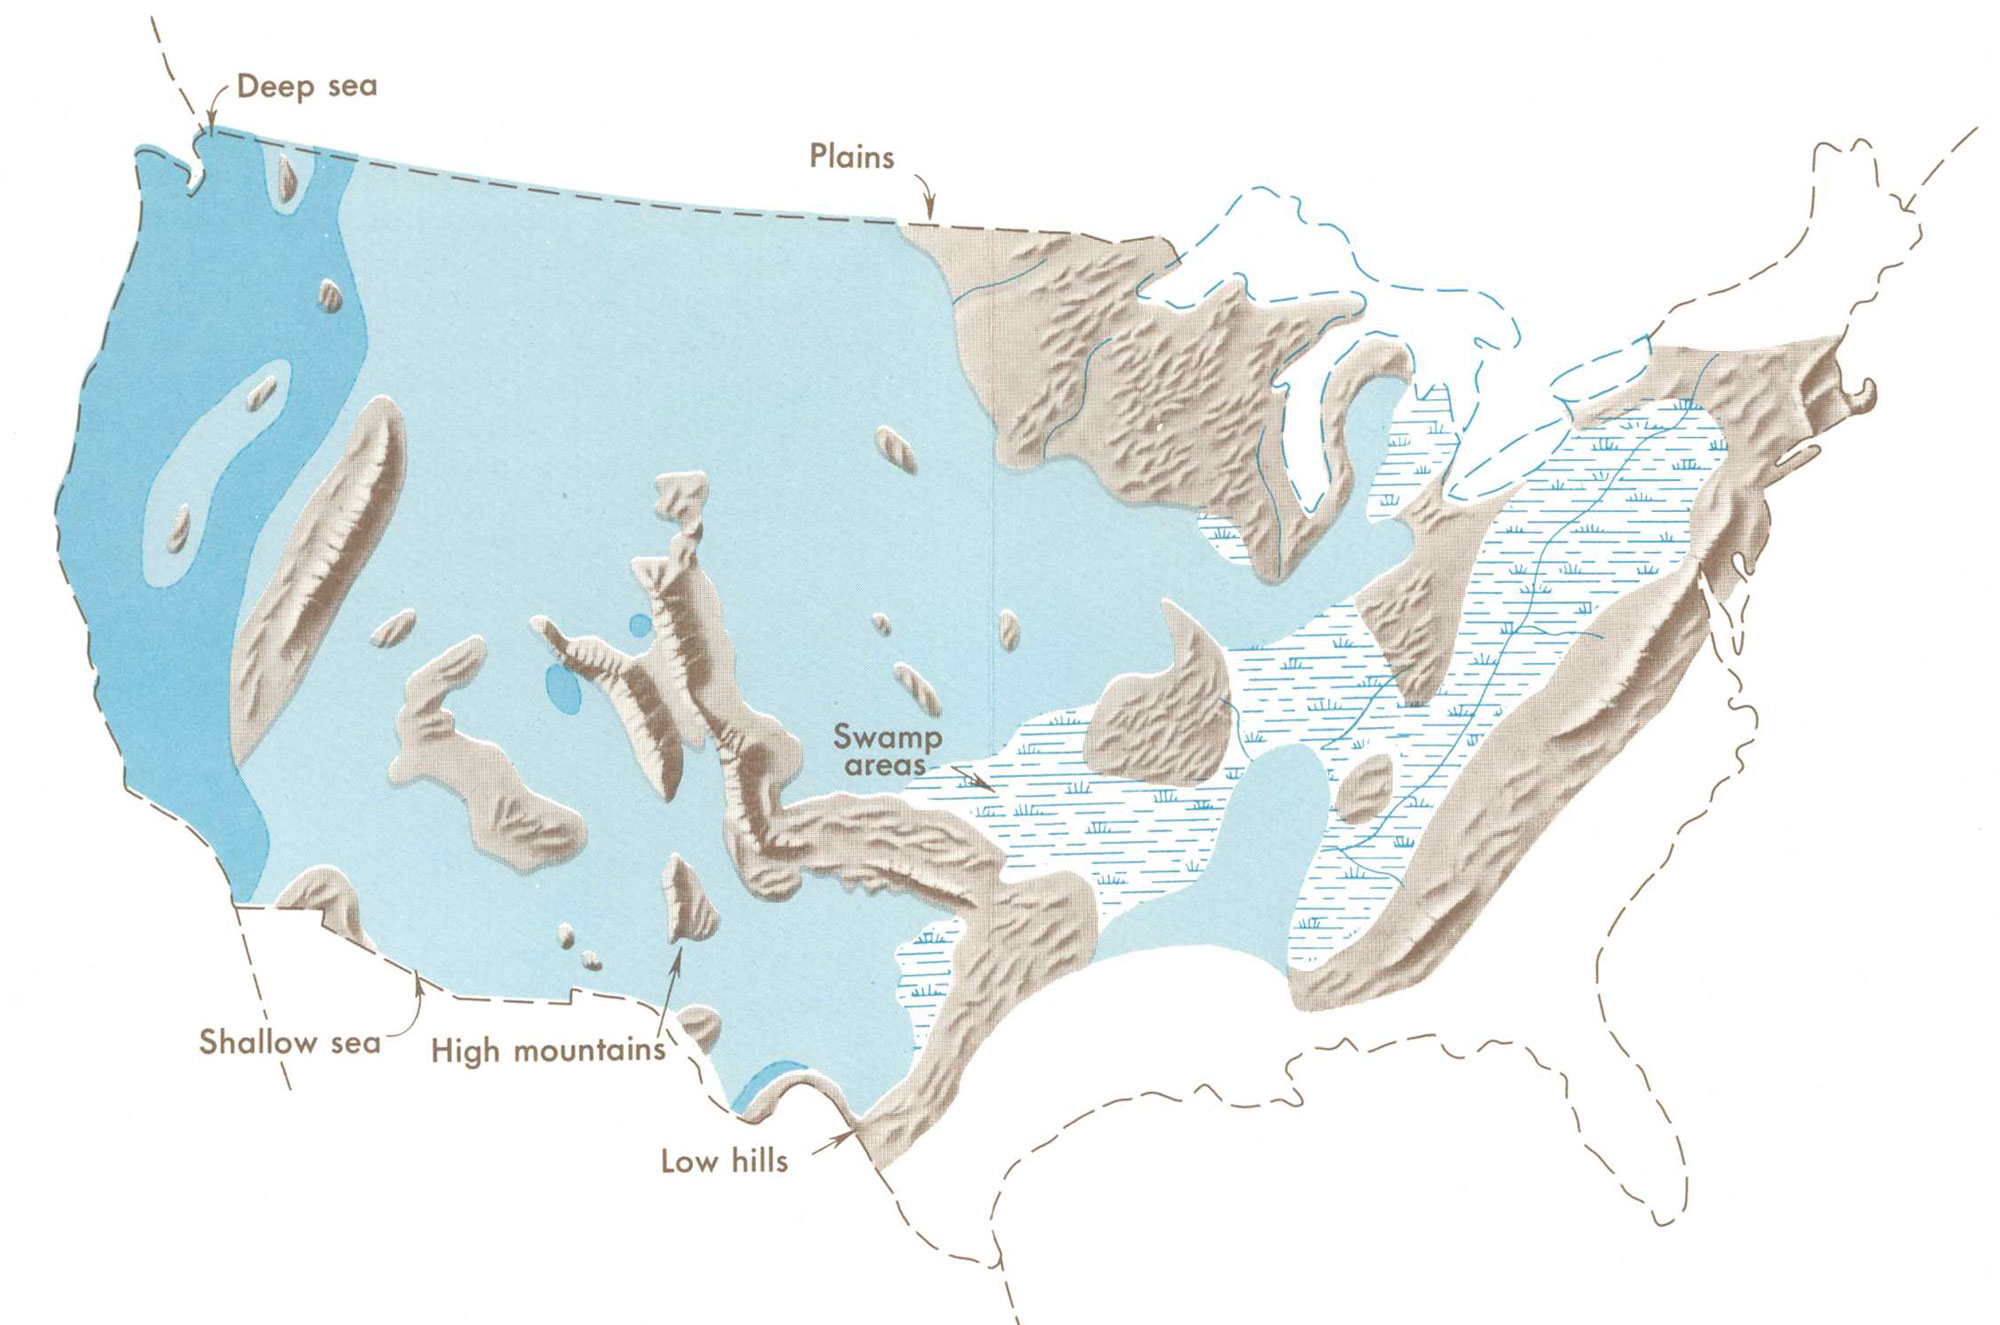
Distribution of Pennsylvanian swamps and highland areas relative to the outline of the modern United States. Map from Our changing continent, USGS Monograph, published 1969.
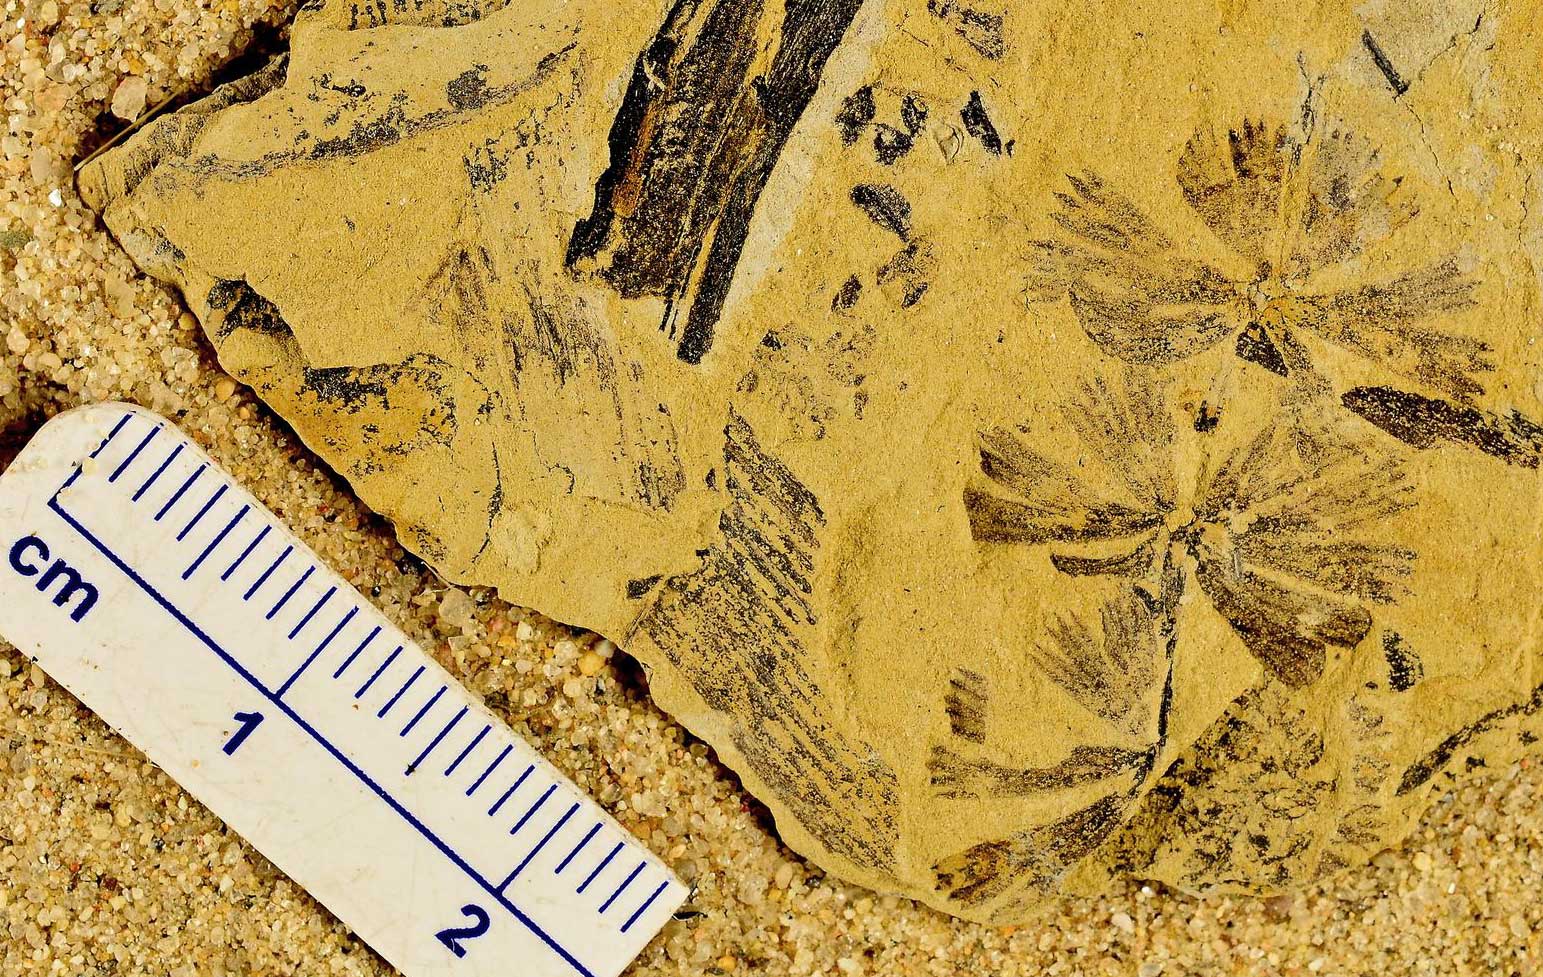
Fossil leaf whorls of Sphenophyllum, a shrubby plant related to modern horsetails (Equisetum), and sphenophyte stem fragments. Pennsylvanian (Late Carboniferous) Lawrence Shale, Lawrence, Kansas. Photo of YPM PB 000750 by Robert Swerling (YPM/Yale Peabody Museum of Natural History, CC0 1.0 Universal/Public Domain Dedication, accessed via Global Biodiversity Information Facility/GBIF.org).
During the Permian, sea levels dropped. Shallow marine waters gave way to lowland coastal areas, and most of the south-central U.S. became terrestrial. The Permian Basin in western Texas remained marine, however, and an enormous barrier reef formed around its rim. Part of this reef can be seen at El Capitan in Guadalupe Mountains National Park.
The Permian climate was drier than that of the Carboniferous, and extensive salt and gypsum deposits indicate that evaporation rates were high. A shift in plant type—from water-loving ferns and horsetails to plants better adapted for drier conditions—is further evidence of arid conditions during this time. By the end of the Permian, the southern ice sheets had disappeared, and desert conditions existed in the core of the supercontinent (as indicated, for example, by what look like sand dunes preserved in sedimentary rocks).
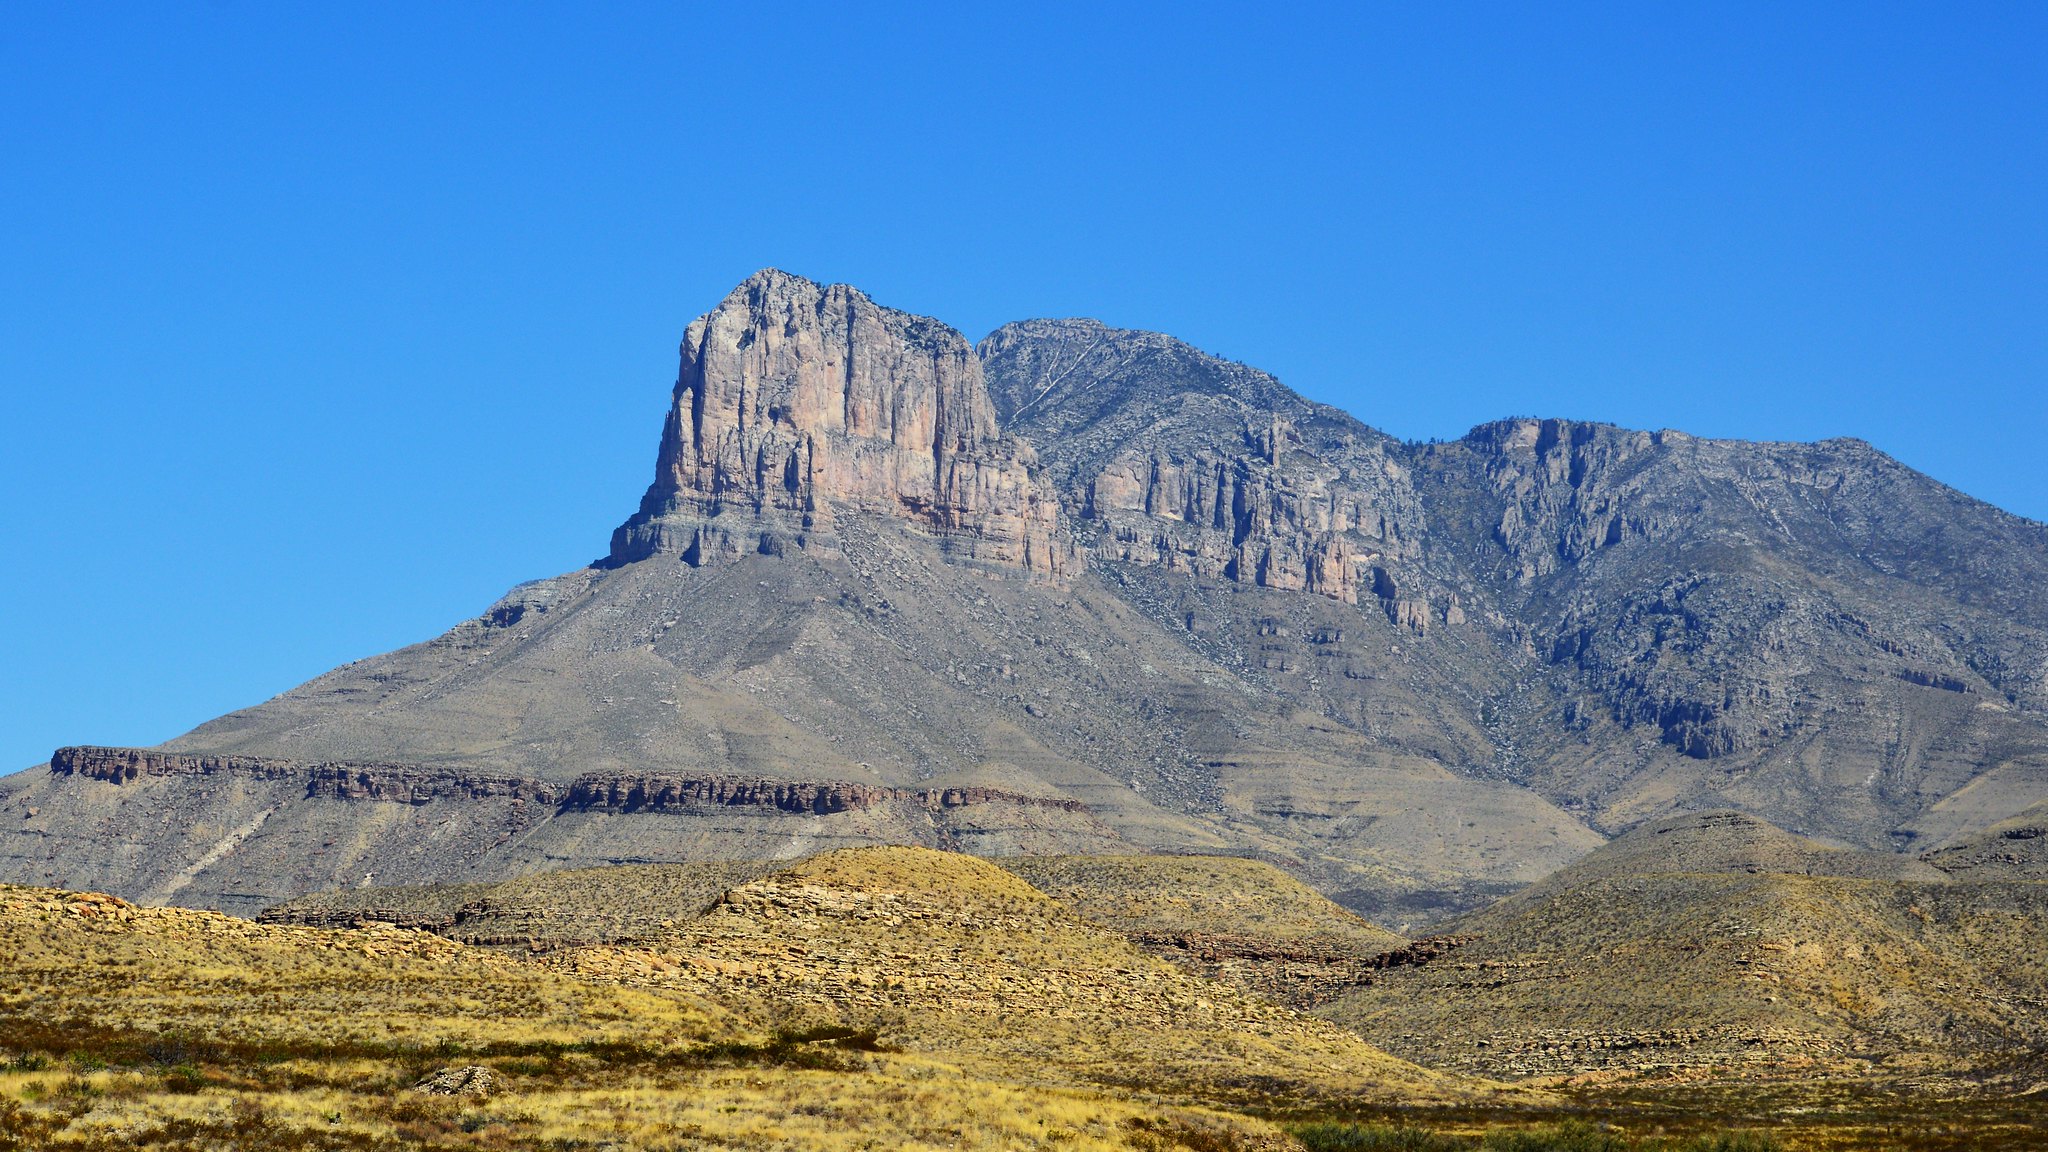
El Capitan, the southern end of the Guadalupe escarpment, is an ancient limestone reef. It rises to an elevation of 2458 meters (8064 feet). Photograph by Diann Bayes (Flickr; Creative Commons Attribution-NonCommercial-NoDerivs 2.0 Generic license).
Permian red beds with layers of gypsum (lighter-colored layers), Caprock Canyons State Park, Texas. Photo by Fredlyfish4 (Wikimedia Commons, Creative Commons Attribution-ShareAlike 3.0 Unported license, image resized).
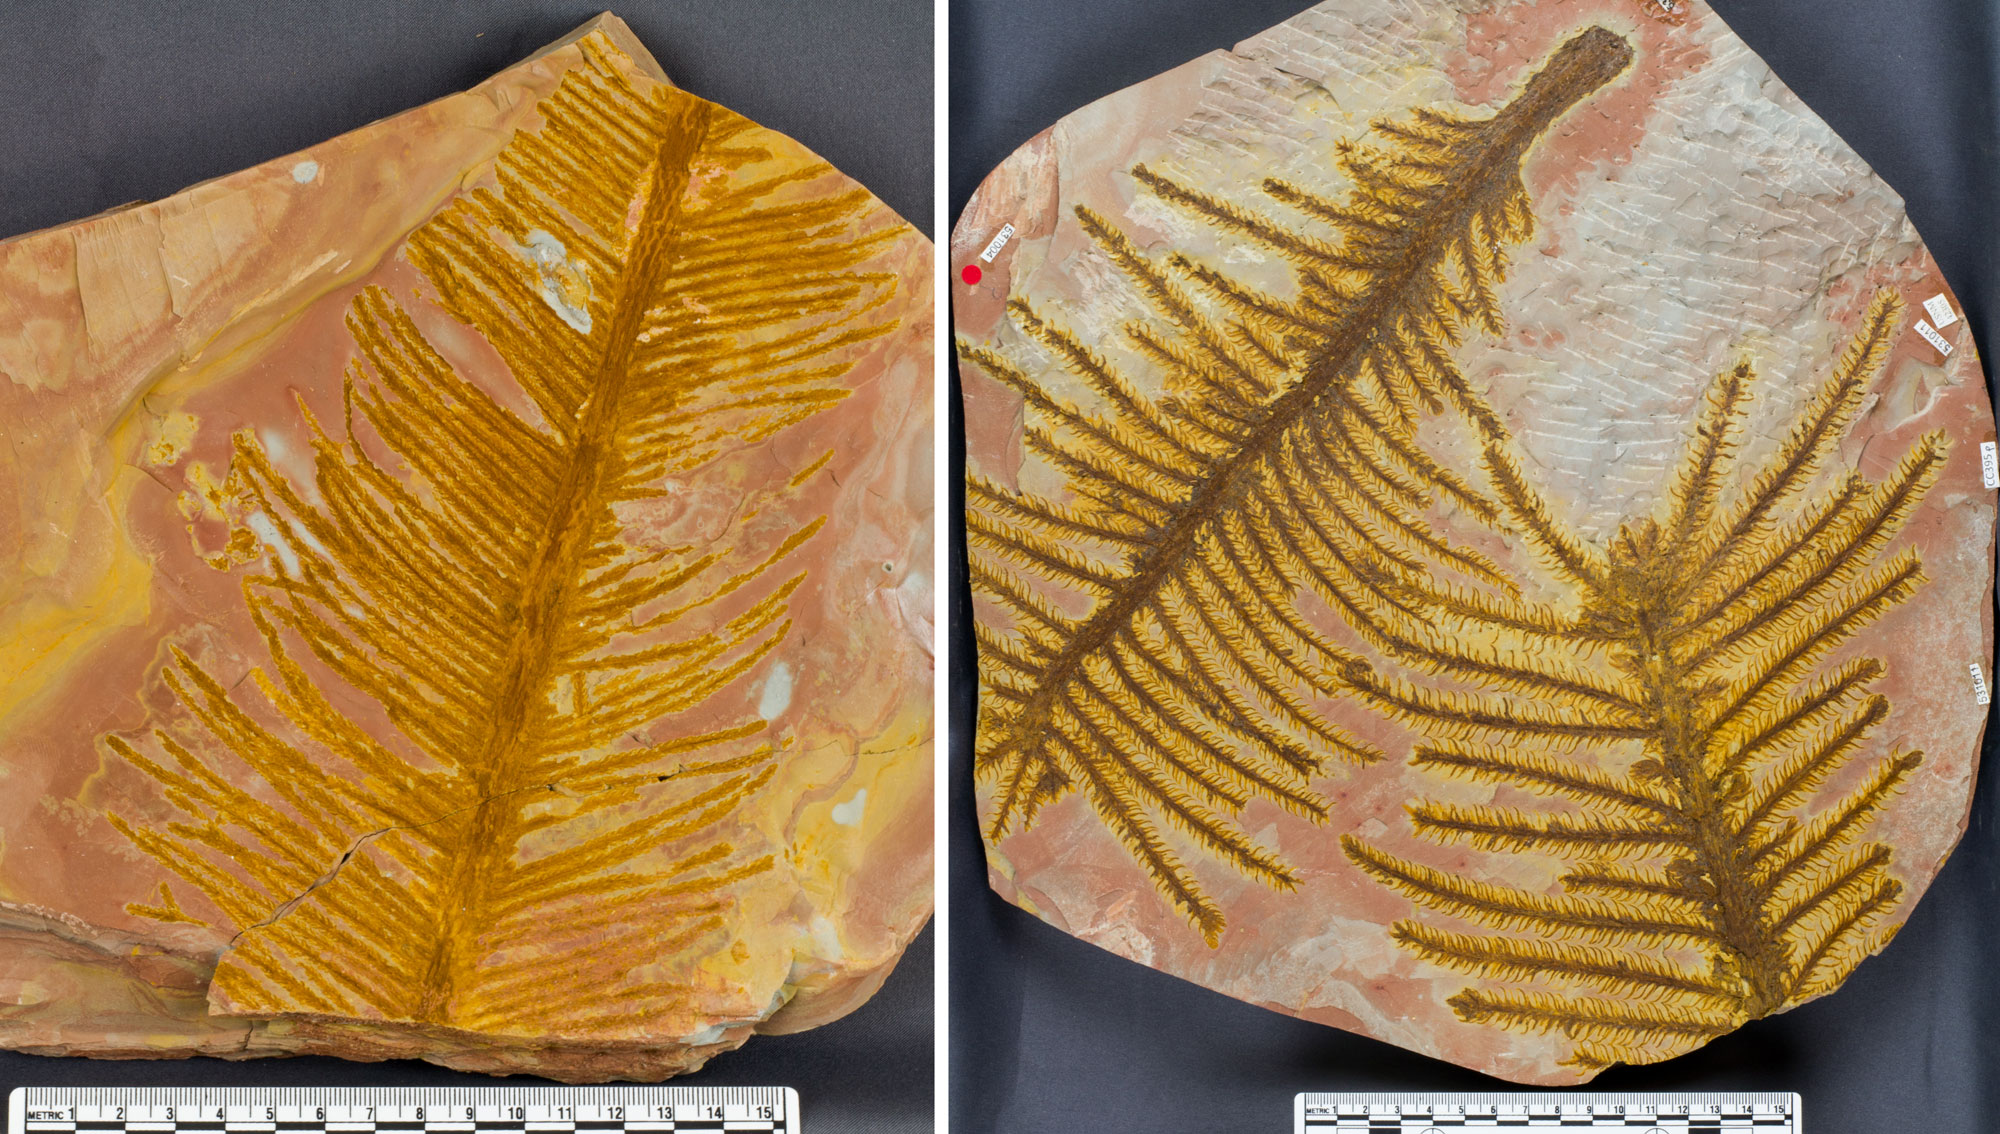
Walchia sp. branches and leaves, Permian, Clear Fork Group, Texas. Walchia is an early, extinct conifer. Photos of USNM 617446 (left) and USNM 531011 (right) by Bruce Martin (Smithsonian Institution, NMNH Paleobiology, public domain).
Mesozoic (252 to 66 million years ago)
Triassic to Jurassic (252 to 145 million years ago)
The Earth remained warm and ice-free at the poles through much of the Mesozoic era, until worldwide temperatures began to dip again around 150 million years ago. After reaching its greatest size during the Triassic period, Pangaea began to break apart into continents that would drift toward their modern-day positions.
Around 220 million years ago, the south-central U.S. moved north from the equator. The climate of the south-central U.S. gradually shifted, becoming wetter. Triassic rocks are known only from far western Oklahoma and Texas, where they contain a rich terrestrial and lake fauna of fishes, amphibians, and reptiles.
Jurassic outcrops in western Oklahoma are terrestrial and contain petrified wood, dinosaurs, and other reptiles indicative of lake environments, revealing that the environment there did not change much from the Triassic (except to become a bit wetter). Farther south, however, The breakup of Pangaea caused the Gulf of Mexico to open, flooding it with seawater. Because the climate was still relatively warm and dry, evaporation rates were high, and extremely thick deposits of salt accumulated there. These salt deposits have played a key role in trapping petroleum along the Gulf Coast. At the same time, the portion of the south-central U.S. that bordered the coastline began to subside, and thick deposits of coastal and marine sediments began to accumulate, a process that continues to this day.
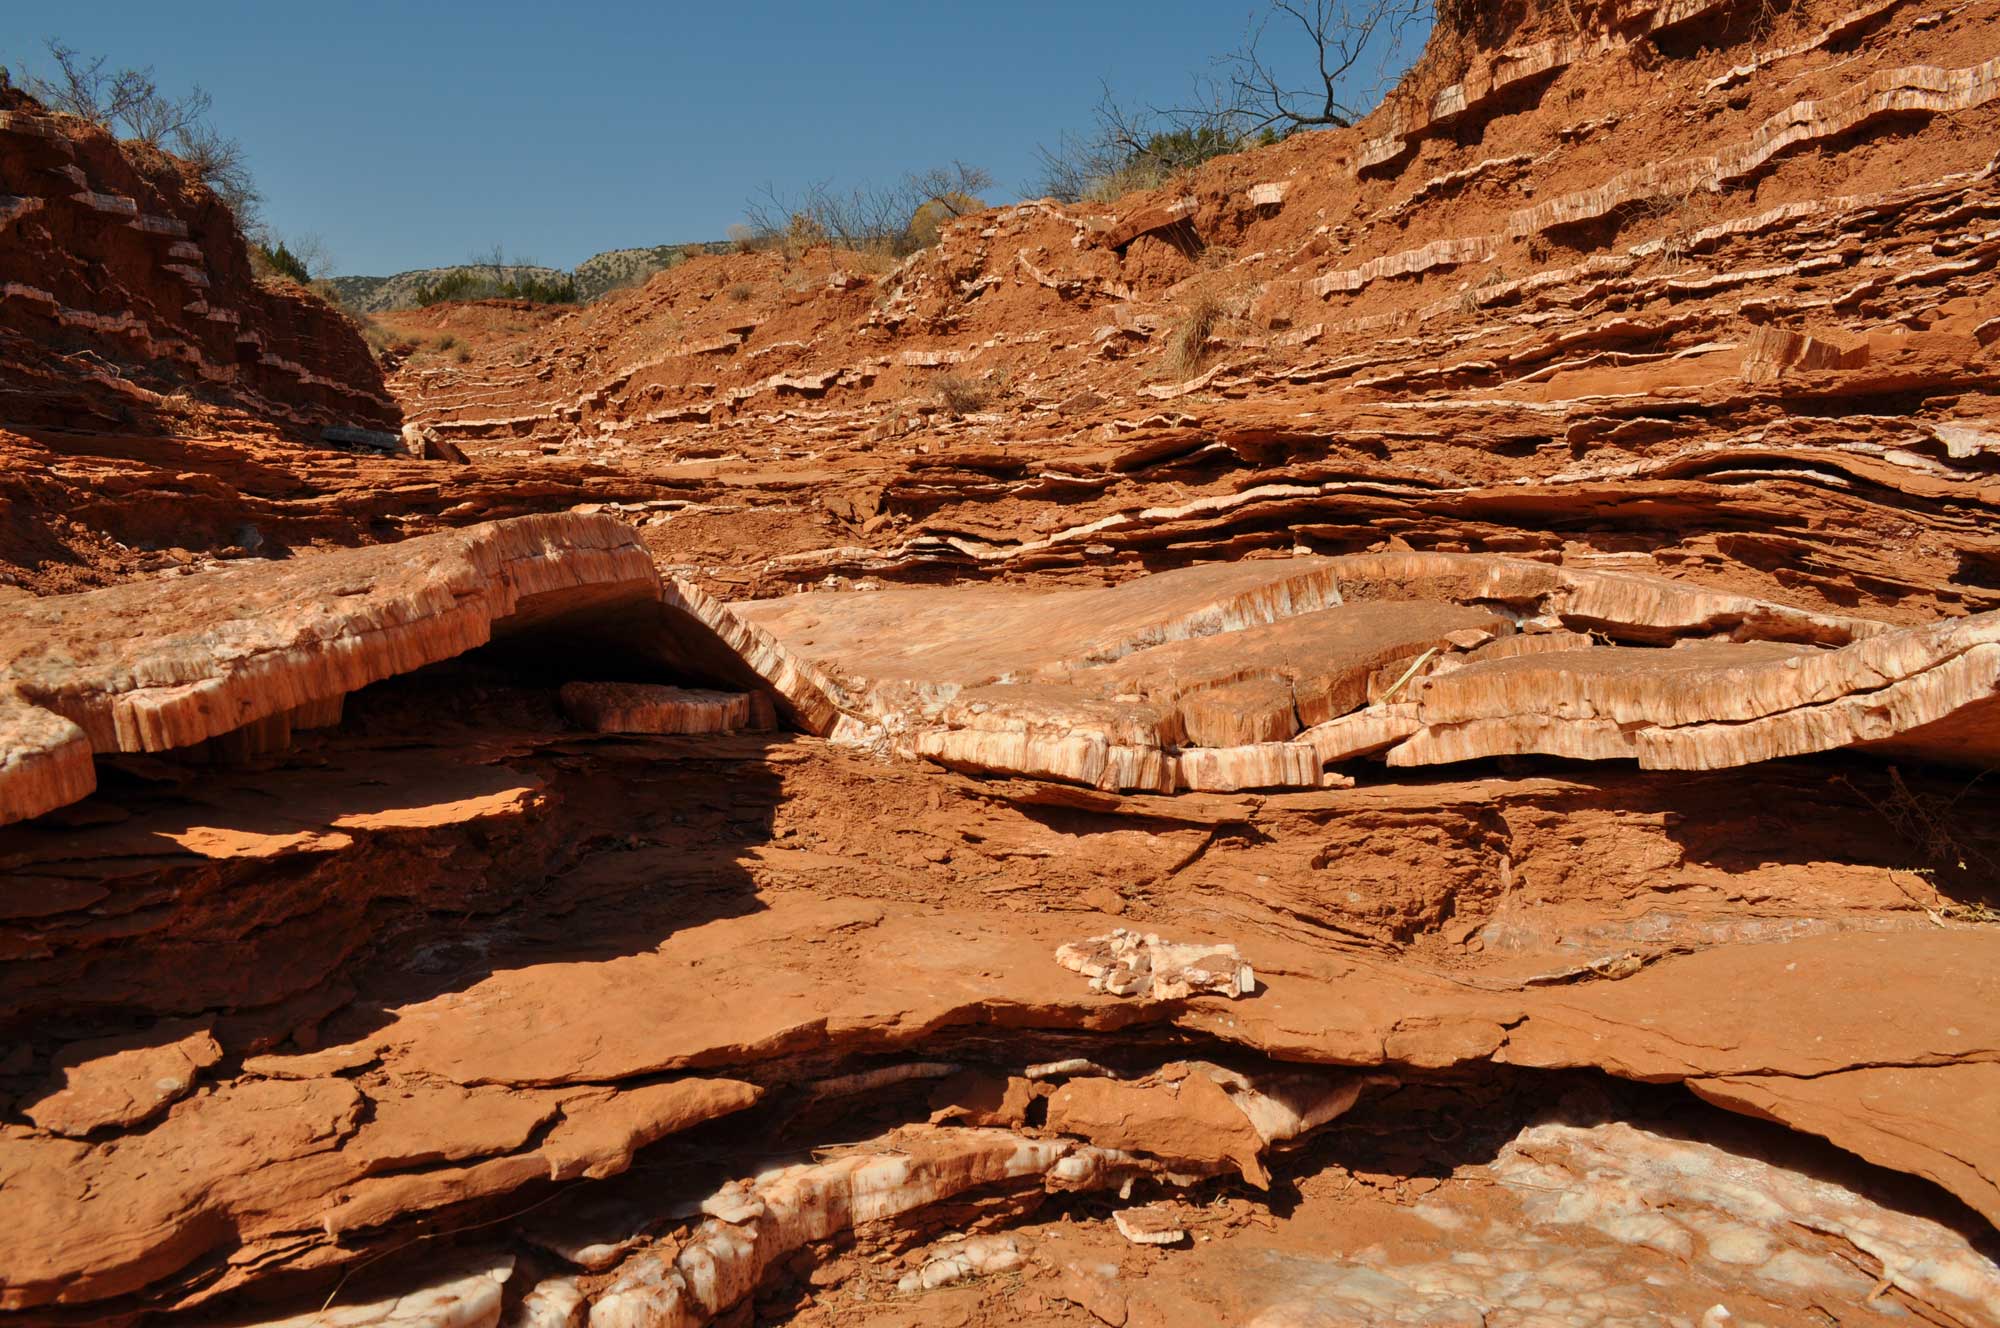
Palo Duro Canyon in the Texas Panhandle region (northern Texas) is made up primarily of Triassic rocks of the Tecovas and Trujillo formations (Dockum Group), which are overlain by late Cenozoic Ogallala Formation rocks. Photograph by "sarowen" (Flickr; Creative Commons Attribution-NonCommercial-NoDerivs 2.0 Generic license).
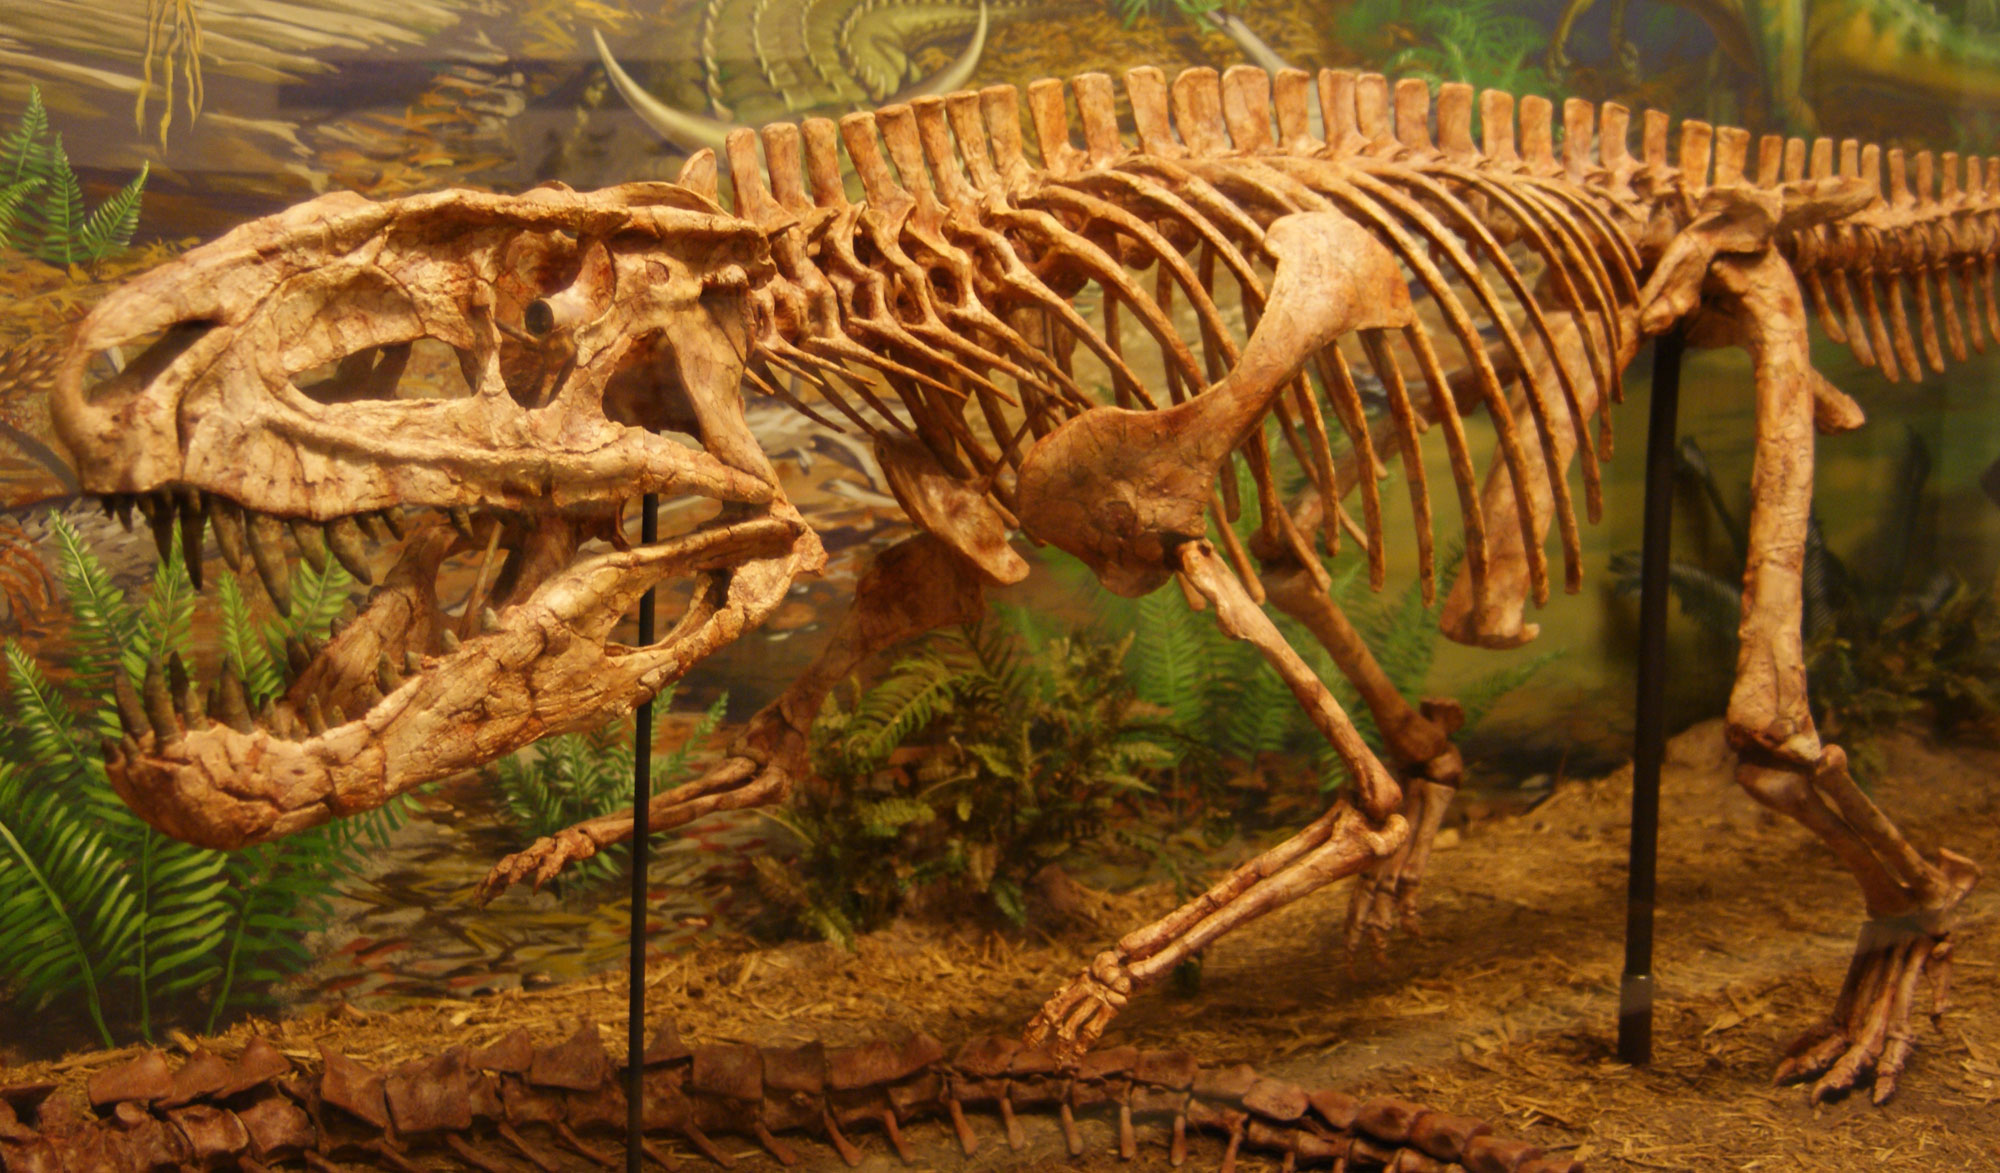
Postosuchus kirkpatricki, a Triassic archosaur first described from material found at the Post Quarry site, Garza County, Texas. Photo of a specimen on display at the Museum of Texas Tech University by Dallas Krentzel (Wikimedia Commons, Creative Commons Attribution 2.0 Generic license, image cropped and resized).
Cretaceous (145 to 66 million years ago)
The Earth warmed near the beginning of the Cretaceous, and sea level rose. Throughout the Cretaceous, sea level was as much as 100 meters (330 feet) higher than it is today, largely as a result of water displacement by continental rifting and rapid sea-floor spreading. Shallow seaways spread over many of the continents. Global temperatures during the Cretaceous were very warm, as much as 10°C (18°F) above present. There was likely little or no glacial ice anywhere on Earth, and temperatures were highest in lower latitudes.
By the start of the Late Cretaceous, North America was divided in two by an inland sea known as the Western Interior Seaway. This sea flooded most of the south-central U.S., covering older rocks and creating a wide belt of rock that is Cretaceous and younger in age. This belt forms the Coastal Plain region and extends many hundreds of miles up the Mississippi River and covers all of Louisiana, about half of Texas, and parts of Arkansas, Oklahoma, and Missouri.
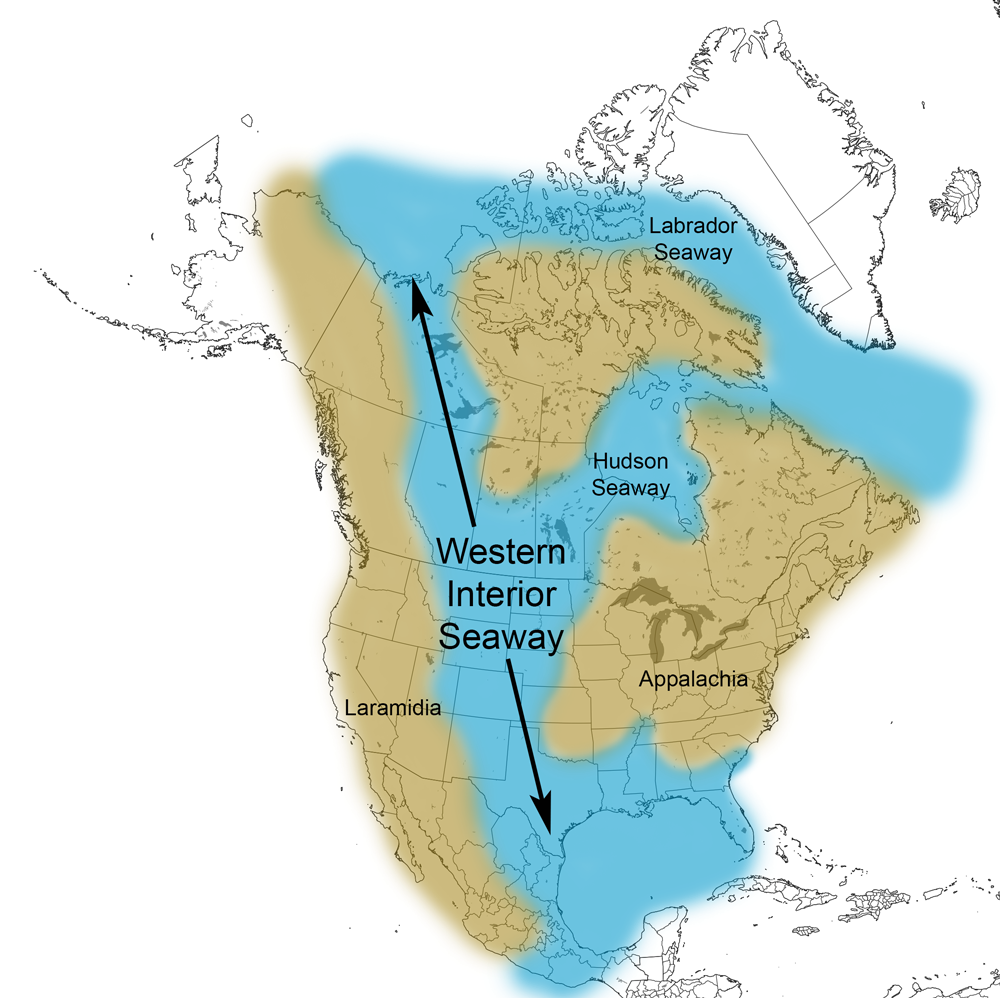
Extent of the Western Interior Seaway during the Cretaceous Period. Image from Cretaceous Atlas of Ancient Life: Western Interior Seaway (Creative Commons Attribution-NonCommercial-ShareAlike 4.0 International license).
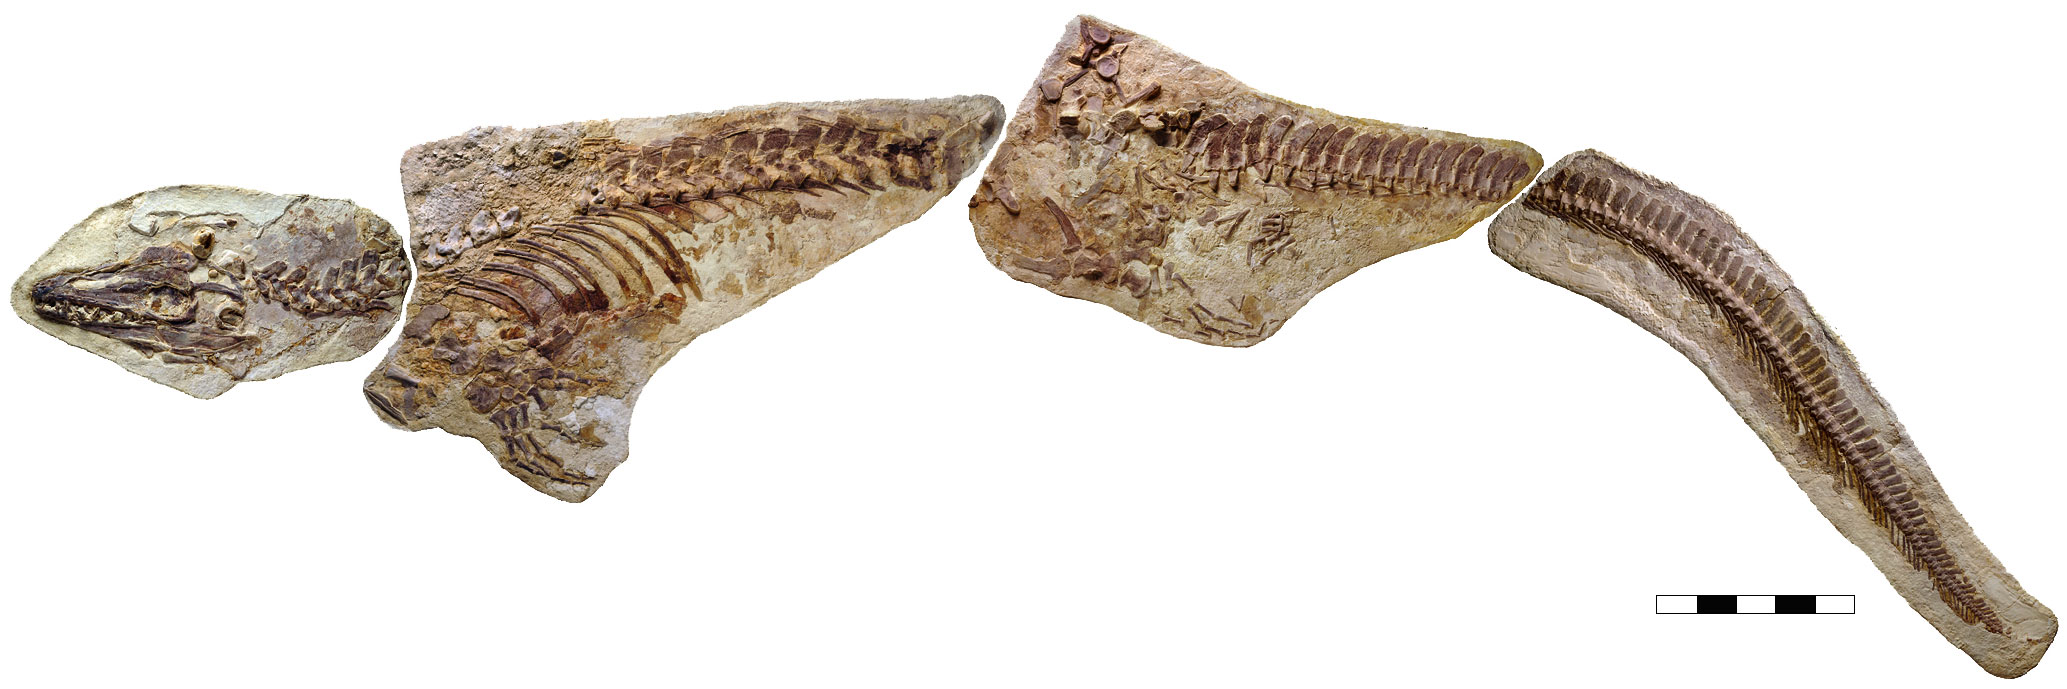
Skeleton of Platecarpus tympaniticus, a mosasaur from the Niobrara Chalk of Logan County, Kansas. Scale bar is 0.5 meters (about 1.6 feet), specimen is 5.67 meters (about 18.6 feet) long. Photo of specimen LACM 128319, specimen in the collections of the Natural History Museum of Los Angeles County, fig. 1 from J. Lindgren, M. W. Caldwell, T. Konishi, and L. M. Chiappe (2010) PLoS ONE 5(8): E11998 (Creative Commons Attribution license).
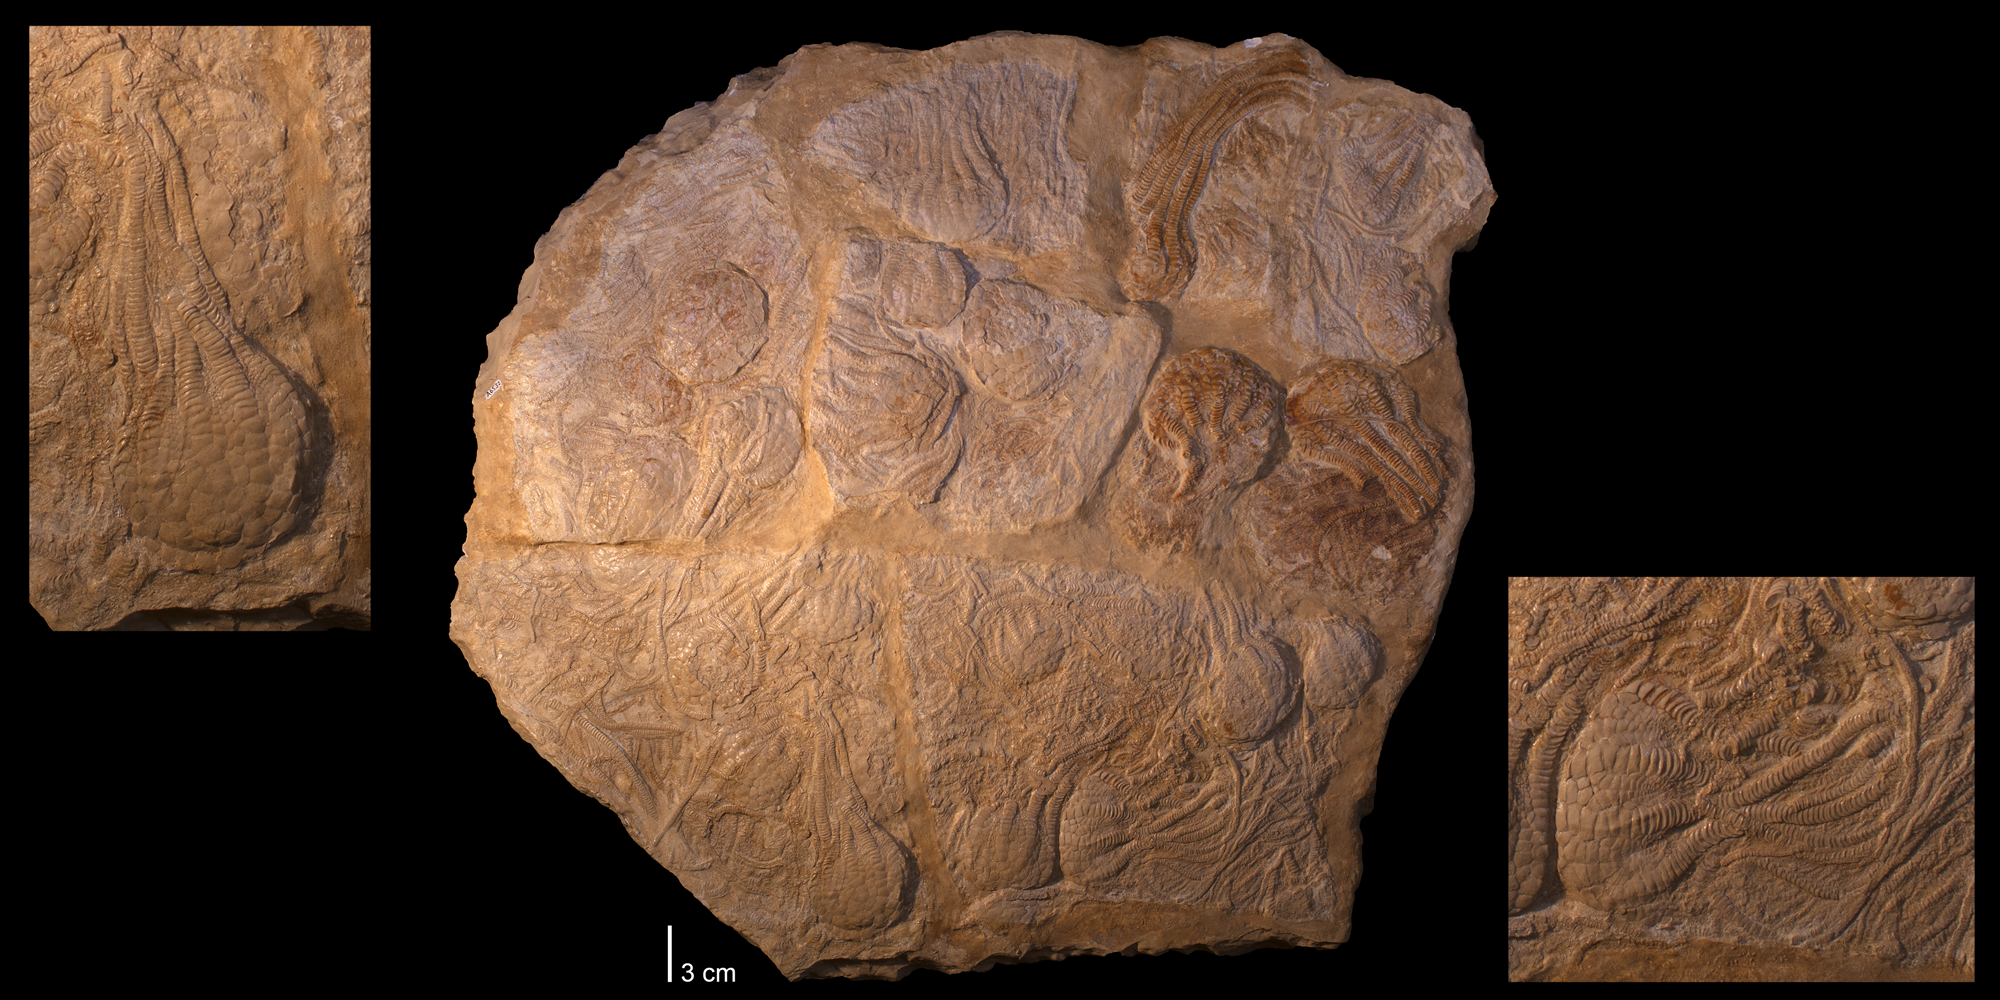
Crinoids (Uintacrinus socialis) from the Niobrara Chalk, Kansas. Photo of Yale Peabody Museum of Natural History specimen YPM 236986 from Cretaceous Atlas of Ancient Life: Western Interior Seaway (Creative Commons Attribution-NonCommercial-ShareAlike 4.0 International License).
At the close of the Cretaceous, 66 million years ago, global climates (though still much warmer than those of today) were cooler than at the era’s start. At the very end of the Cretaceous, the Gulf Coast experienced an enormous disruption when an asteroid or comet collided with Earth in what is now the northern Yucatán Peninsula in Mexico, just a few hundred miles away from the south-central U.S. The impact vaporized both water and rock, blocking out sunlight for weeks to years, leading to a collapse of photosynthesis and food webs on land and in the oceans. After this event, the climate may have cooled briefly, but it soon rebounded to a warmer state. It continued to warm into the Eocene.
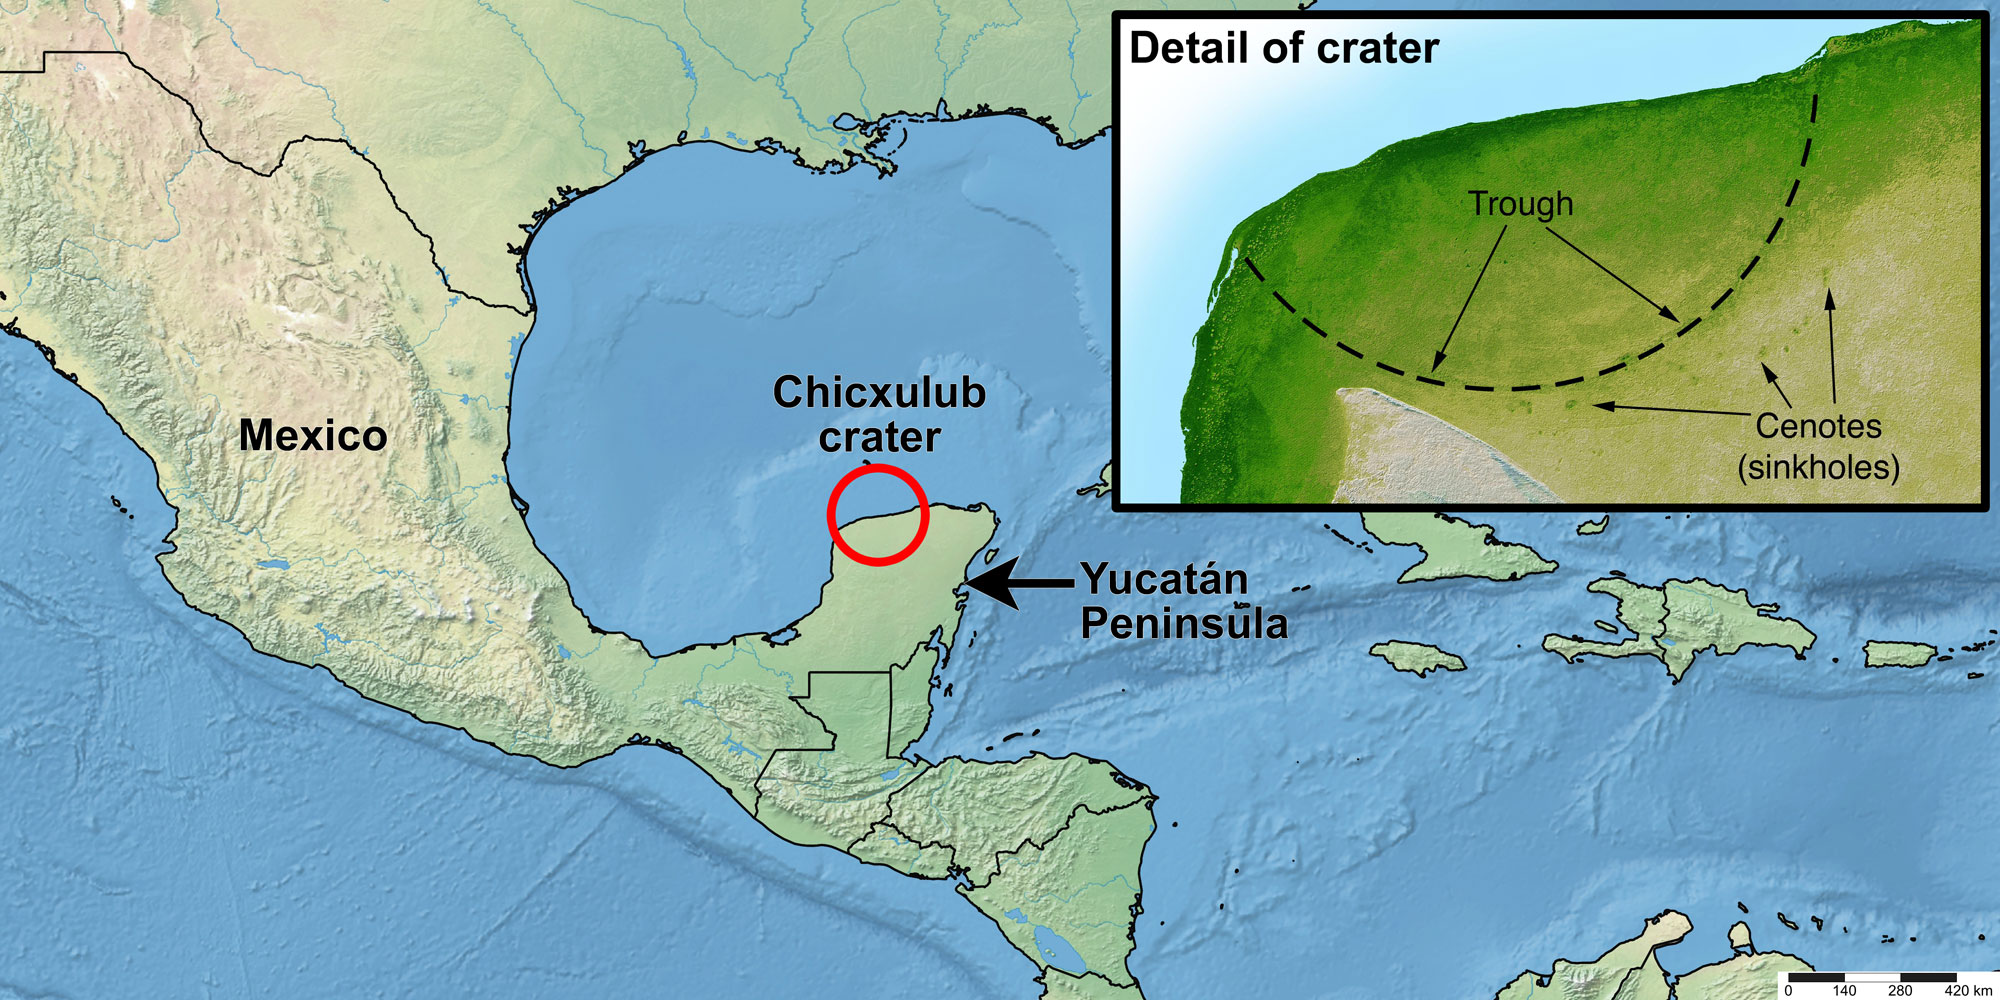
Map of the modern Yucatán Peninsula region showing the location of the Chicxulub impact crater. The inset image is a shaded relief image that shows the edge of the crater on the Yucatán Peninsula with sinkholes in the rock surrounding it. Map made by Elizabeth J. Hermsen using Simplemappr and modified in Photoshop. Inset image from the NASA Jet Propulsion Laboratory (PIA03397).
Cenozoic (66 million years ago to present)
Paleogene to Neogene (66 to 2.6 million years ago)
By the early Cenozoic, the continents had approached their modern configuration, and India began to collide with Eurasia to form the Himalayas. The formation of the Himalayas had a significant impact on global climate, as the newly exposed rock began to serve as a sink to take up atmospheric CO2. With the reduction of this greenhouse gas, global temperatures cooled. Antarctica moved south, and by 30 million years ago, temperatures were low enough that glaciers began to grow on its mountains.
Around 3.5 million years ago, glacial ice began to form over the Arctic Ocean and on the northern parts of North America and Eurasia. A major contributing factor to this event was a geological change the emergence of the Isthmus of Panama, which was formed by undersea volcanoes. The new dry-land isthmus blocked the warm ocean currents that had been flowing east-to-west from the Atlantic to the Pacific for more than 100 million years. These currents were diverted into the Gulf of Mexico and ultimately into the western Atlantic Gulf Stream.
During this time, the south-central U.S. continued to accumulate sediment brought in by myriad rivers, including the antecedents to the Mississippi River. Sea level dropped, and the continued withdrawal of the sea is reflected in almost-parallel belts of progressively younger rocks that extend toward the Gulf Coast.
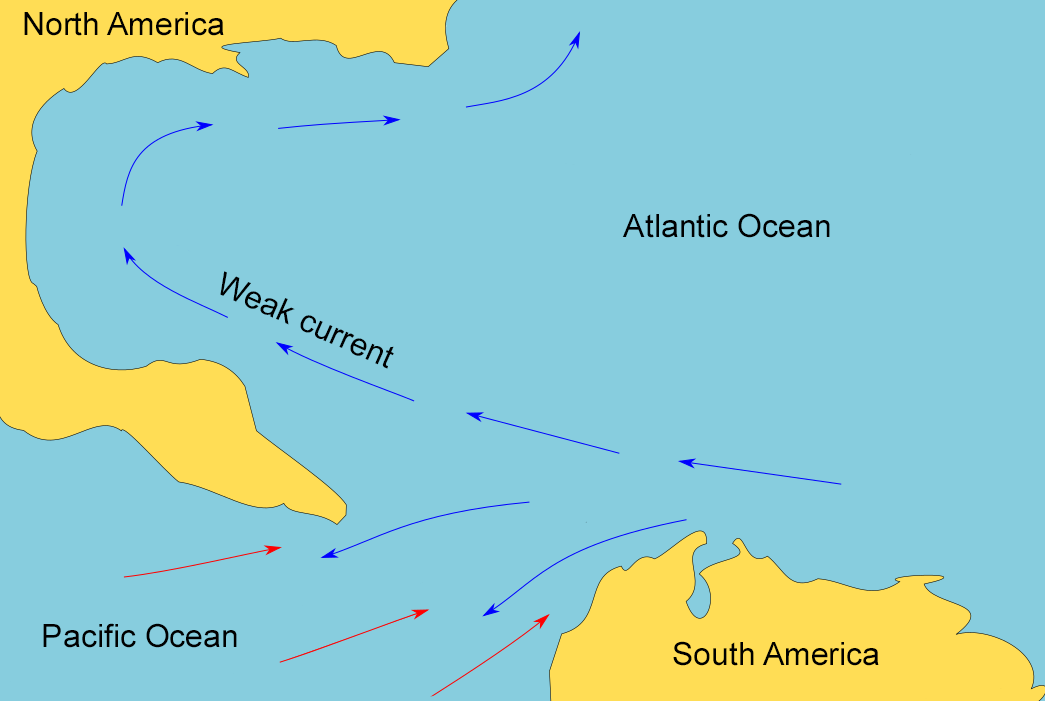
Map of the Gulf of Mexico region before the closure of the Isthmus of Panama. Before the Isthmus closed, the Atlantic and Pacific oceans were connected. Map modified from a map by Chiche Ojeda (Wikimedia Commons, Creative Commons Attribution-ShareAlike 4.0 International license, image cropped and modified).
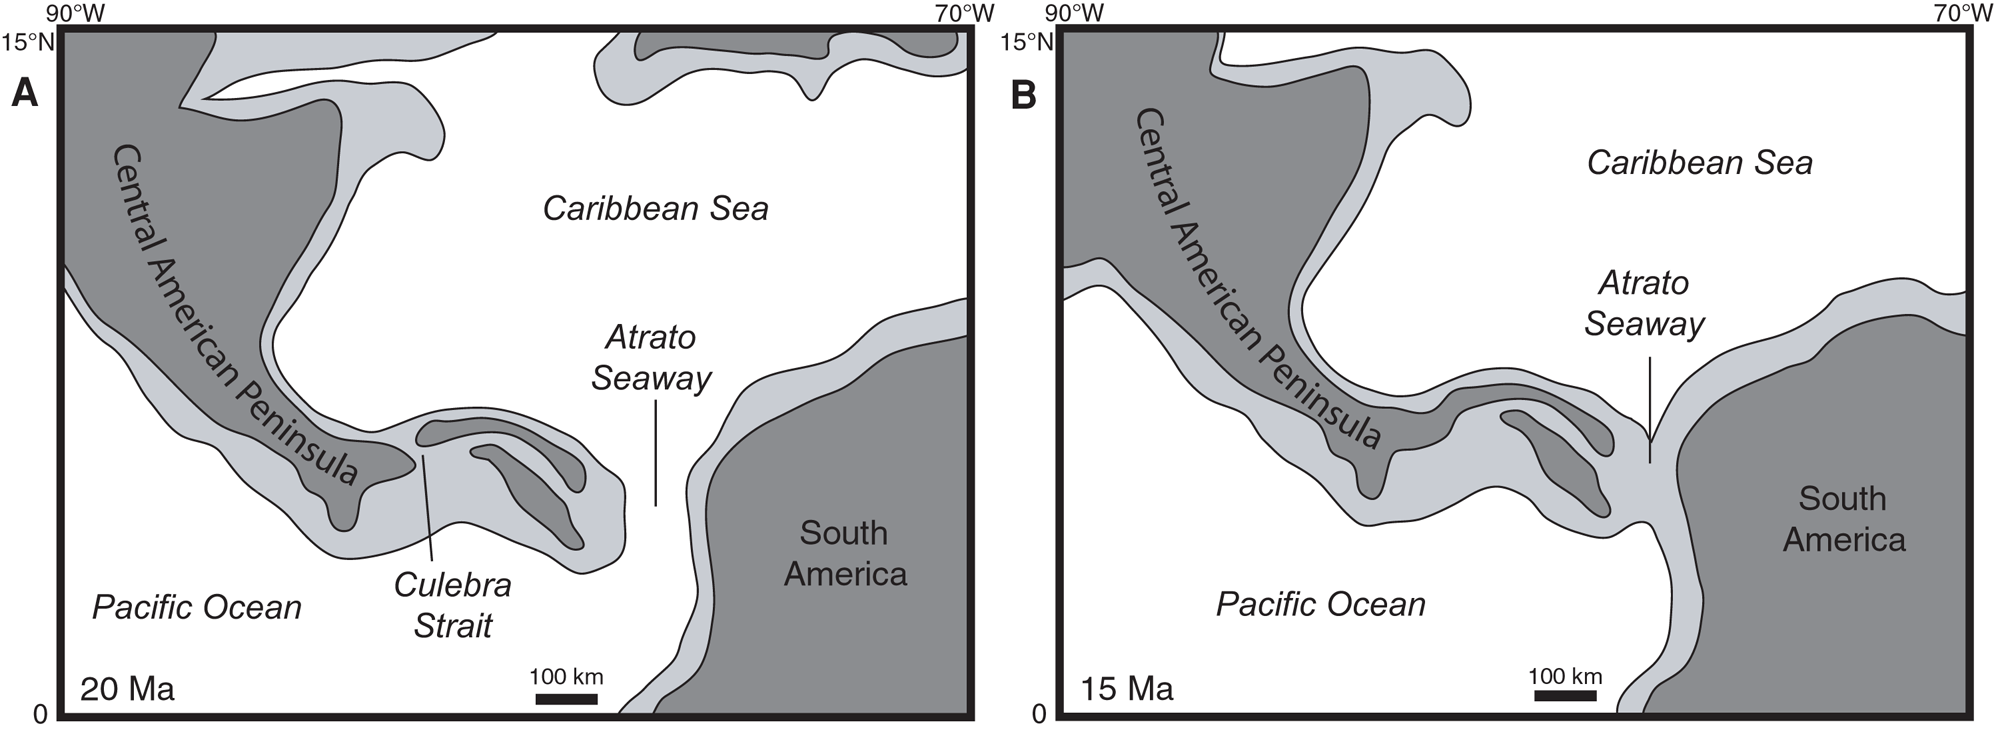
Maps showing the progressive closure of the Isthmus of Panama at 20 million years ago (A) and 15 million years ago (B). Dark gray is land, white and light gray are submerged areas. Modified from Figure 11 in Kirby et al. (2011) PLoS ONE 3(7): e2791 (Creative Commons Attribution license, image reorganized and resized).
Quaternary (2.6 million years ago to present)
Eventually, a sheet of sea ice formed over the Arctic, and ice sheets spread over northern Asia, Europe, and North America, signaling the start of the most recent ice age. Since 800,000 years ago, an equilibrium has been reached between warming and cooling, with the ice caps growing and retreating primarily due to the influence of astronomical forces (i.e., the combined gravitational effects of the Earth, Sun, moon, and planets).
The ice reached northern Missouri and northeastern Kansas during its maximum extent, while the rest of the south-central U.S. merely experienced a cooler climate than it does at present. The area was also somewhat wetter than it is today, with wetlands and forests covering much of what would later become grassland. Rocks of this age contain fossils of terrestrial vertebrates such as horses, camels, bison, mastodons, and mammoths. Much of the Mississippi River’s great delta and alluvial fan was deposited when the glacial ice melted, creating rivers that eroded older rocks and carried sediments previously scoured by the glaciers.
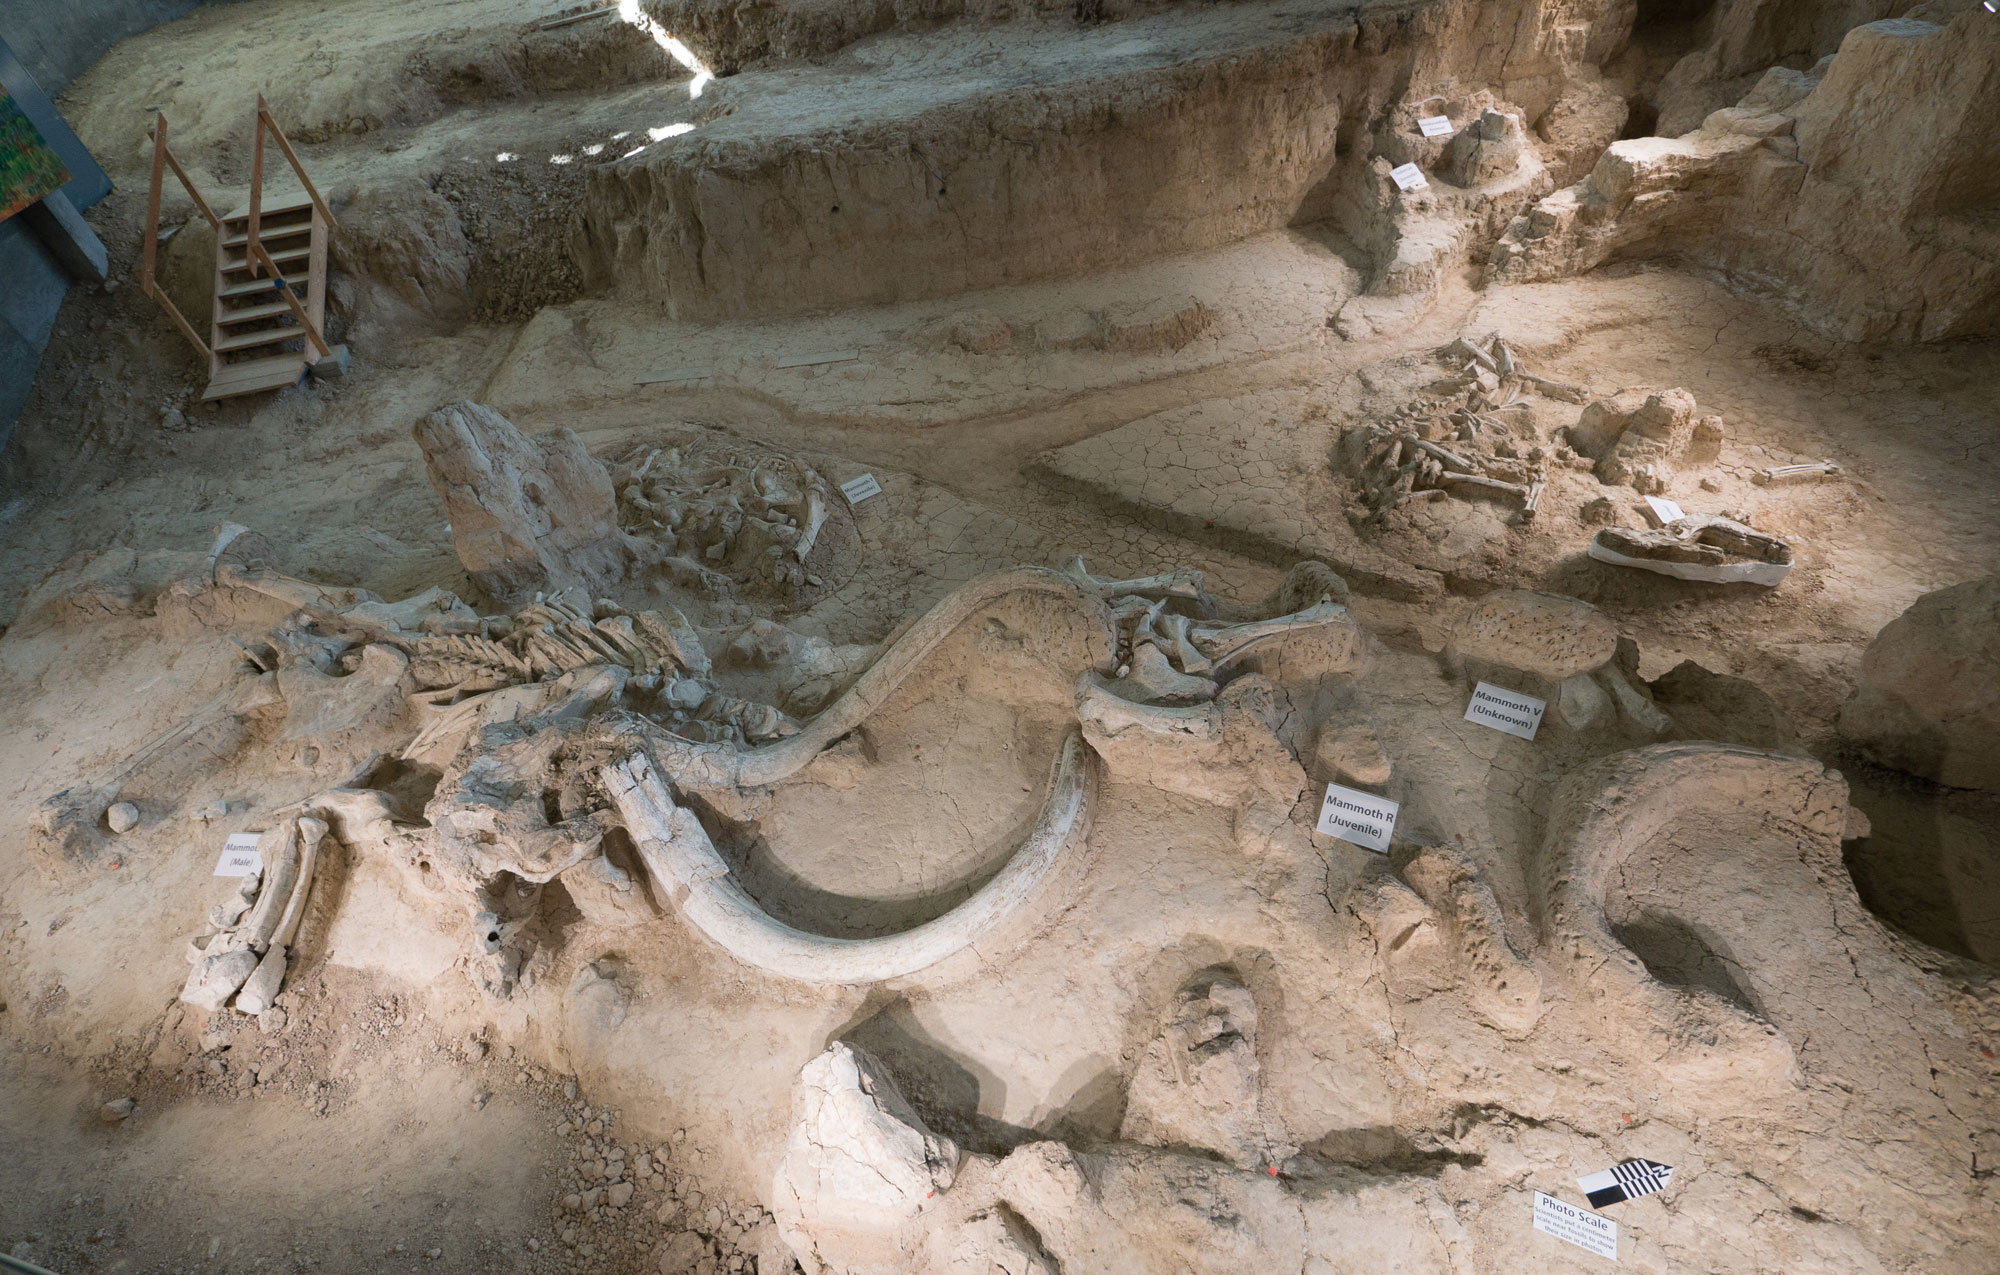
Excavation at Waco Mammoth National Monument. Skeletons of several Columbian mammoths are marked, including a male mammoth (left, with large tusks), a juvenile (right) and part of an unknown mammoth (behind the juvenile). Photo taken in 2017 by Jay Galvin (flickr, Creative Commons Attribution 2.0 Generic license, image cropped and resized).
Future climate of the south-central U.S.
The south-central U.S. contributes significantly to climate change. The population of any industrialized and particularly wealthy country produces pollution. The 48 million residents of the south-central states use electricity, transportation, and products that come from carbon-rich fossil fuels. Burning fossil fuels releases carbon into the atmosphere, which warms the Earth. Of the south-central states, Texas emits by far the most greenhouse gases. The highest greenhouse gas emitter in the nation, Texas released over 700 million metric tons of CO2 per year in 2017, nearly double that of California, the second largest emitter. The majority of these emissions come from the use of petroleum.
On the other hand, south-central states are making changes to reduce human impact on the climate. Texas, for example, has greatly reduced its carbon emissions. The city of Dallas was an early adopter of the 2030 Challenge, an effort by cities to reduce fossil fuel use in buildings so that both new and renovated buildings would qualify as carbon neutral by the year 2030. Additionally, many states are stepping up their use and production of renewable energy. The strong winds in the south-central U.S. make it a region with high potential for wind energy generation, and Texas was by far the state with the highest utility-scale wind electricity generation in 2020, producing 93 billion kWh of electricity (Iowa, in 2nd place, produced 34 billion kWh.) Of all fifty states, Kansas had the largest percentage increase in renewable energy production from 2010 to 2019.
Trends and predictions
Studies show that the south-central states' climate is changing right now and that change has accelerated in the latter part of the 20th century. These changes include the following:
- The number of days with temperatures above 35°C (95°F) and nights above 24°C (75°F) has been steadily increasing since 1970.
- The city of St. Louis experiences about four heat waves lasting three days or longer each summer, a number which has doubled over the last 60 years.
- Locations along the Gulf of Mexico have experienced over 20 centimeters (8 inches) of sea level rise in the last 50 years.
- In 2011, Texas experienced the worst one-year drought in state history, exacerbated by temperatures almost 3°C (5°F) above normal. The drought cost the state $7.6 billion in agricultural losses.
- The Ogalalla Aquifer, which provides fresh water to much of the south-central U.S., has been depleted by more than 40% in some areas, thanks to years of decreased rainfall.
- Altered flowering patterns due to more frost-free days have increased the south-central states' pollen season for ragweed, a potent allergen, by 16 days since 1995.
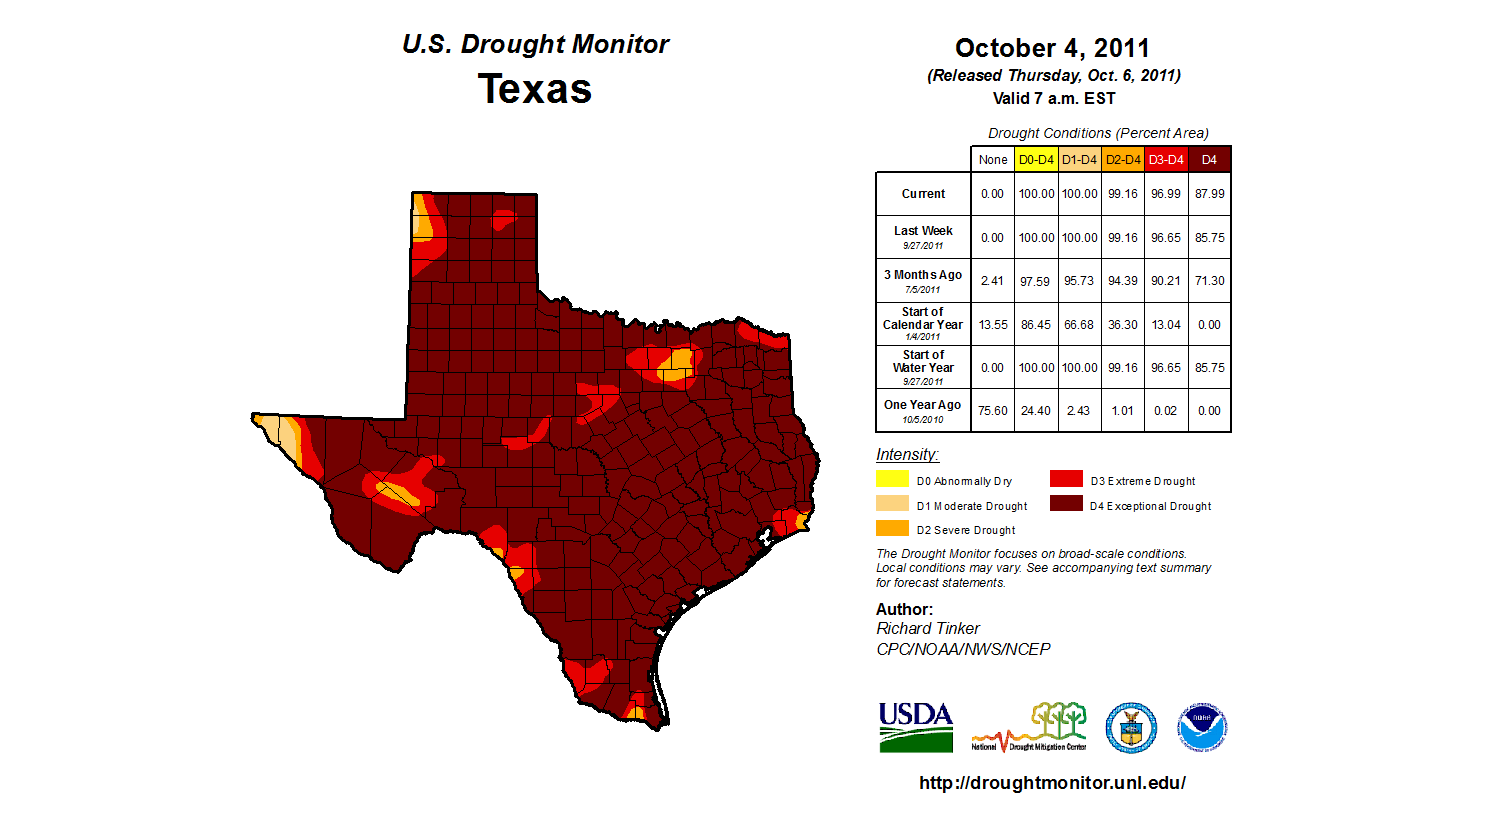
Map showing the extent of the 2011 drought in Texas. Source: droughtmonitor.unl.edu (via Wikimedia Commons, Creative Commons Attribution-ShareAlike 4.0 International license, image resized).
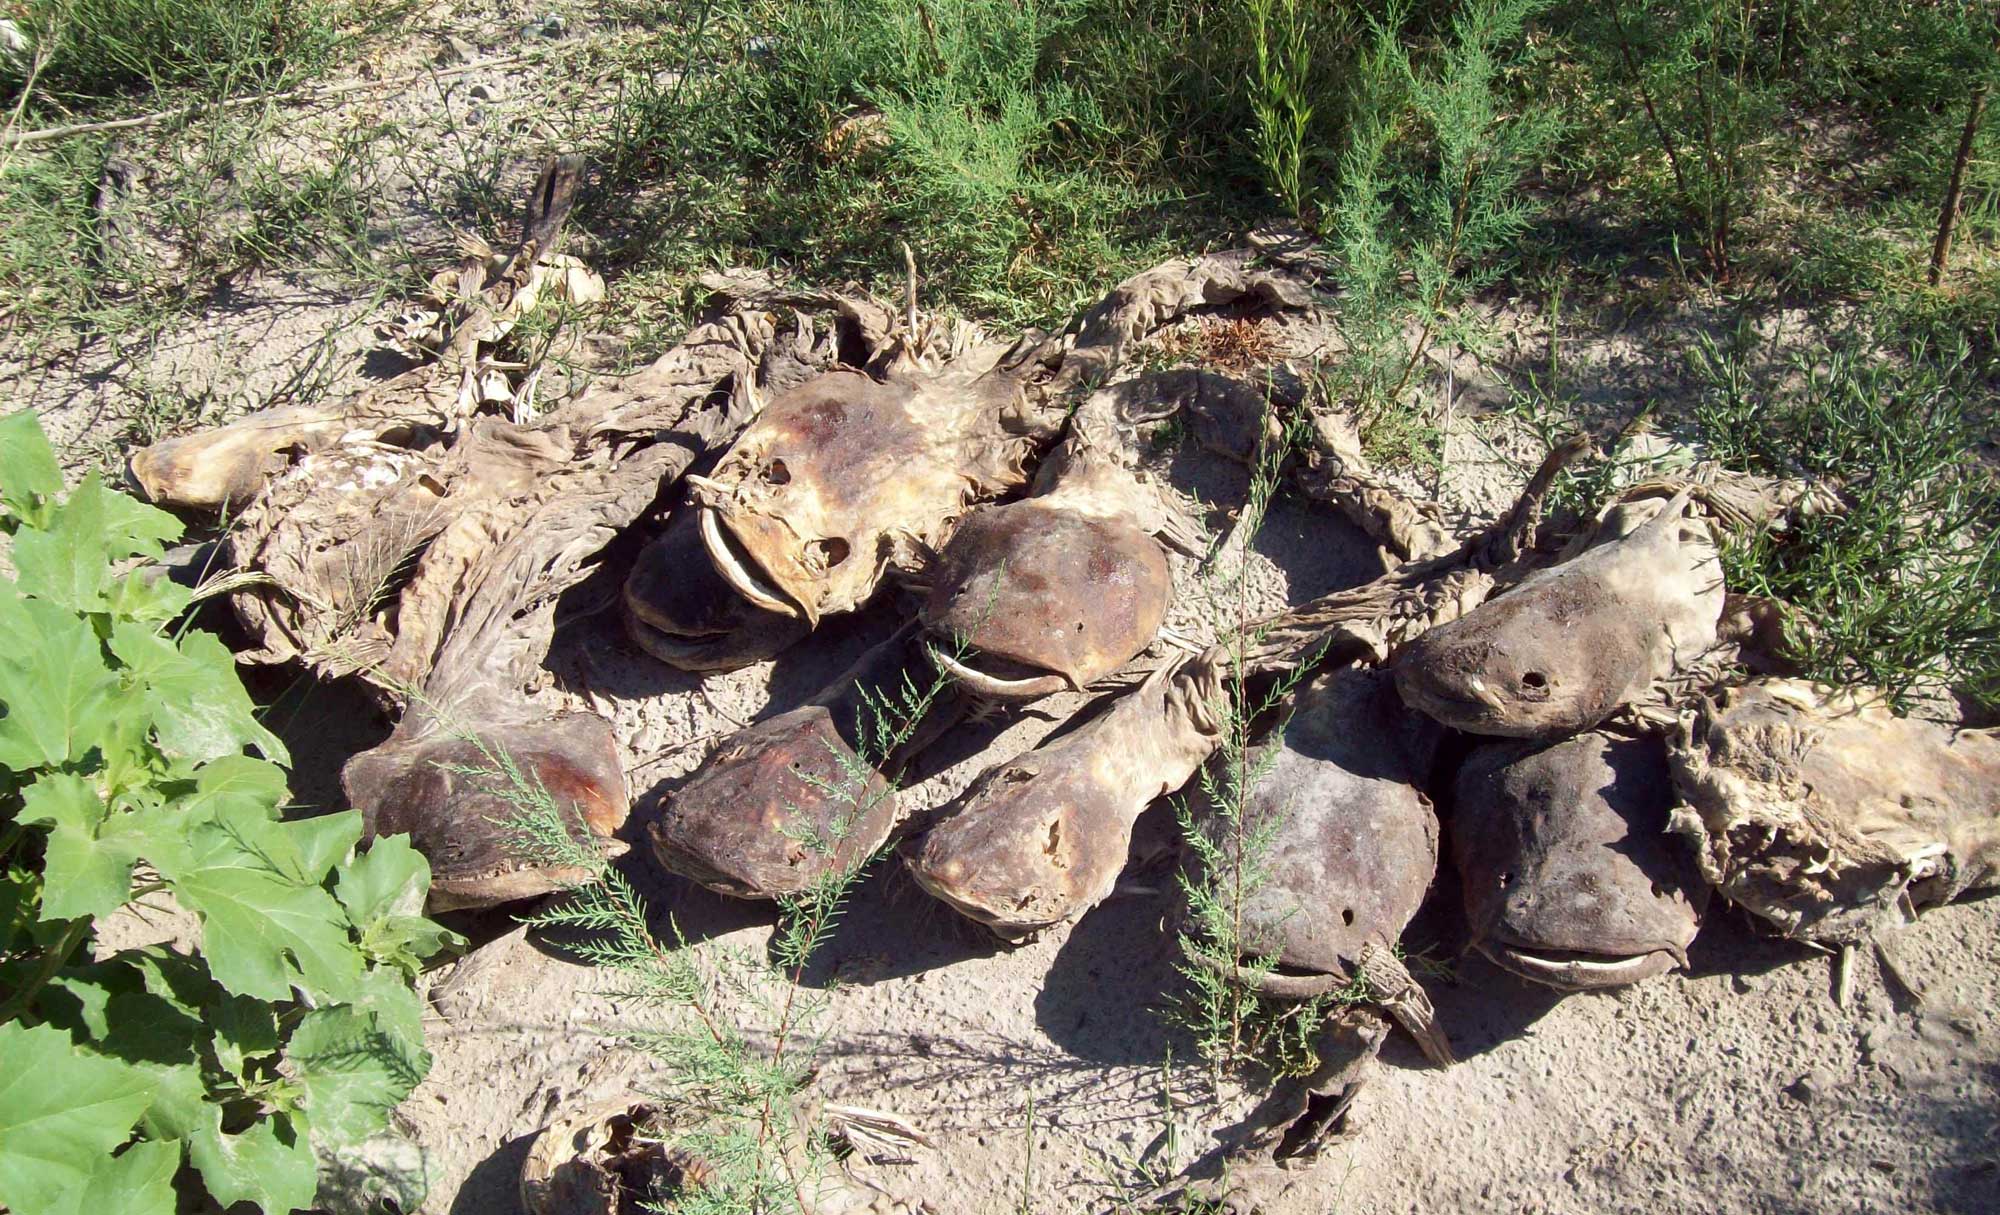
Dead fish from the O.C. Fisher Reservoir, San Angelo State Park, Texas, during a drought, 2011. The reservoir is an important source of drinking water and recreational fishing, but it dried up in 2011 due to drought. The reservoir has recovered slightly with increasing rainfall. Source: Photo by Travis Dowell, USGS (public domain).
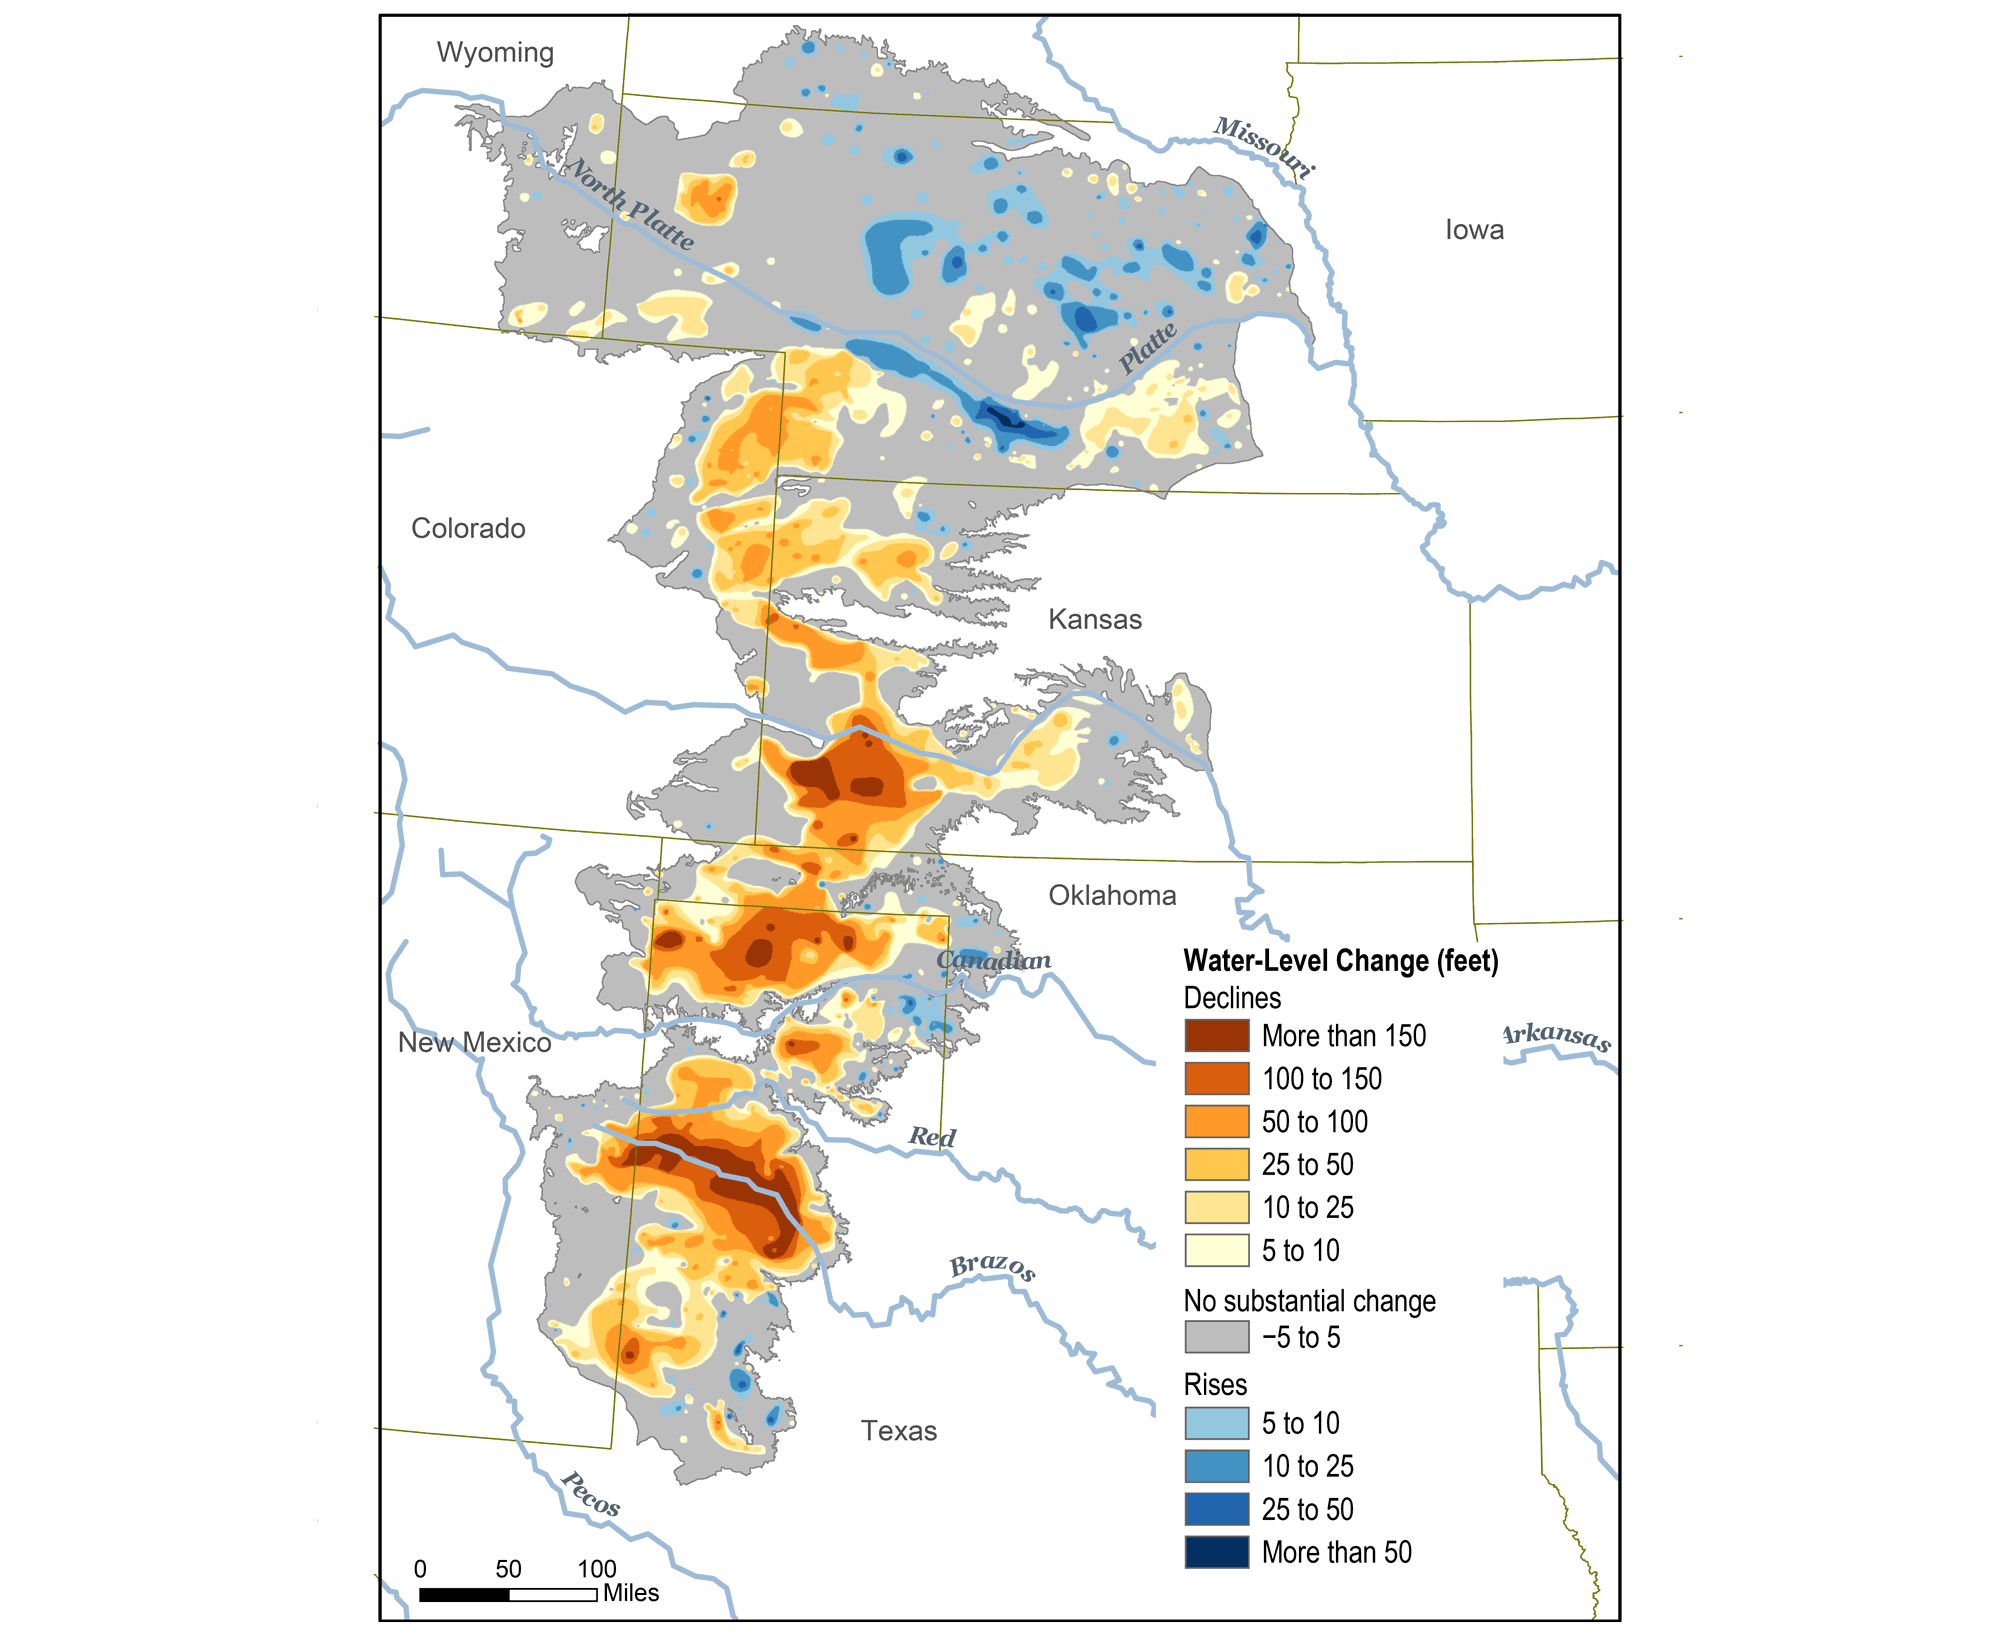
Original caption: "This map shows changes in Ogallala water levels from before the aquifer was tapped to 2015. Declining levels are red or orange, and rising levels are blue." Map from Climate.gov (NOAA).
Future temperature
Climate models predict that the south-central U.S. will continue to warm. The average annual temperature will continue to increase for the foreseeable future, as will the number of days per year with extreme heat. Summer temperatures in Oklahoma and Texas, for example, are expected to increase by 3 to 6°C (6 to 10°F) from pre-industrial temperatures by the year 2100, depending on our level of greenhouse gas reductions in the future. These increased temperatures lead to a whole host of other effects, including drier soils from more evaporation and the increased likelihood of drought and fires. Texas, which contains the largest acreage of crop-, pasture-, and rangeland in the United States, could be severely impacted by these changes.
In coastal Texas and Louisiana, summer temperatures combined with high humidity can lead to days with dangerously high heat indexes, where it is difficult for the human body to cool down through its usual mechanism of sweating.
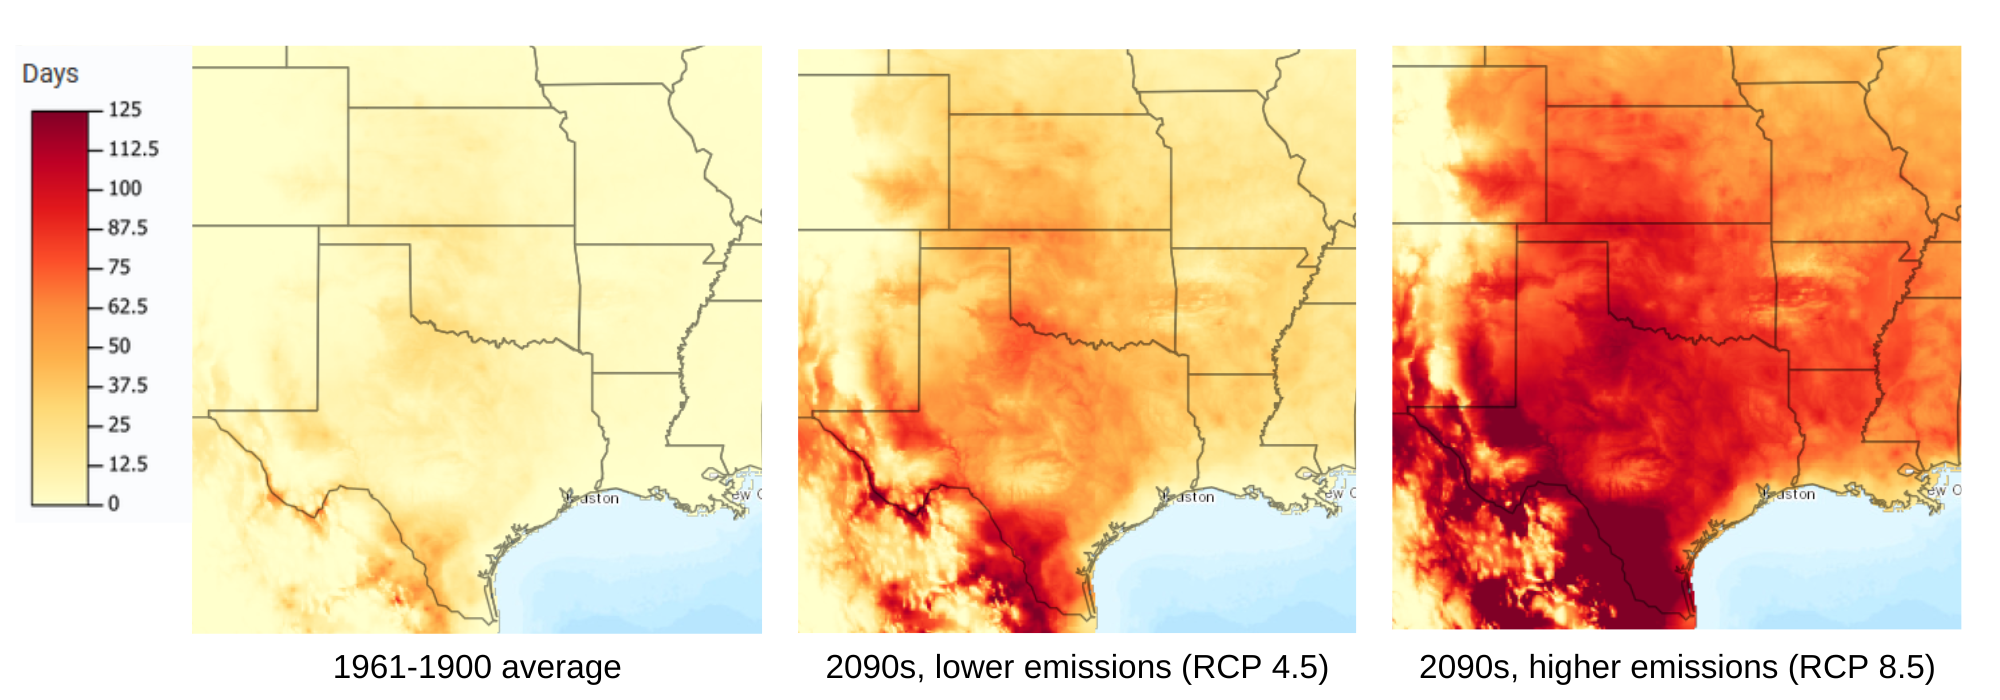
Maps of the number of days per year with maximum temperature reaching over 100°F. Left map: data showing the average over the period 1961-1990. Most counties in south-central states had fewer than 20 days per year of extreme heat. Center and right maps: future projections for the end of the 21st century (the 2090s) from climate models; the center map is for a lower greenhouse gas emissions scenario and the right map is for a higher greenhouse gas emissions scenario. The projections show many more extremely hot days per year, with southern parts of the region potentially having around 120 days per year with temperatures over 100°F, in the higher emissions scenario. Maps are from The Climate Explorer, U.S. Climate Resilience Toolkit, accessed May 22, 2023.
Future precipitation
Much of the region is projected to experience a decrease in precipitation in the future, though the region as a whole will likely experience an increase in heavy precipitation events, where a large amount of rain falls in a short period of time. The figure below shows projections for changes in extreme precipitation, for two greenhouse gas emissions scenarios. Heavy rainfalls can lead to devastating flooding.
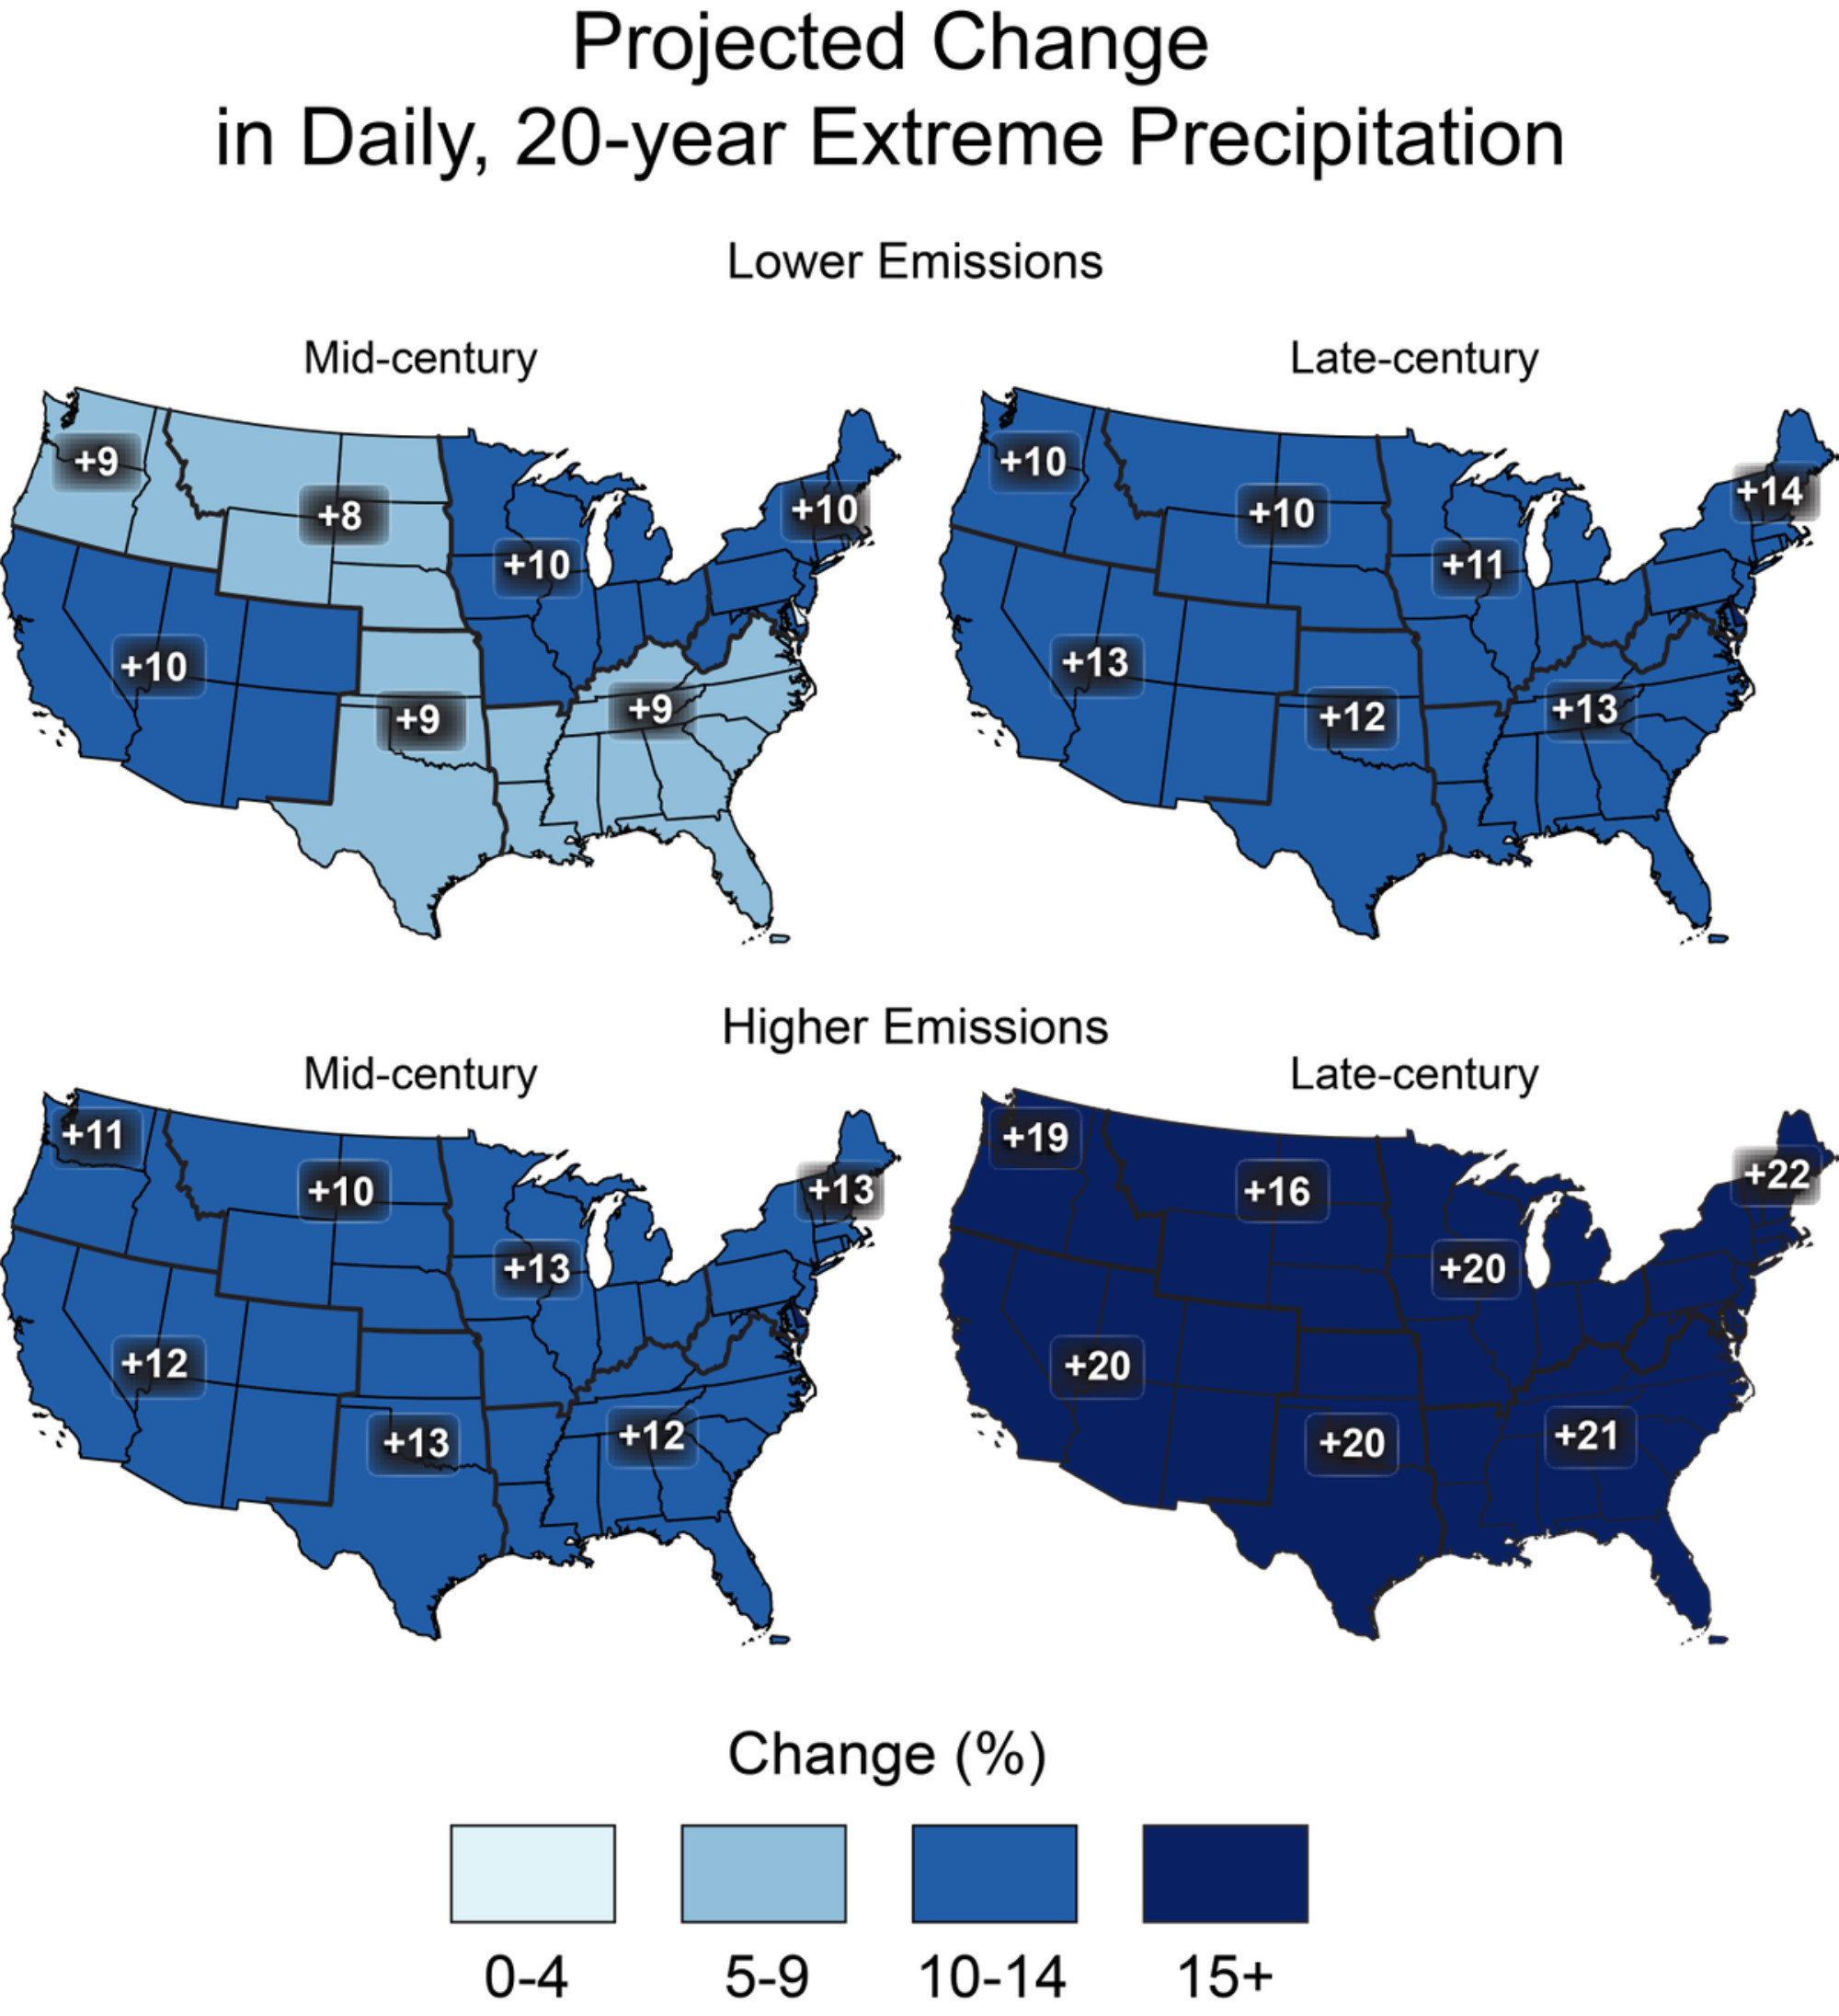
Maps of projected changes in heavy precipitation events, in this case for 20-year events (that is, storm rainfall amounts that have a 1-in-20 chance of happening in any given year.) The maps are shown for two different time periods, mid- and late-21st century. The top row of projections are for a lower greenhouse gas emissions scenario, and the bottom row are for a higher emissions scenario. Map source: 4th National Climate Assessment, Climate Science Special Report (2018), Chapter 7 - Precipitation Change in the United States. Original source: CICS-NC and NOAA NCEI.
Future severe weather events
The causes of specific weather events such as hurricanes and severe thunderstorms are incredibly complex. However, we know that climate change has enhanced some correlated factors, causing increased wind speed and an unstable atmosphere. Future hurricanes are expected to produce heavier rainfalls than in the past.
Higher atmospheric moisture content has also been correlated with an increased incidence of tornadoes and winter storms. Although climate change is predicted to enhance the intensity of severe weather, there is currently no way to calculate what effect climate change will have on the frequency of specific thunderstorm or hail storm events. We might see more powerful tornadoes, but we do not know if we will see more of them.

When severe winter storms hit Texas in early 2021, the state's power grid was overwhelmed by high energy demand combined with a lack of engineering for winter conditions and isolation from the power grid in the rest of the U.S. Power to many buildings was purposely shut off to keep the grid from failing. An estimated 1.4 million customers lost power in Houston alone. The photos above show nighttime lights in Houston before the storms (February 7, left) and following the storms (February 16, right). Photos from NASA Earth Observatory ("Extreme winter weather causes U.S. blackouts," February 17, 2021).
Future water supplies
Drier summers and wetter winters and springs could have significant adverse impacts on agriculture. Water supply is a critical issue in the south-central U.S., and communities will need to adapt to changes in precipitation, snowmelt, and runoff as the climate changes. Drier days and higher temperatures will amplify evaporation, increasing the desertification of already arid areas and increasing pressure on the water supply for agriculture and cities.
The south-central U.S. already experienced a preview of the possible problems that could result from lack of water during the Dust Bowl years of the 1930s. The Dust Bowl was an environmental disaster caused by poor land use combined with drought. Plowing of native prairies to grow crops left exposed soil, which, combined with dry conditions and wind, produced enormous dust storms. The storms affected primarily the Texas and Oklahoma panhandles, western Kansas, southeastern Colorado, and a little of New Mexico and Nebraska. People suffered from dust pneumonia and many abandoned their land, migrating to California. The Dust Bowl ended through a combination of the end of the drought and improved soil conservation practices. Currently, the region depends on pumping groundwater from the Ogallala aquifer to sustain agriculture.
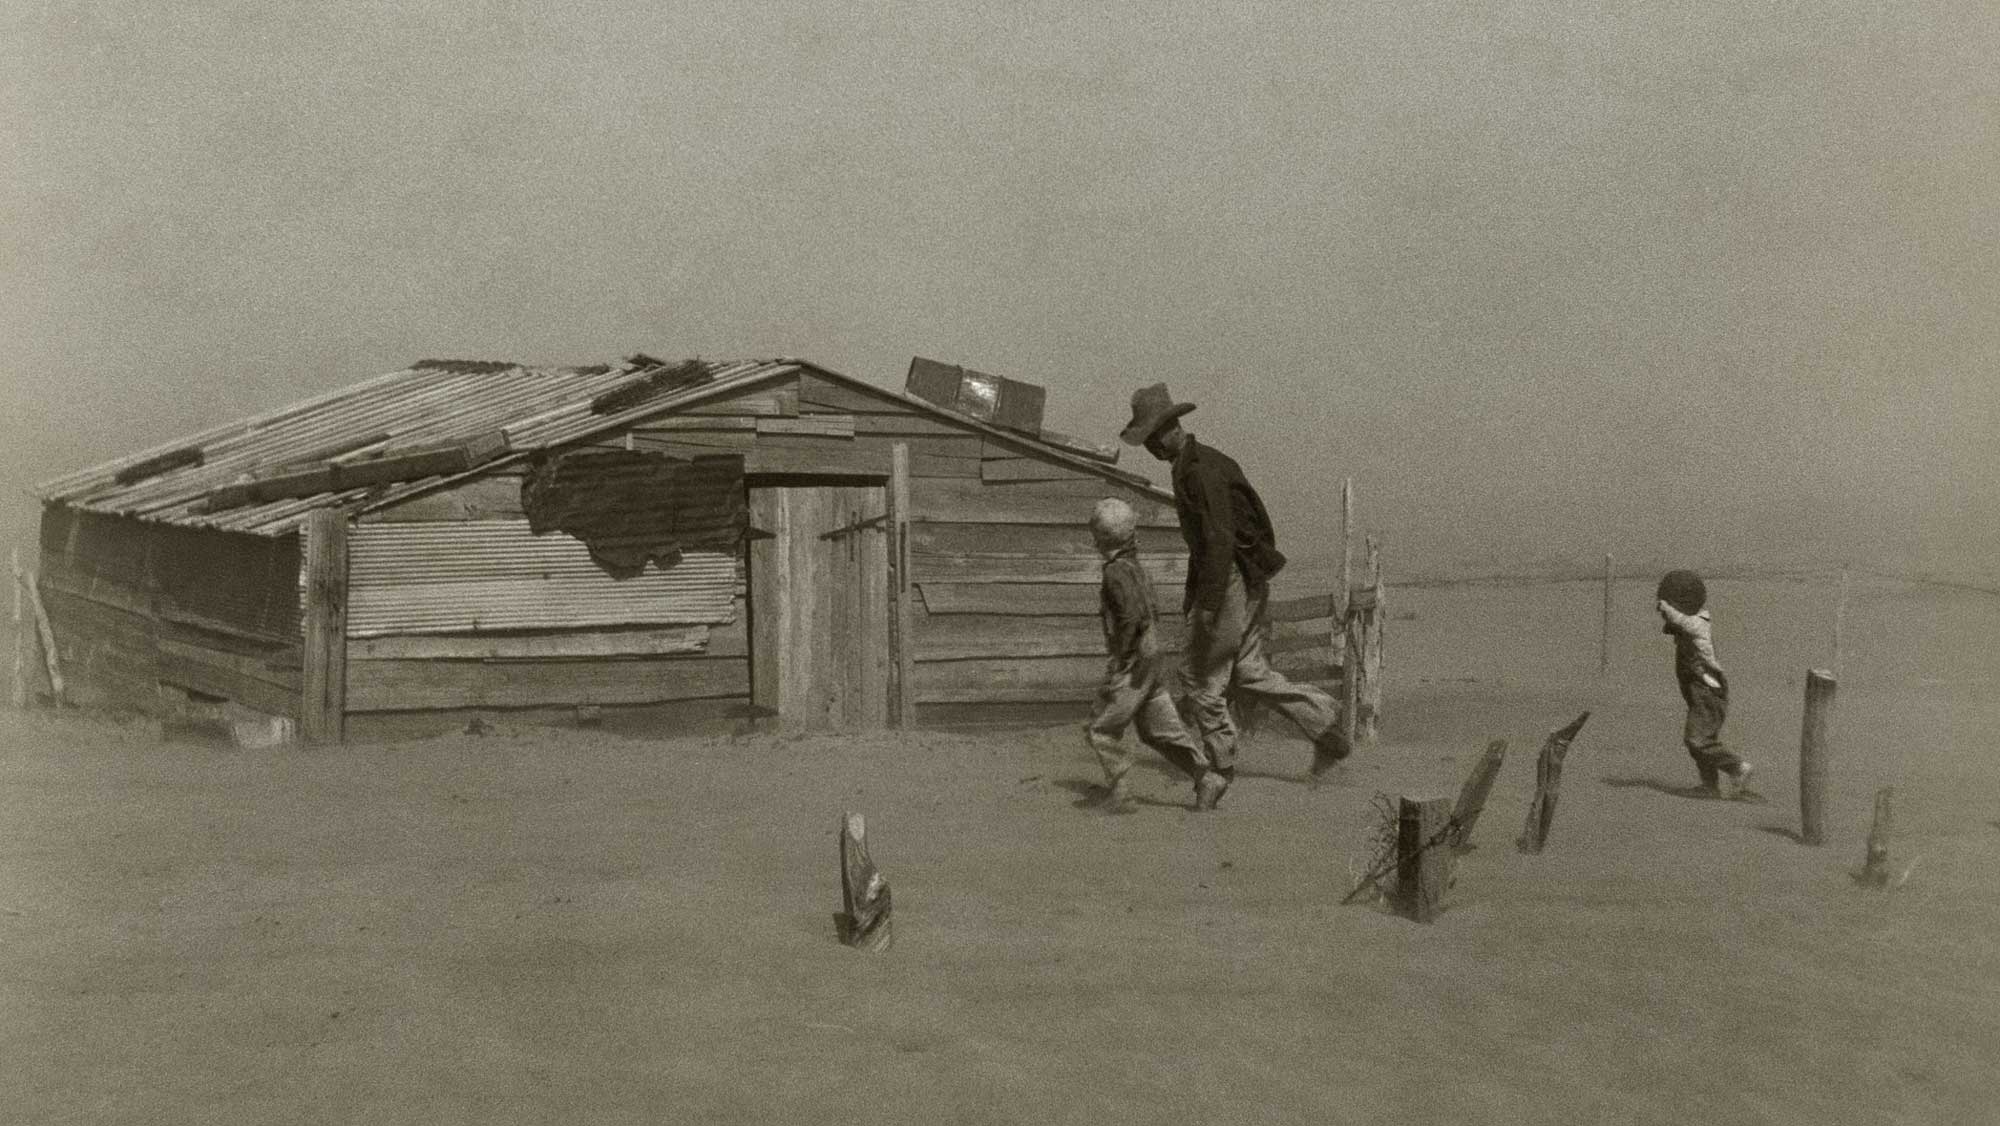
A father with his sons in a dust storm, Cimarron County, Oklahoma, 1936. Photo by Arther Rothstein, Farm Security Administration/Office of War Information collection (Wikimedia, public domain).
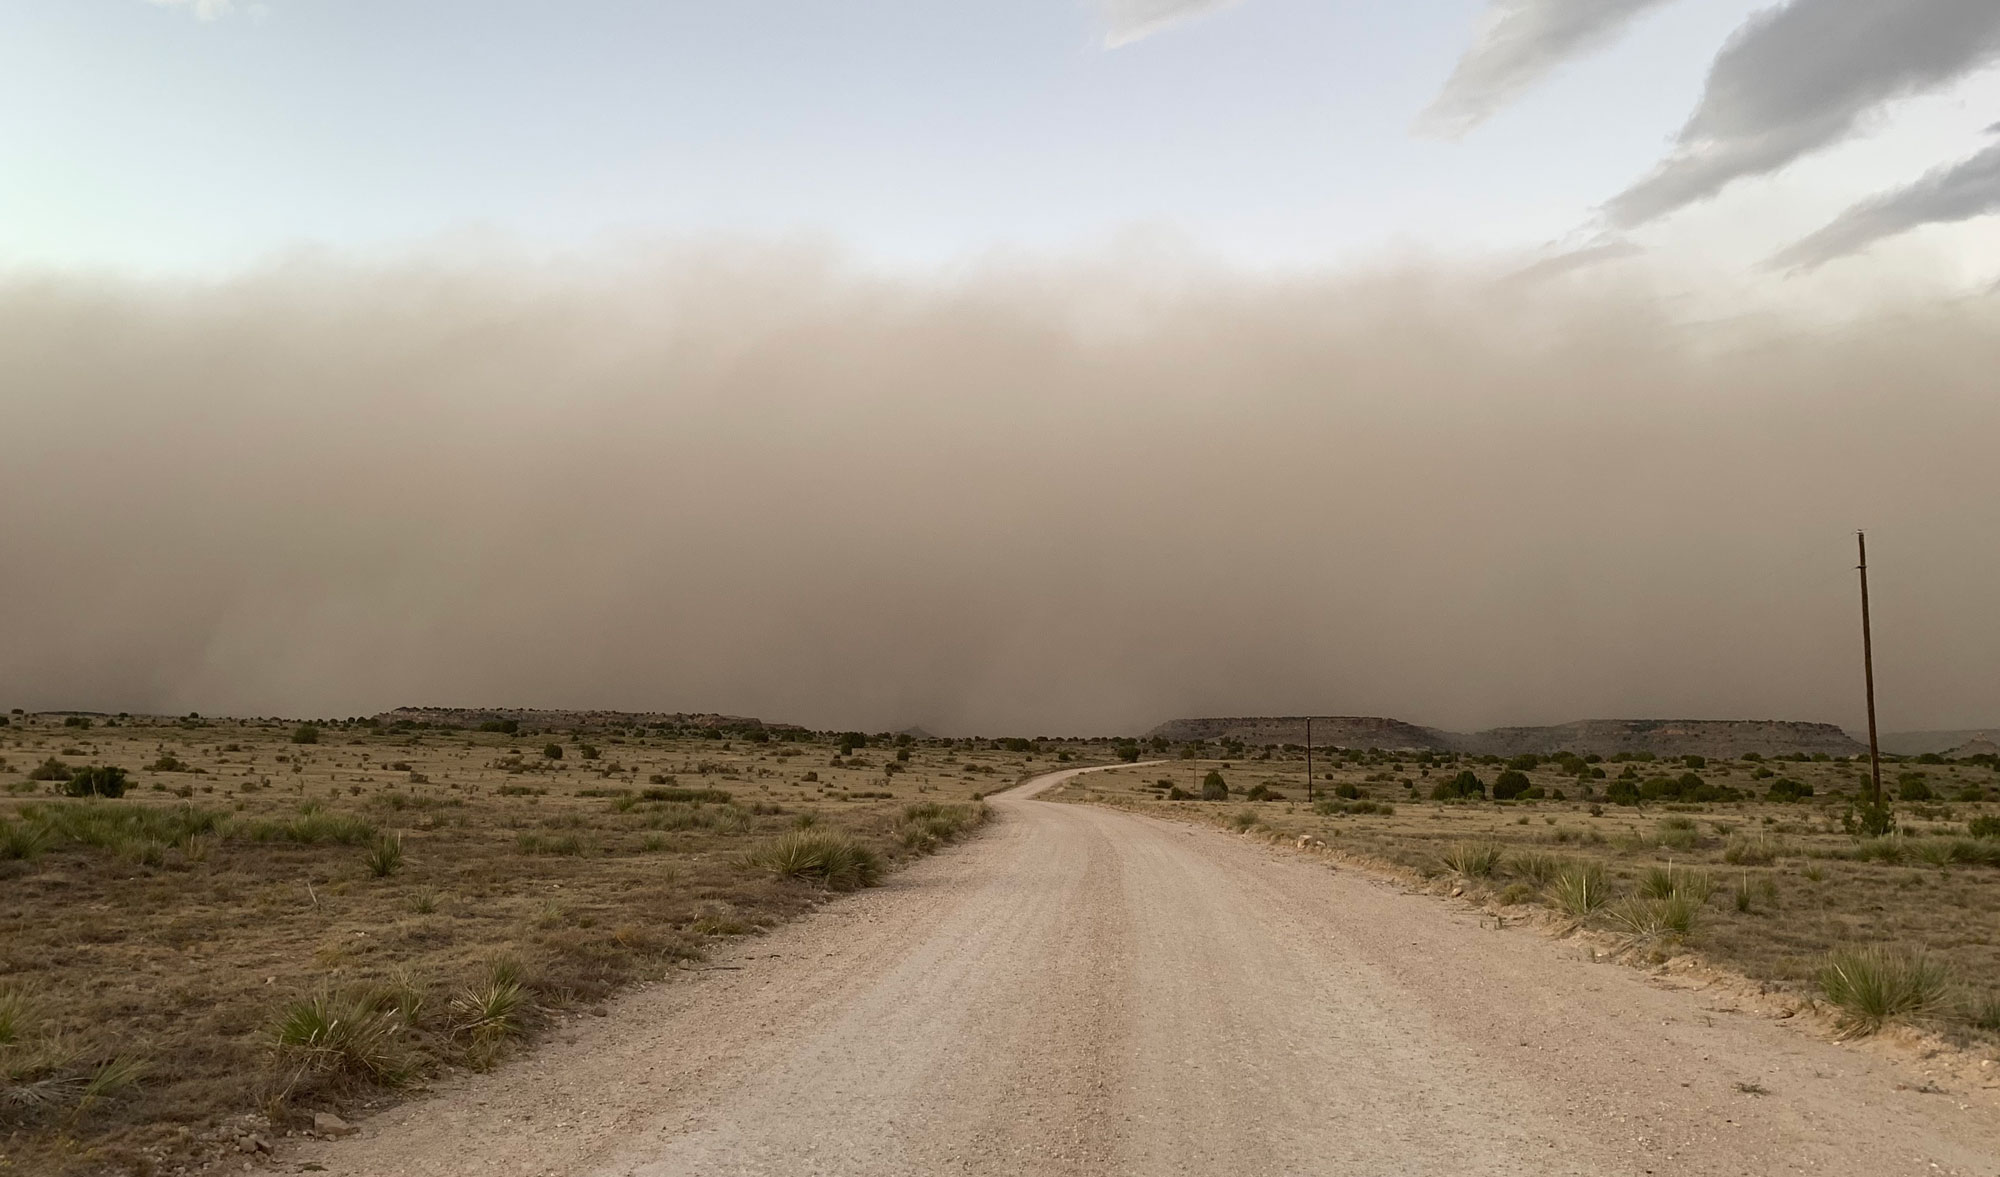
A dust storm in Cimarron County, Oklahoma, 2011. This storm occurred during that same drought that affected Texas in 2011. Photo by OKJaguar (Wikimedia Commons, Creative Commons Attribution-ShareAlike 4.0 International license, image cropped and resized).
Future sea level
More than 50% of the American population currently lives in coastal regions. Sea level rise from melting glaciers and the thermal expansion of a warmer ocean is a major concern in the south-central U.S., including major cities like New Orleans. A rising sea leads to retreating tidal forests, coastal erosion, larger and more damaging storm surges, inundation of populated areas, and stresses on municipal water and sewer systems. Increased inland flooding will impair stormwater drainage systems that empty into the ocean and destroy tidal wetlands, reducing environmental protection against storm surge and decreasing important fishery habitat.
Oil and gas production infrastructure located in areas protected by barrier islands will be at greater risk to storm surge, affecting our ability to develop energy resources. Regional studies project that by 2030, climate change could cause $4.6 billion in damages to coastal property and assets on the Gulf Coast alone.
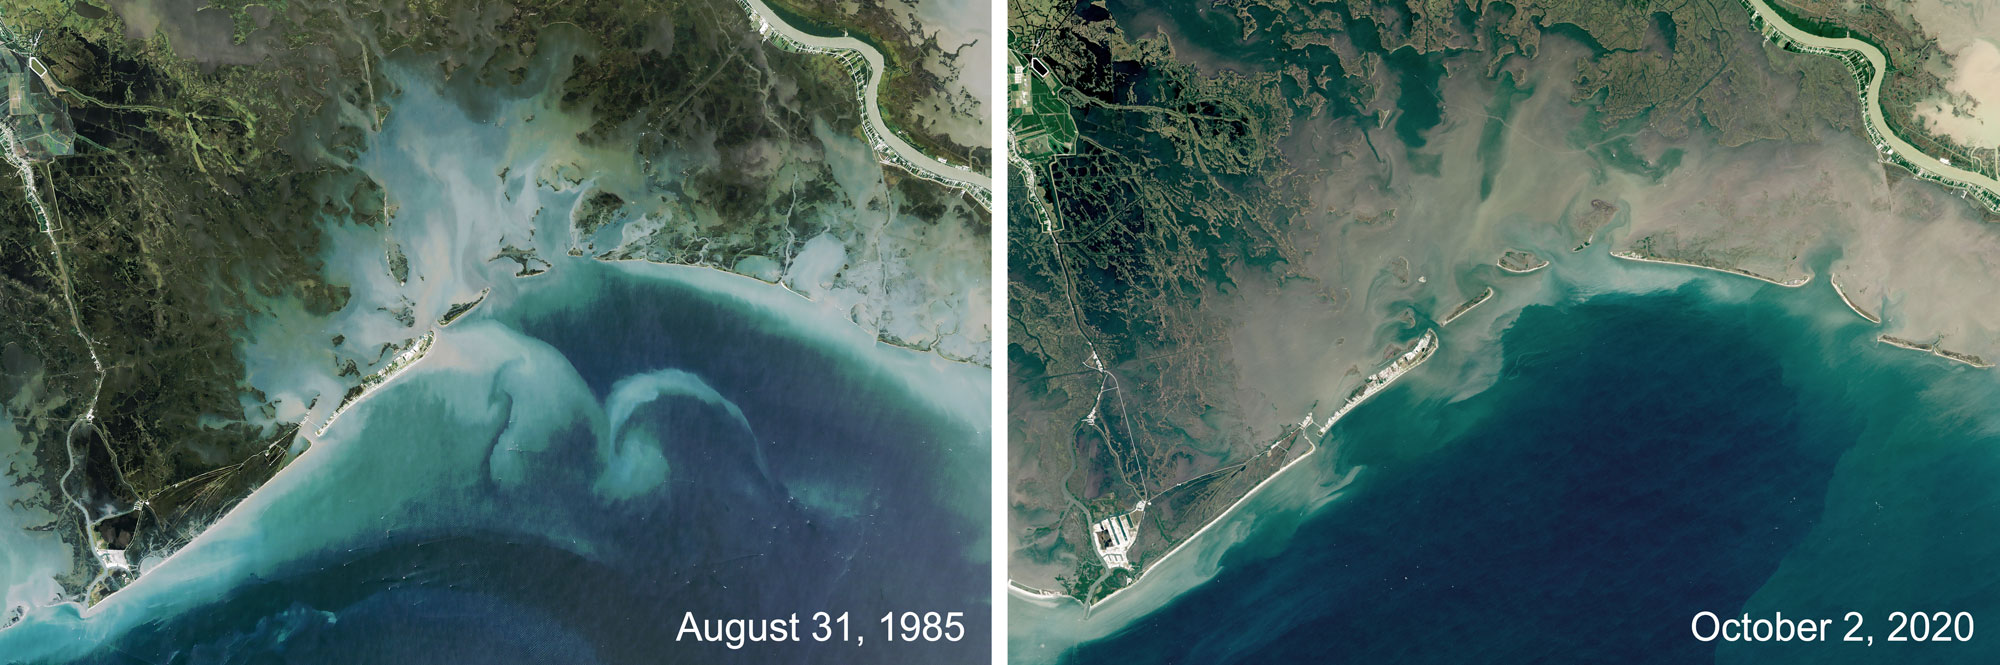
Barataria Bay, Louisiana, at two points in time about 35 years apart. On the left is the Bay in August 1985, on the right in October 2020. Multiple forces, including sinking of the land, sea level rise, and the building of structures to control flooding have caused the land surrounding the bay to disappear. Images by Lauren Dauphin using Landsat dat from the USGS (NASA Earth Observatory, used following NASA's image use policy).
Resources
Resources from the Paleontological Research Institution
Books
Zabel, I.H.H., D. Haas, and R.M. Ross. 2017. The Teacher-Friendly Guide to Climate Change. Paleontological Research Institution Special Publication 53, Ithaca, NY, 294 pp. Find updated, digital versions of the chapters of this book on Earth@Home Climate.
Allmon, W. D., T. A. Smrecak, and R. M. Ross. 2010. Climate change—past, present & future: a very short guide. Paleontological Research Institution Special Publication 38, Ithaca, NY, 200 pp.
Websites
Earth@Home Climate: https://climate.earthathome.org/
Earth@Home: Quick guides & FAQ: Climate and Energy: https://earthathome.org/quick-faqs/#climate
Earth@Home: Here on Earth: Introduction to Climate: https://earthathome.org/hoe/climate/