

Page snapshot: Introduction to energy in the Cascade-Sierra Nevada Mountains and Pacific Border regions of the western United States, including fossil fuels, renewable energy, and nuclear power.
Topics covered on this page: Overview; Oil; History of oil extraction; Oil production today; Offshore drilling; Solar power; Geothermal energy; Hydroelectricity; Salmon, steelhead, and dams; Dam removal; Wind energy; Nuclear power; Resources.
Credits: Some of the text of this page comes from "Energy in the western US" by Carlyn S. Buckler and Gary Lewis, chapter 7 in The Teacher-Friendly Guide to the Earth Science of the Western US, edited by Mark D. Lucas, Robert M. Ross, and Andrielle N. Swaby (published in 2014 by the Paleontological Research Institution; currently out of print). The book was adapted for the web by Elizabeth J. Hermsen and Jonathan R. Hendricks in 2022. Changes include formatting and revisions and additions to the text and images. Credits for individual images are given in figure captions.
Updates: Page last updated August 2, 2022.
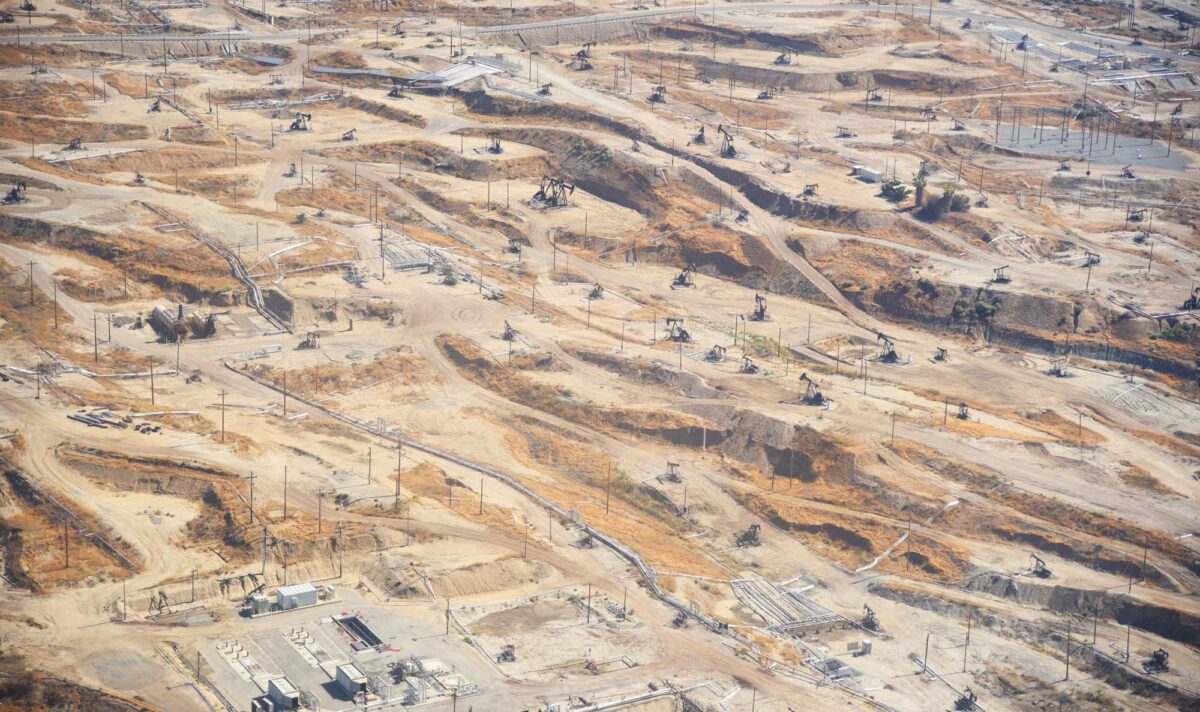
Image above: Aerial view of numerous pumpjacks and other infrastructure in the Kern River Oil Field, Kern County, California, 2017. This oil field has more than 9000 wells dotting more than 4300 hectares (more than 10,000 acres) of land. Source: "SARP_Flikr_17" by NASA/Megan Schill (NASA Earth Right Now on flickr, Creative Commons Attribution 2.0 Generic license, image resized).
Overview
Cascade and Sierra Nevada Mountains
These tall mountain ranges provide perfect opportunities for hydroelectric power. There are hundreds of hydroelectric power plants throughout the region, which provide the area with a majority of this renewable energy. Much of this region is managed wood forest, and several wood-burning power generation plants also provide power. Wind, biomass, and several solar power plants round out the energy production profile for the region.
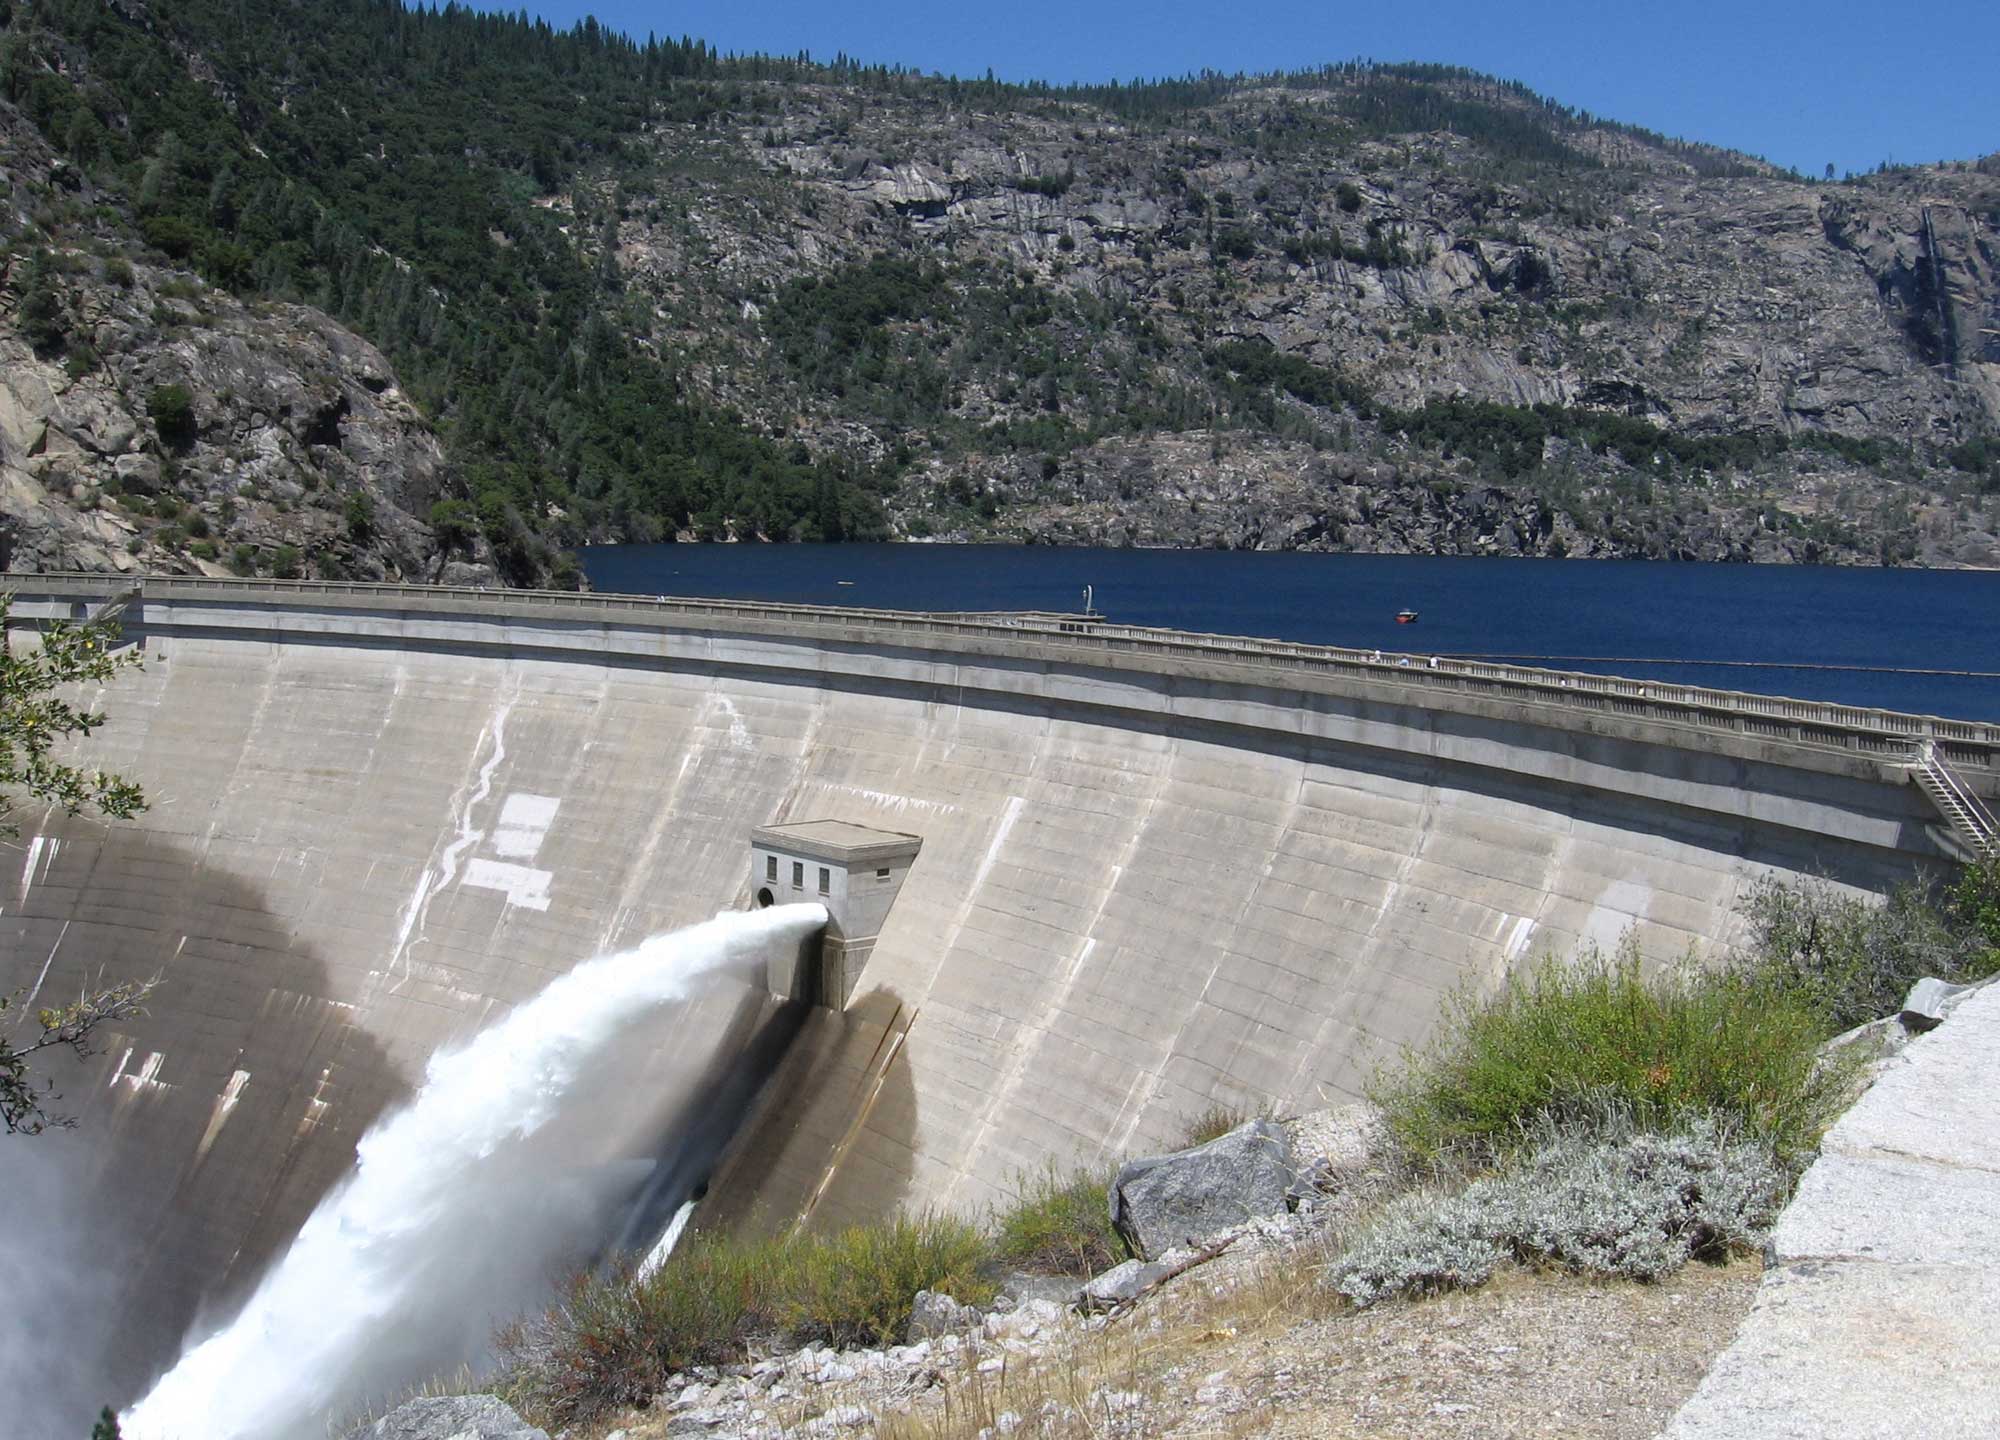
O'Shaughnessy Dam, Yosemite National Park, California. This dam was controversially built in the national park in the early 1920s, flooding the picturesque Hetch Hetchy Valley. Today, the reservoir provides drinking water for San Francisco and the dam powers two hydroelectric plants with a combined capacity of over 230 MW. Photo by Inklein (Wikimedia Commons, Creative Commons Attribution-ShareAlike 3.0 Unported license, image cropped and resized).
Pacific Border
The Pacific Border’s topographic variation is suited to a variety of energy production methods. The Coast Ranges provide ample hydroelectric and wind energy capability, and the flat desert lands of the San Joaquin Valley (southern Central Valley) makes the generation of solar power profitable. The vast acreage of forests also provides material for biomass and wood burning power plants.
Coastal California has long been a resource for the extraction, export, import, and refining of oil and gas, with the ports of Long Beach, Los Angeles, and San Francisco being the main hubs. Ranking third in the nation for crude oil production, refineries and terminal storage facilities dot the area. With the “car culture” and lack of public transportation in most of California, the demand for and flow of oil has continued unabated over the last century.
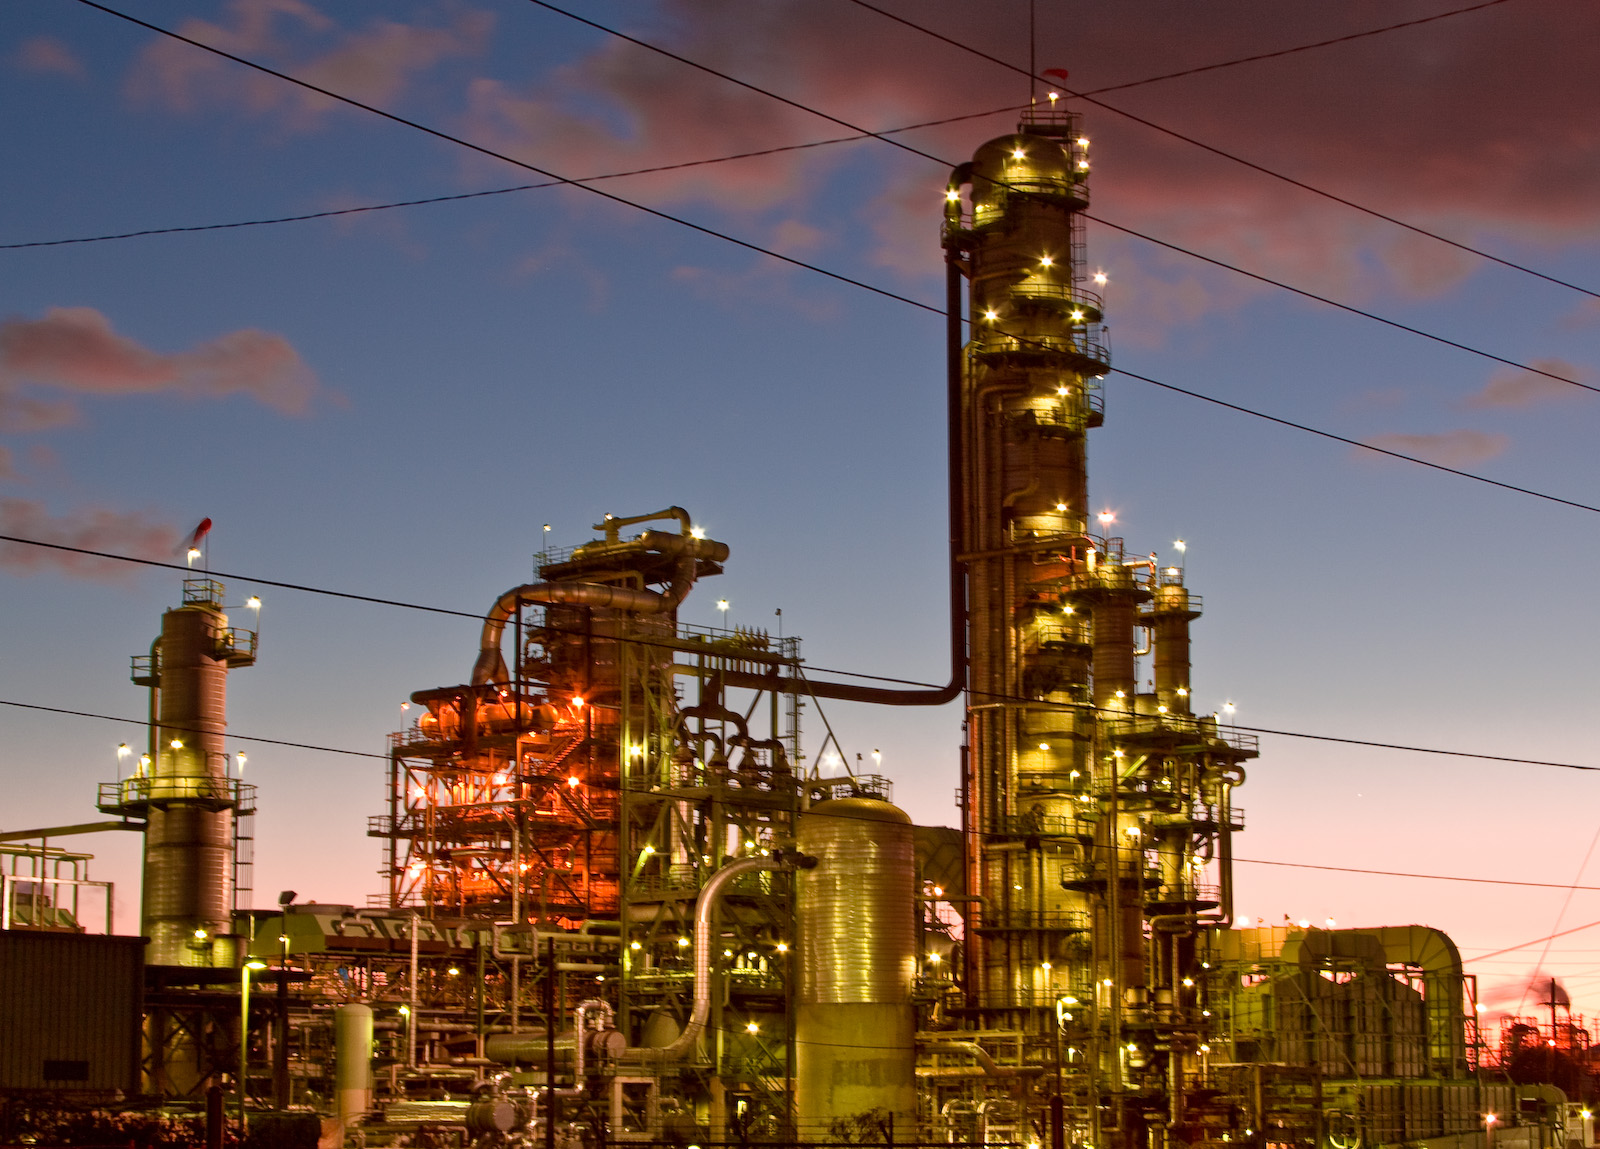
El Segundo Refinery, Westchester, Los Angeles, California. Photo by Pedro Szekely (flickr, public domain).
Oil
California’s vast oil production is the result of several large sedimentary basins, complex geology creating significant traps, and, more recently, the development of large offshore oil fields. The source of most of California’s oil is sandstone from coastal marine deposits, particularly the Neogene Monterey Formation. The oil from this formation has migrated and become trapped in other formations.
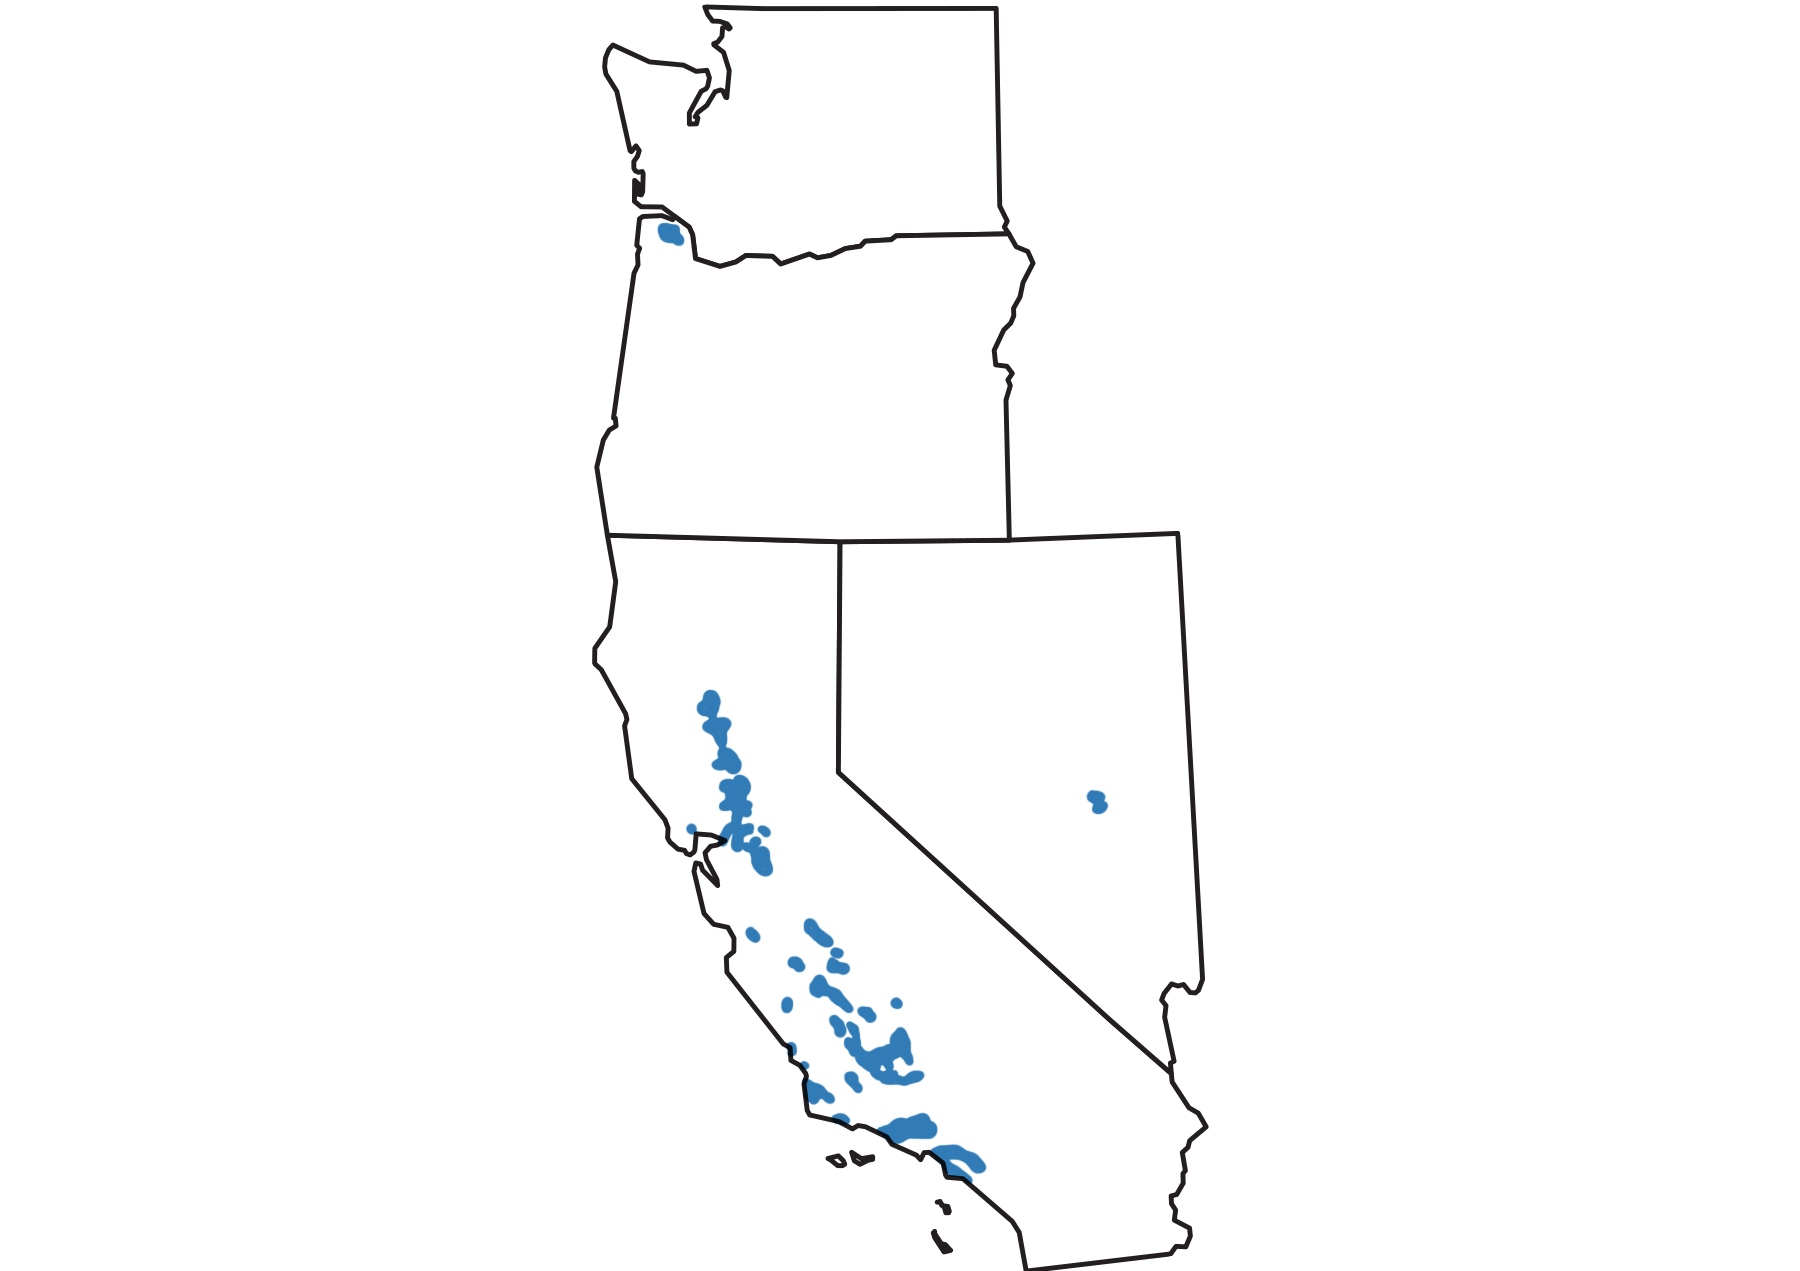
Oil and gas production in the four contiguous states of the western U.S. Map modified from a map by Peter Nester, originally published in The Teacher-Friendly Guide to the Earth Science of the Western US.
History of oil extraction
California’s first productive well was drilled in the Central Valley in 1865. This area, east of San Francisco, became the scene of heavy drilling activity through the rest of the 1800s, providing enough oil for the nearby market of San Francisco.
The Los Angeles Basin, first drilled in 1892, ultimately turned out to contain the most productive fields in the state. By the early 1920s, California was the source of one-quarter of the world’s entire output of oil, due in large part to the high productivity of the Long Beach Field.
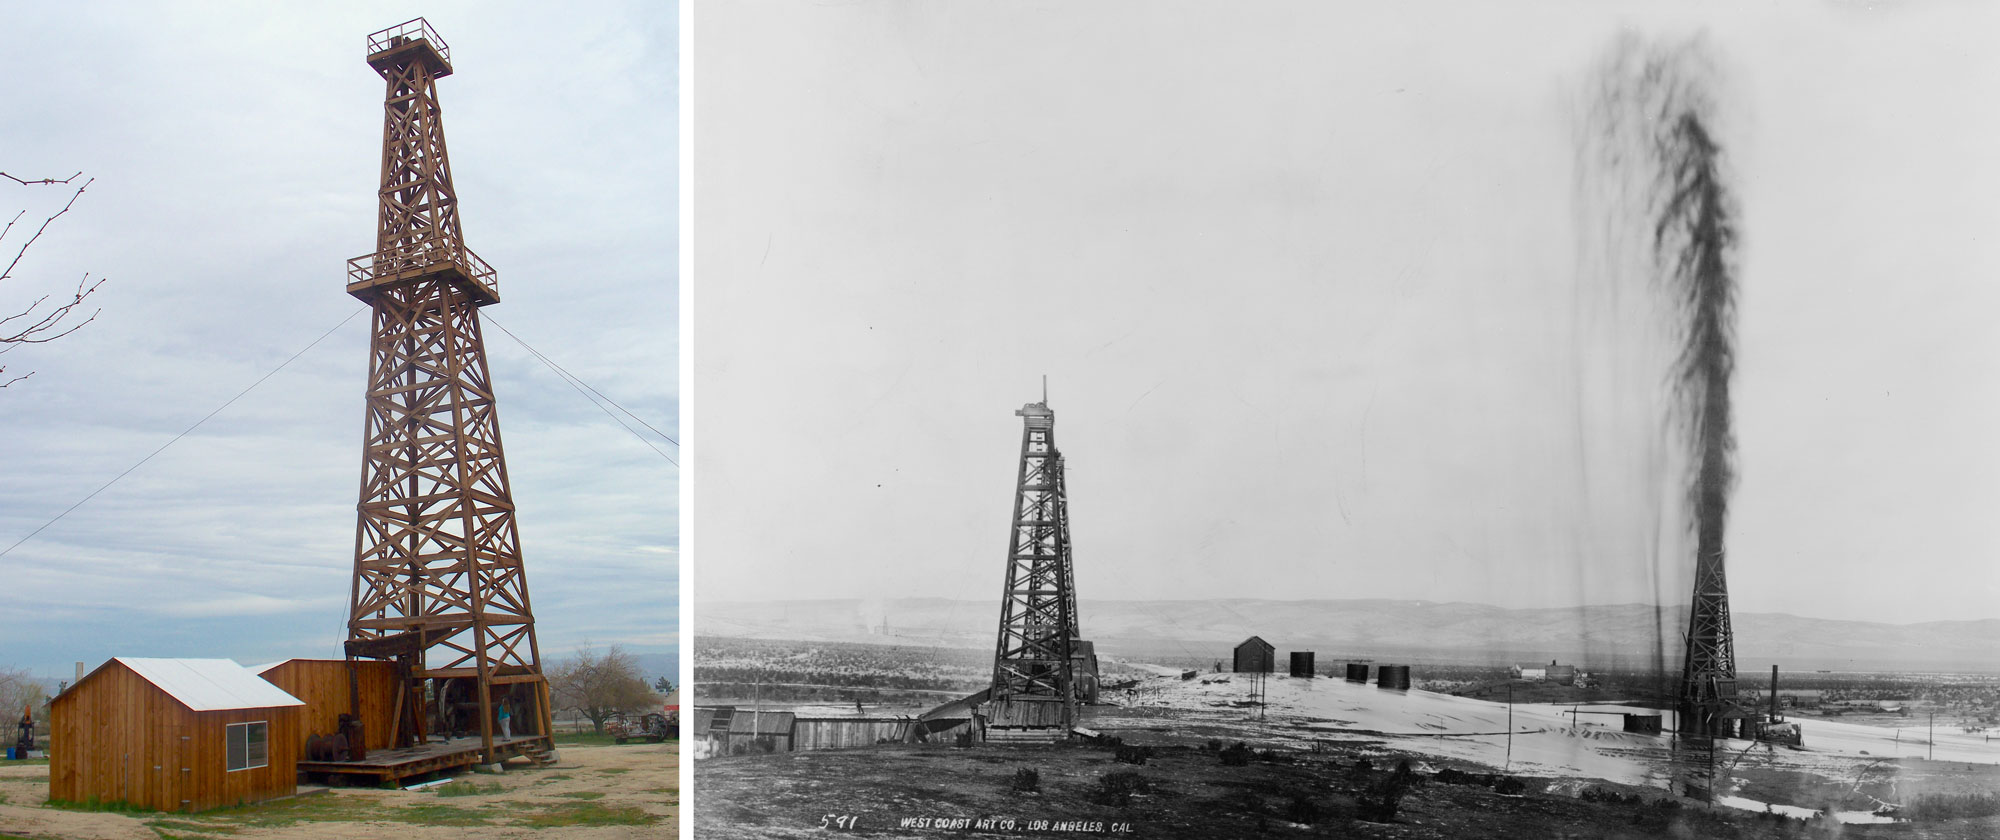
Historical oil derricks (derricks are the tower-like structures). Left: Wooden derrick built ca. 1917 preserved at the West Kern Oil Museum in California. Photo by Konrad Summers (Wikimedia Commons, Creative Commons Attribution-Share Alike 2.0 Generic license, image resized and cropped). Right: An oil field in California ca. 1910 with a gusher spewing oil on the right. Photo by West Coast Art Co. (from the Library of Congress Prints and Photographs Online Catalog, no known restrictions on publication).
.jpg)
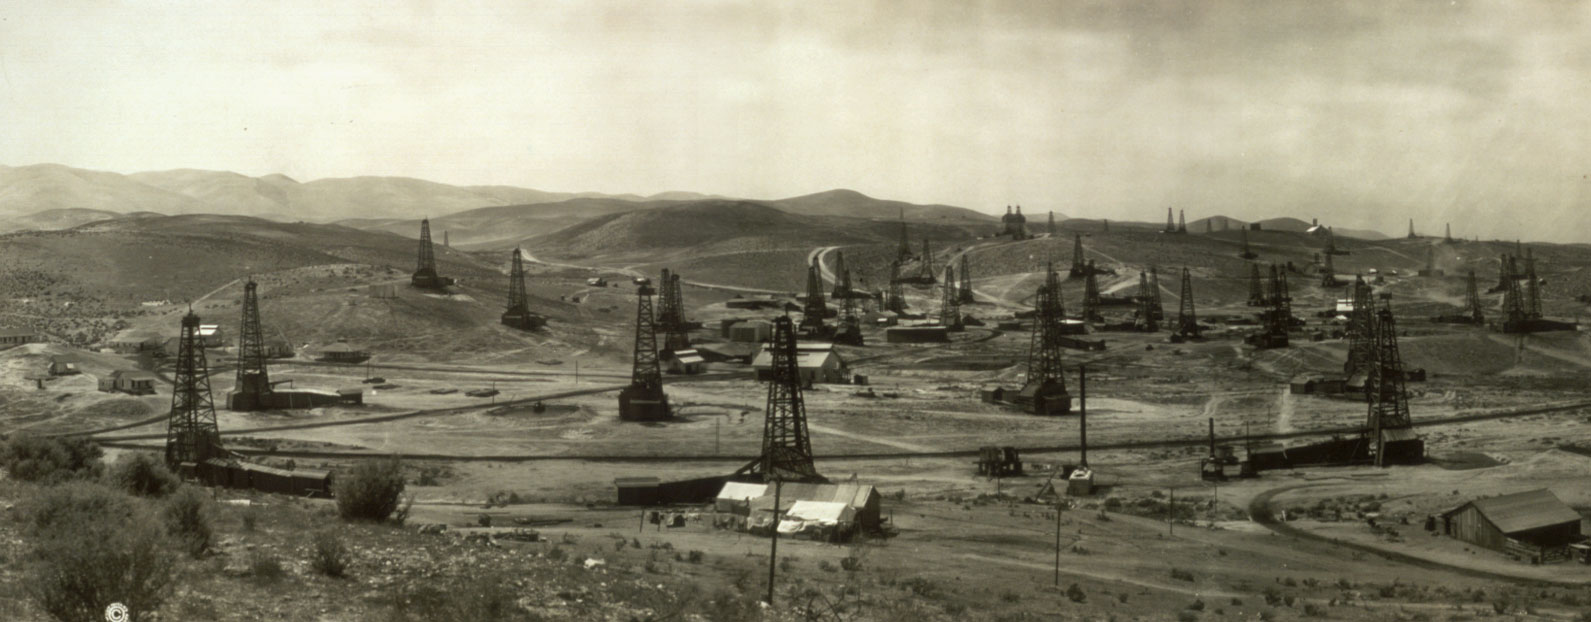
San Francisco oil field, California, ca 1909. Photo by West Coast Art Co. (Library of Congress Prints and Photographs Division, no known restrictions on publication).
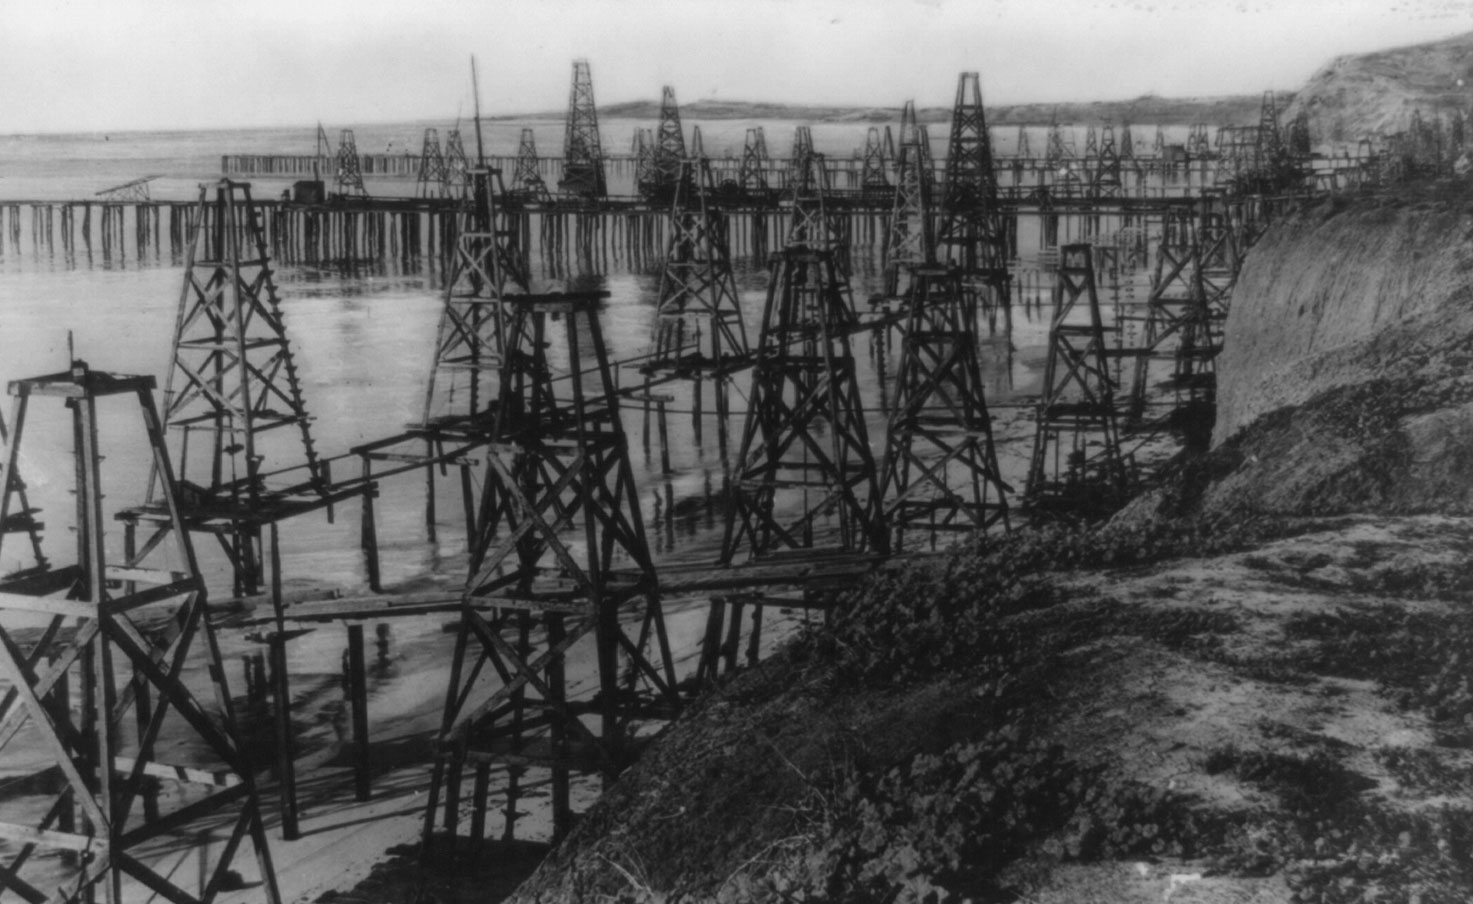
Oil pumping, Pacific Coast, Summerland, Santa Barbara, California, ca 1920. Library of Congress Reproduction Number LC-USZ62-12632 (Library of Congress Prints and Photographs Division, no known restrictions on publication).
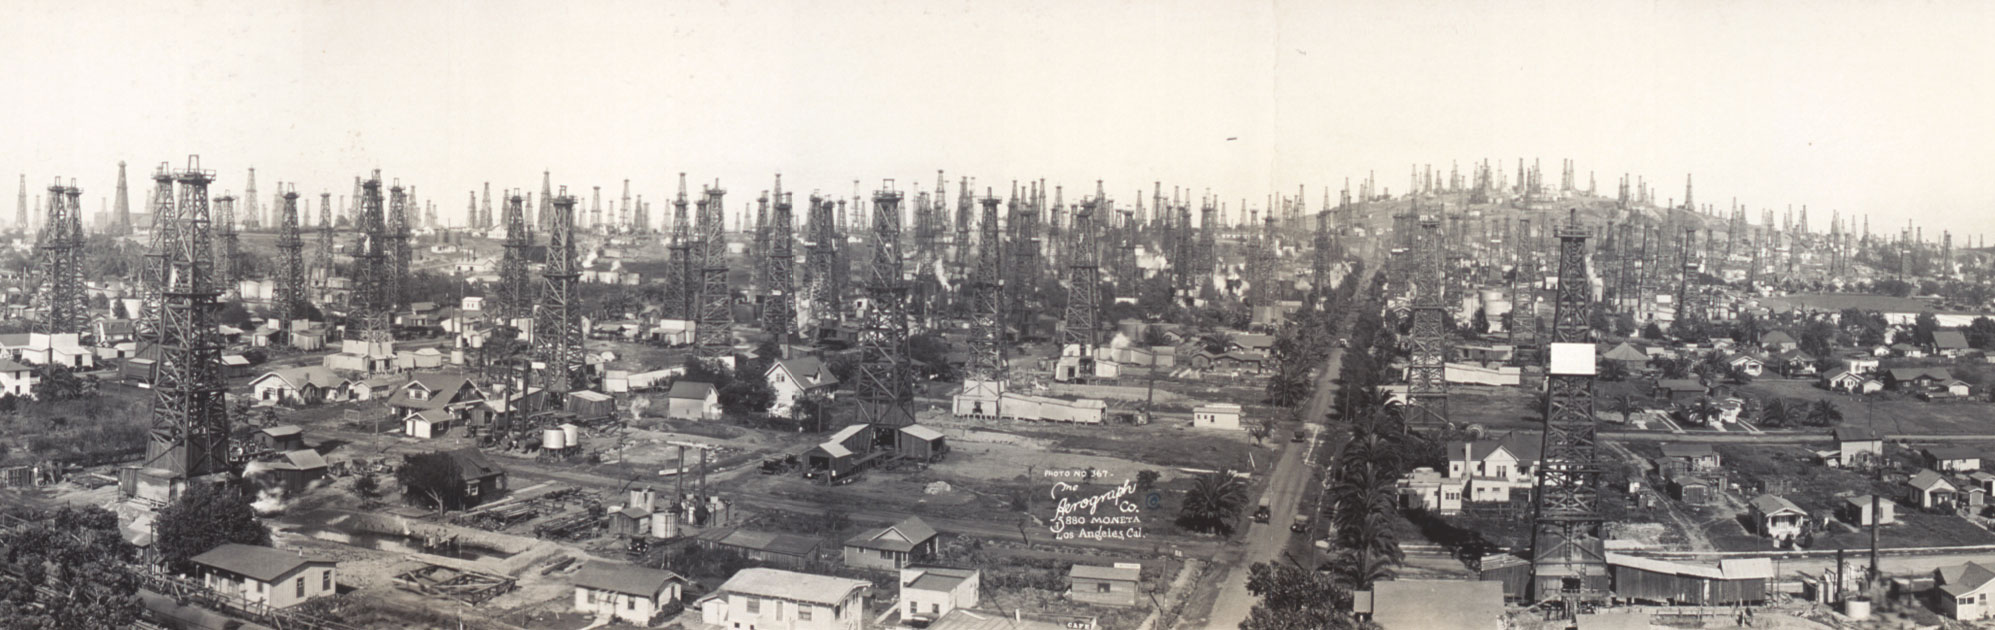
Portion of a panorama of the Signal Hill oil field, Long Beach, California, ca. 1923. Photo by Aerograph Co. (Library of Congress Prints and Photographs Division, no known restrictions on publication).
Oil production today
Presently, Kern River Oil Field near Bakersfield is the mostly heavily developed oil and gas field in California, producing the vast majority of its petroleum.
To date, oil in California has generally been tapped through conventional vertical drilling. The Monterey Formation is estimated to retain a large but uncertain amount of oil that could be reached through unconventional drilling (horizontal drilling and hydraulic fracturing). Although there is economic interest in horizontal drilling, there is also concern about associated environmental impacts.
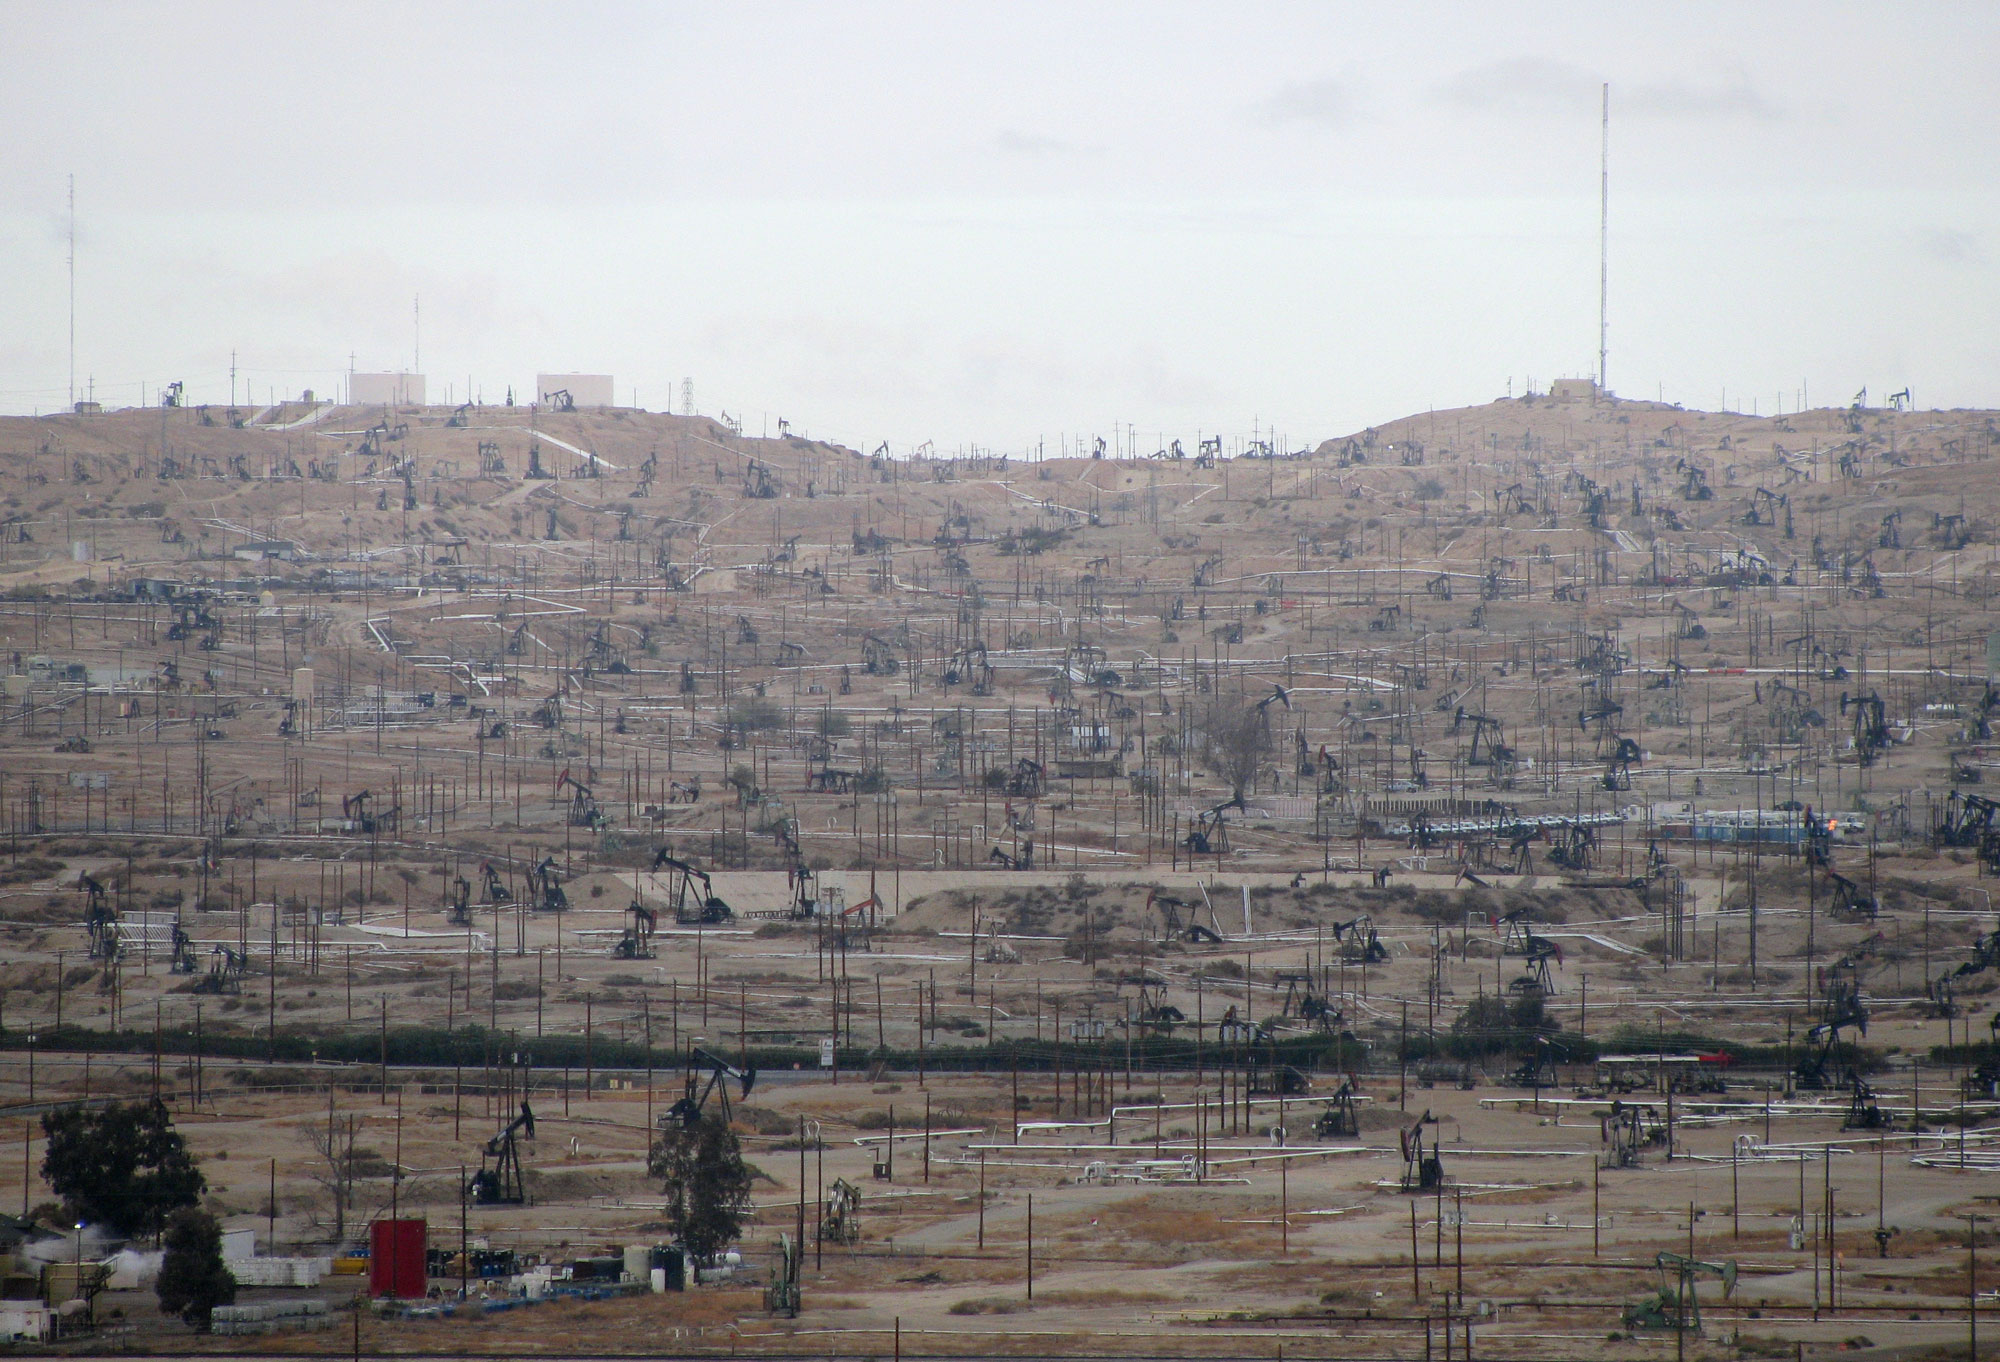
Ground-level view of numerous pumpjacks and other infrastructure in the Kern River Oil Field, Kern County, California, 2009. Photo by Antandrus (Wikimedia Commons, Creative Commons Attribution-ShareAlike 3.0 Unported license, image resized).
Offshore drilling
In addition to on-shore drilling, off-shore drilling takes place on oil platforms in the Pacific Ocean off California. Few platforms remain in state waters, but federal waters still host more than 20 oil platforms.
California waters have experienced a number of large oil spills. One of the most well known, the Santa Barbara oil spill of 1969, began on January 28, 1969, when a blowout occurred as Union Oil was drilling a well off the coast of Santa Barbara. Eventually, an estimated 3 million gallons of oil were released into the ocean, killing thousands of birds. The Santa Barbara oil spill was one of the catalyzing events behind the celebration of the first Earth Day in 1970.
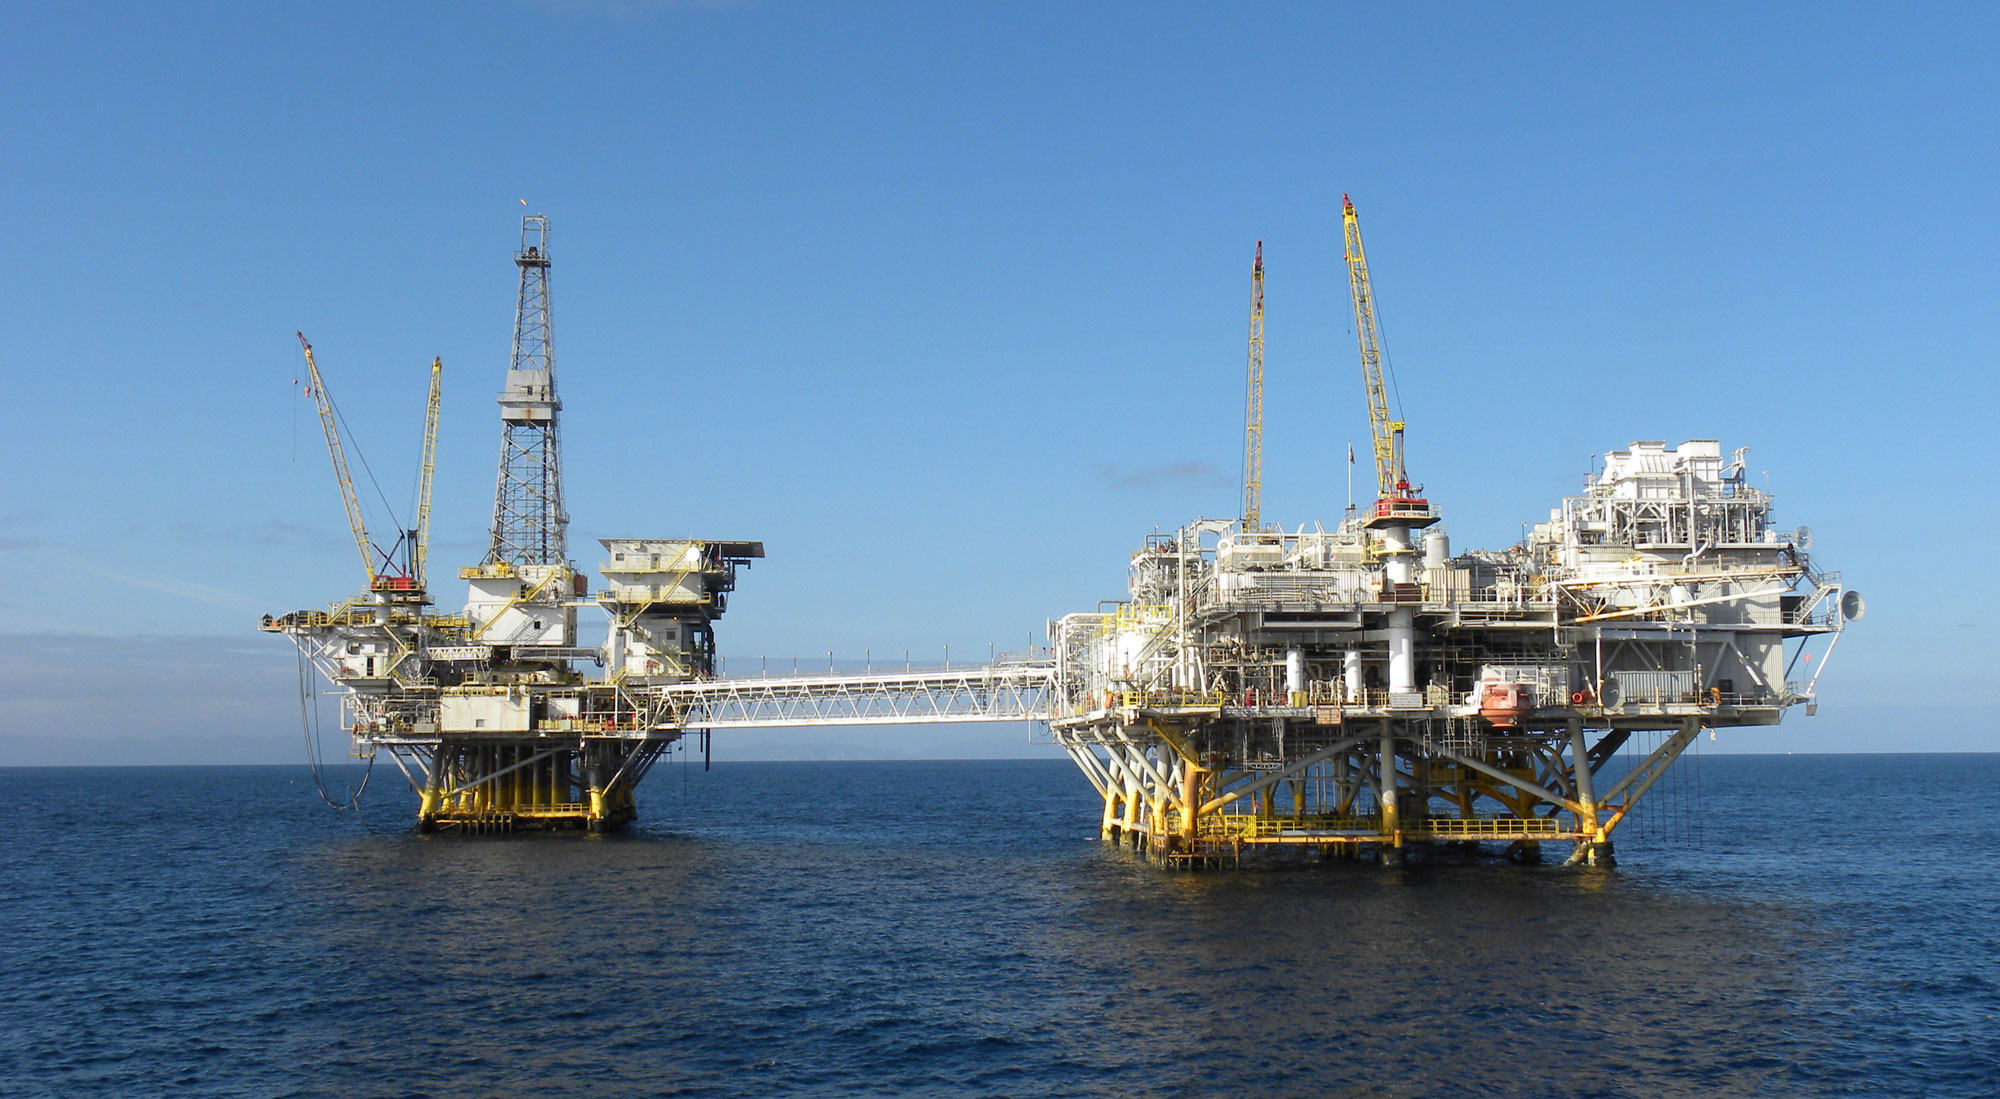
The Elly and Ellen oil platforms off the coast of Long Beach, California, 2012. Photo by Bureau of Safety and Environmental Enforcement (flickr, public domain).
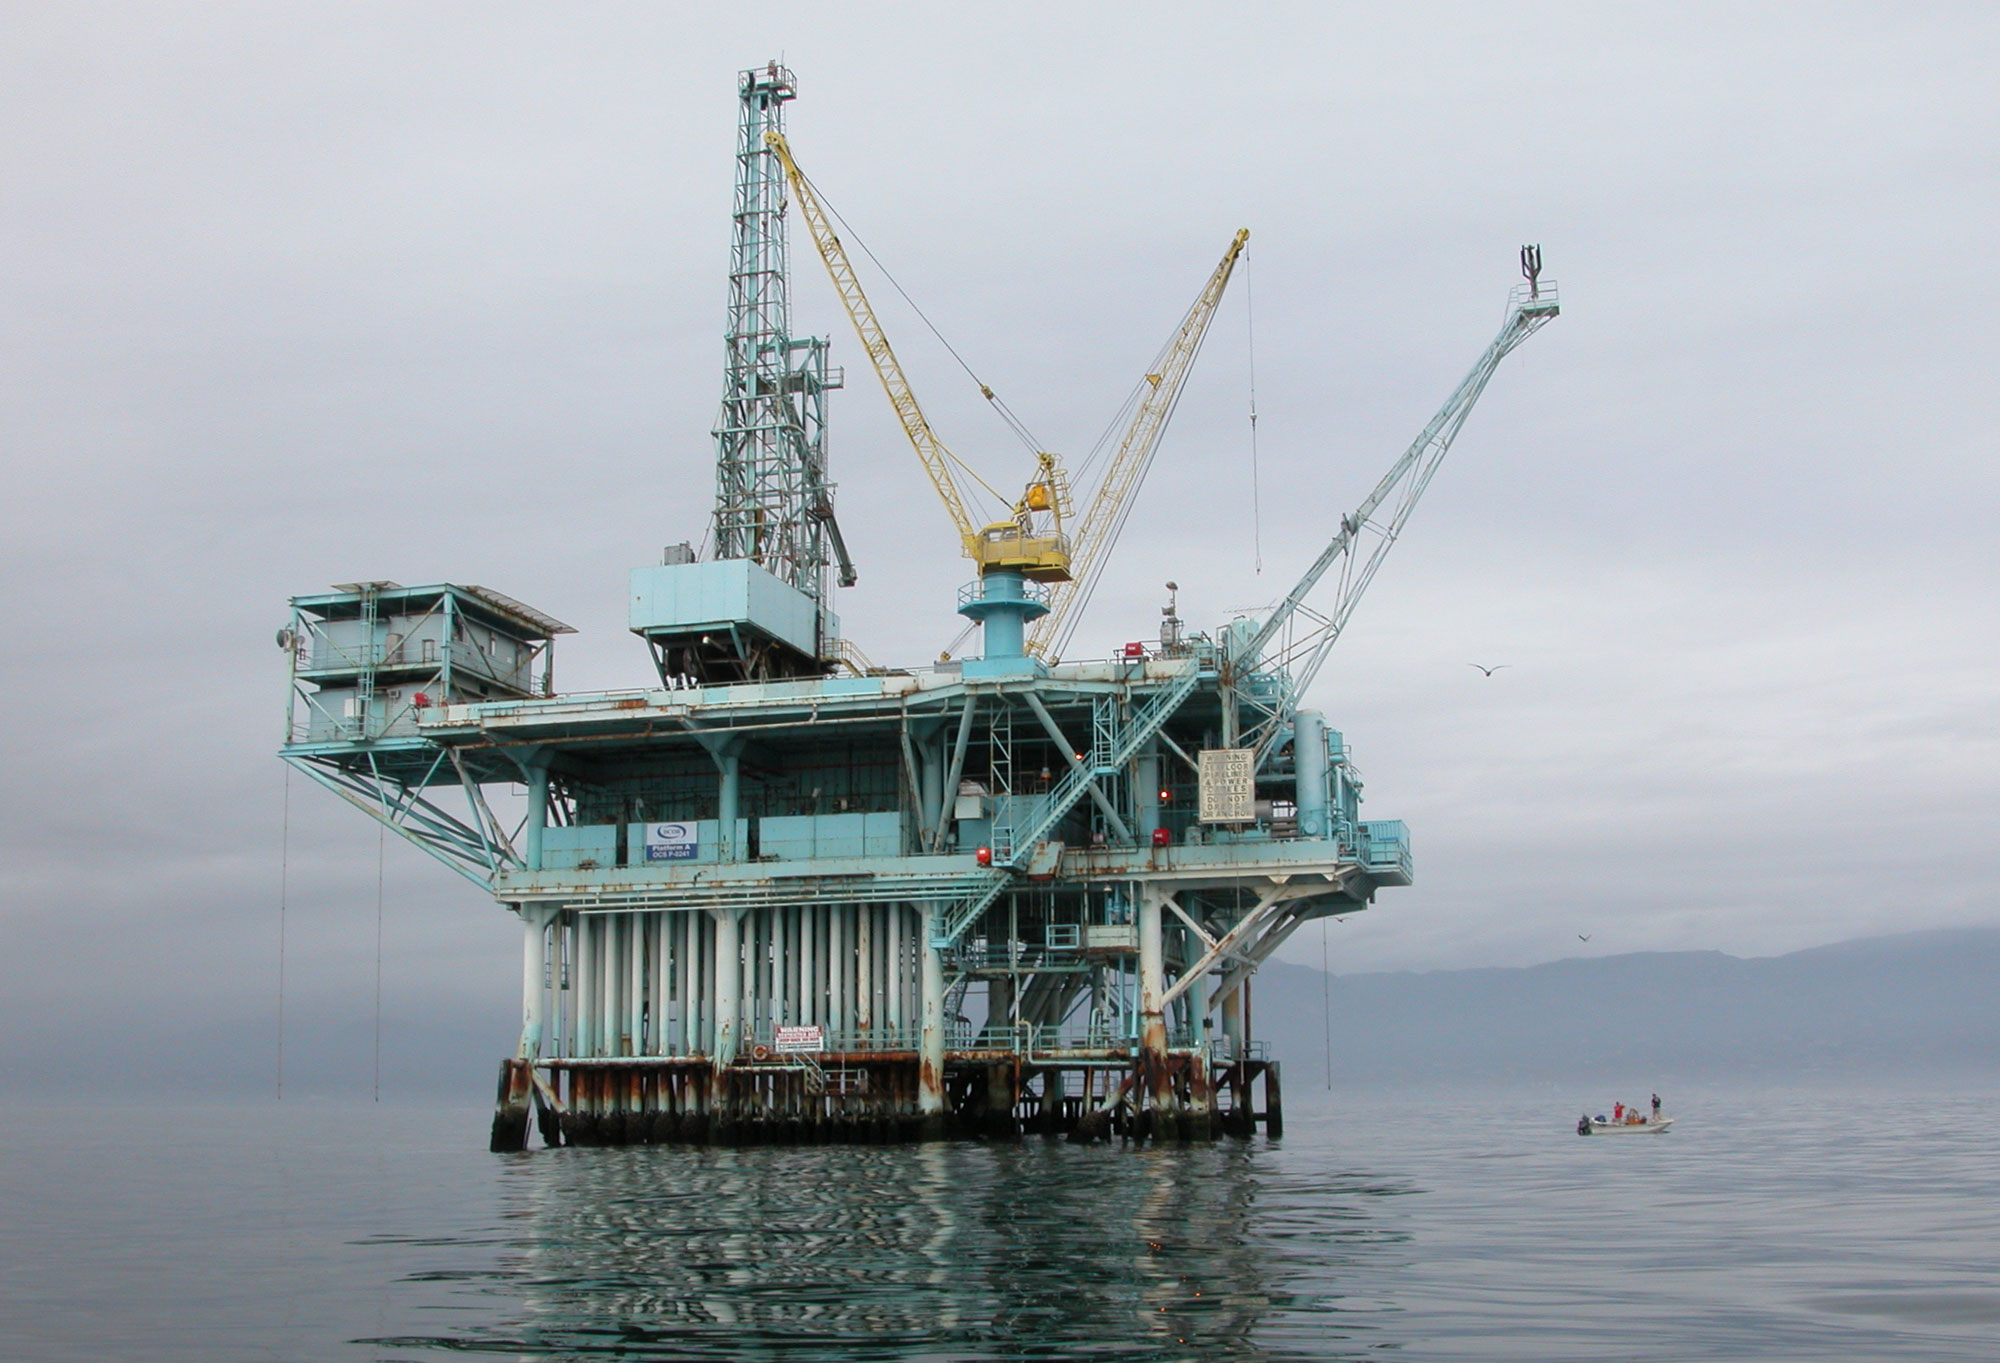
Platform A off the coast of Santa Barbara, California, 2006. This is the oil platform at which the 1969 Santa Barbara oil spill occurred. Photo "sailing_22.jpg" by Doc Searls (flickr, Creative Commons Attribution-ShareAlike 2.0 Generic license, image cropped and resized).
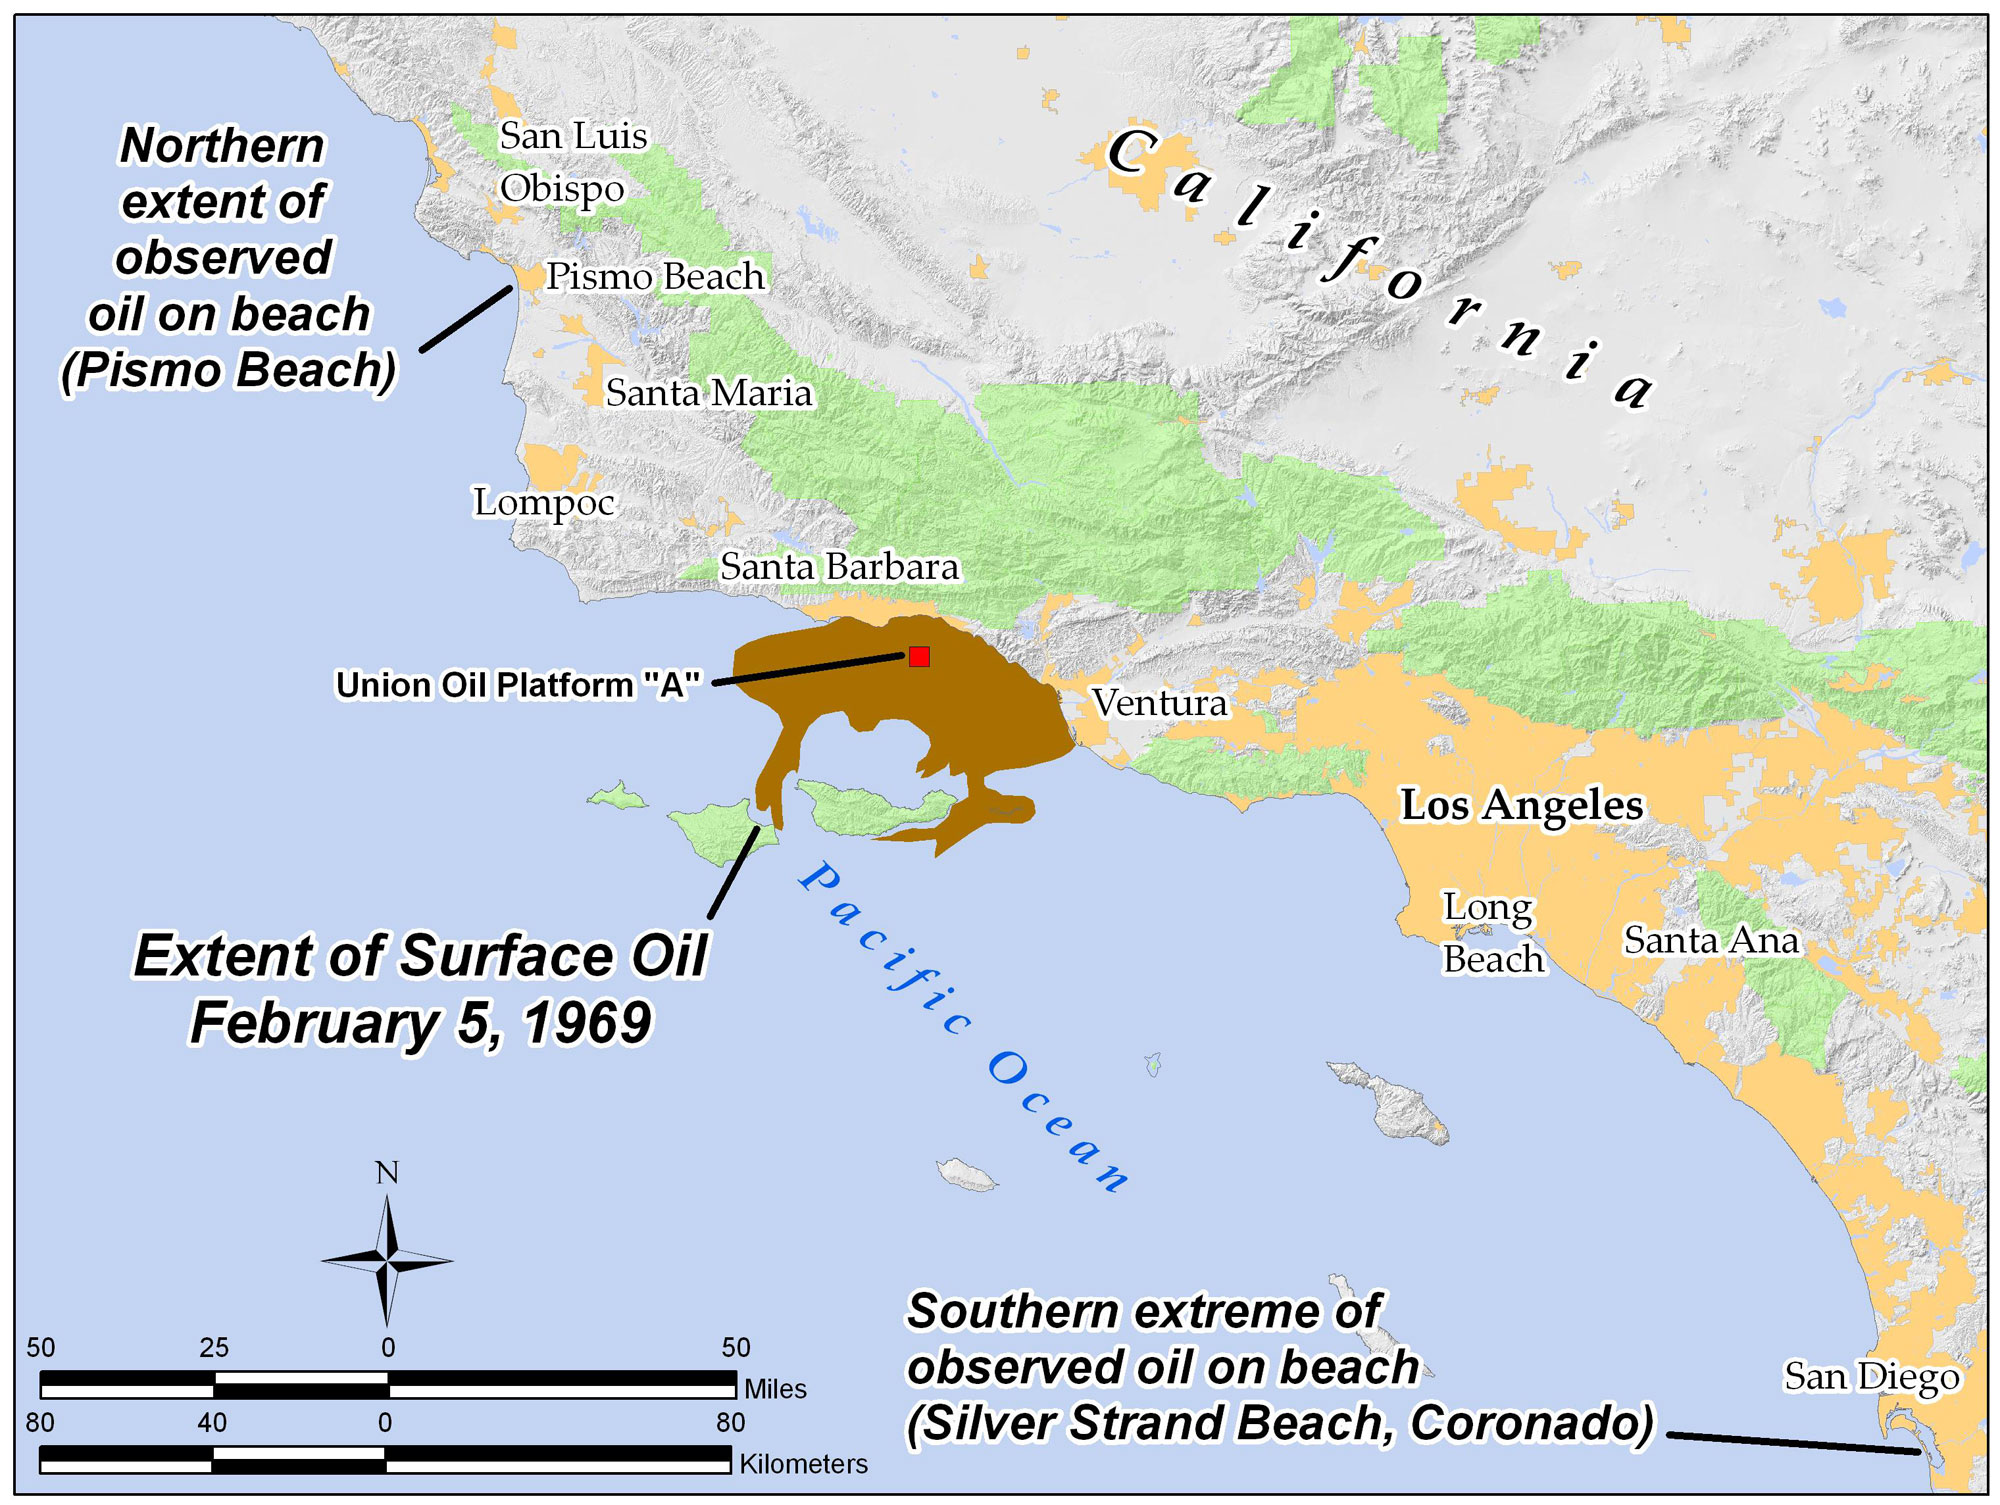
Map of the extent of oil released in the Santa Barbara oil spill as of February 5, 1969. Map by Antandrus (Wikimedia Commons, Creative Commons Attribution-ShareAlike 3.0 Unported license, image resized).
Solar power
California produces the most solar energy in the U.S. As of 2018, California had a total solar capacity of 12,000 MW; as of 2021, more than 15% of the energy generated in the state came from solar. While production of solar electric power has grown exponentially in the U.S. as a whole, production in California vastly outranks the second-largest solar producer (as of 2021, Texas).
Large solar farms have been constructed in the Central Valley, such as the California Valley Solar Ranch and Topaz Solar Farm, both in San Luis Obispo County. These photovoltaic solar farms have a capacity of 250 MW and 550 MW, respectively.
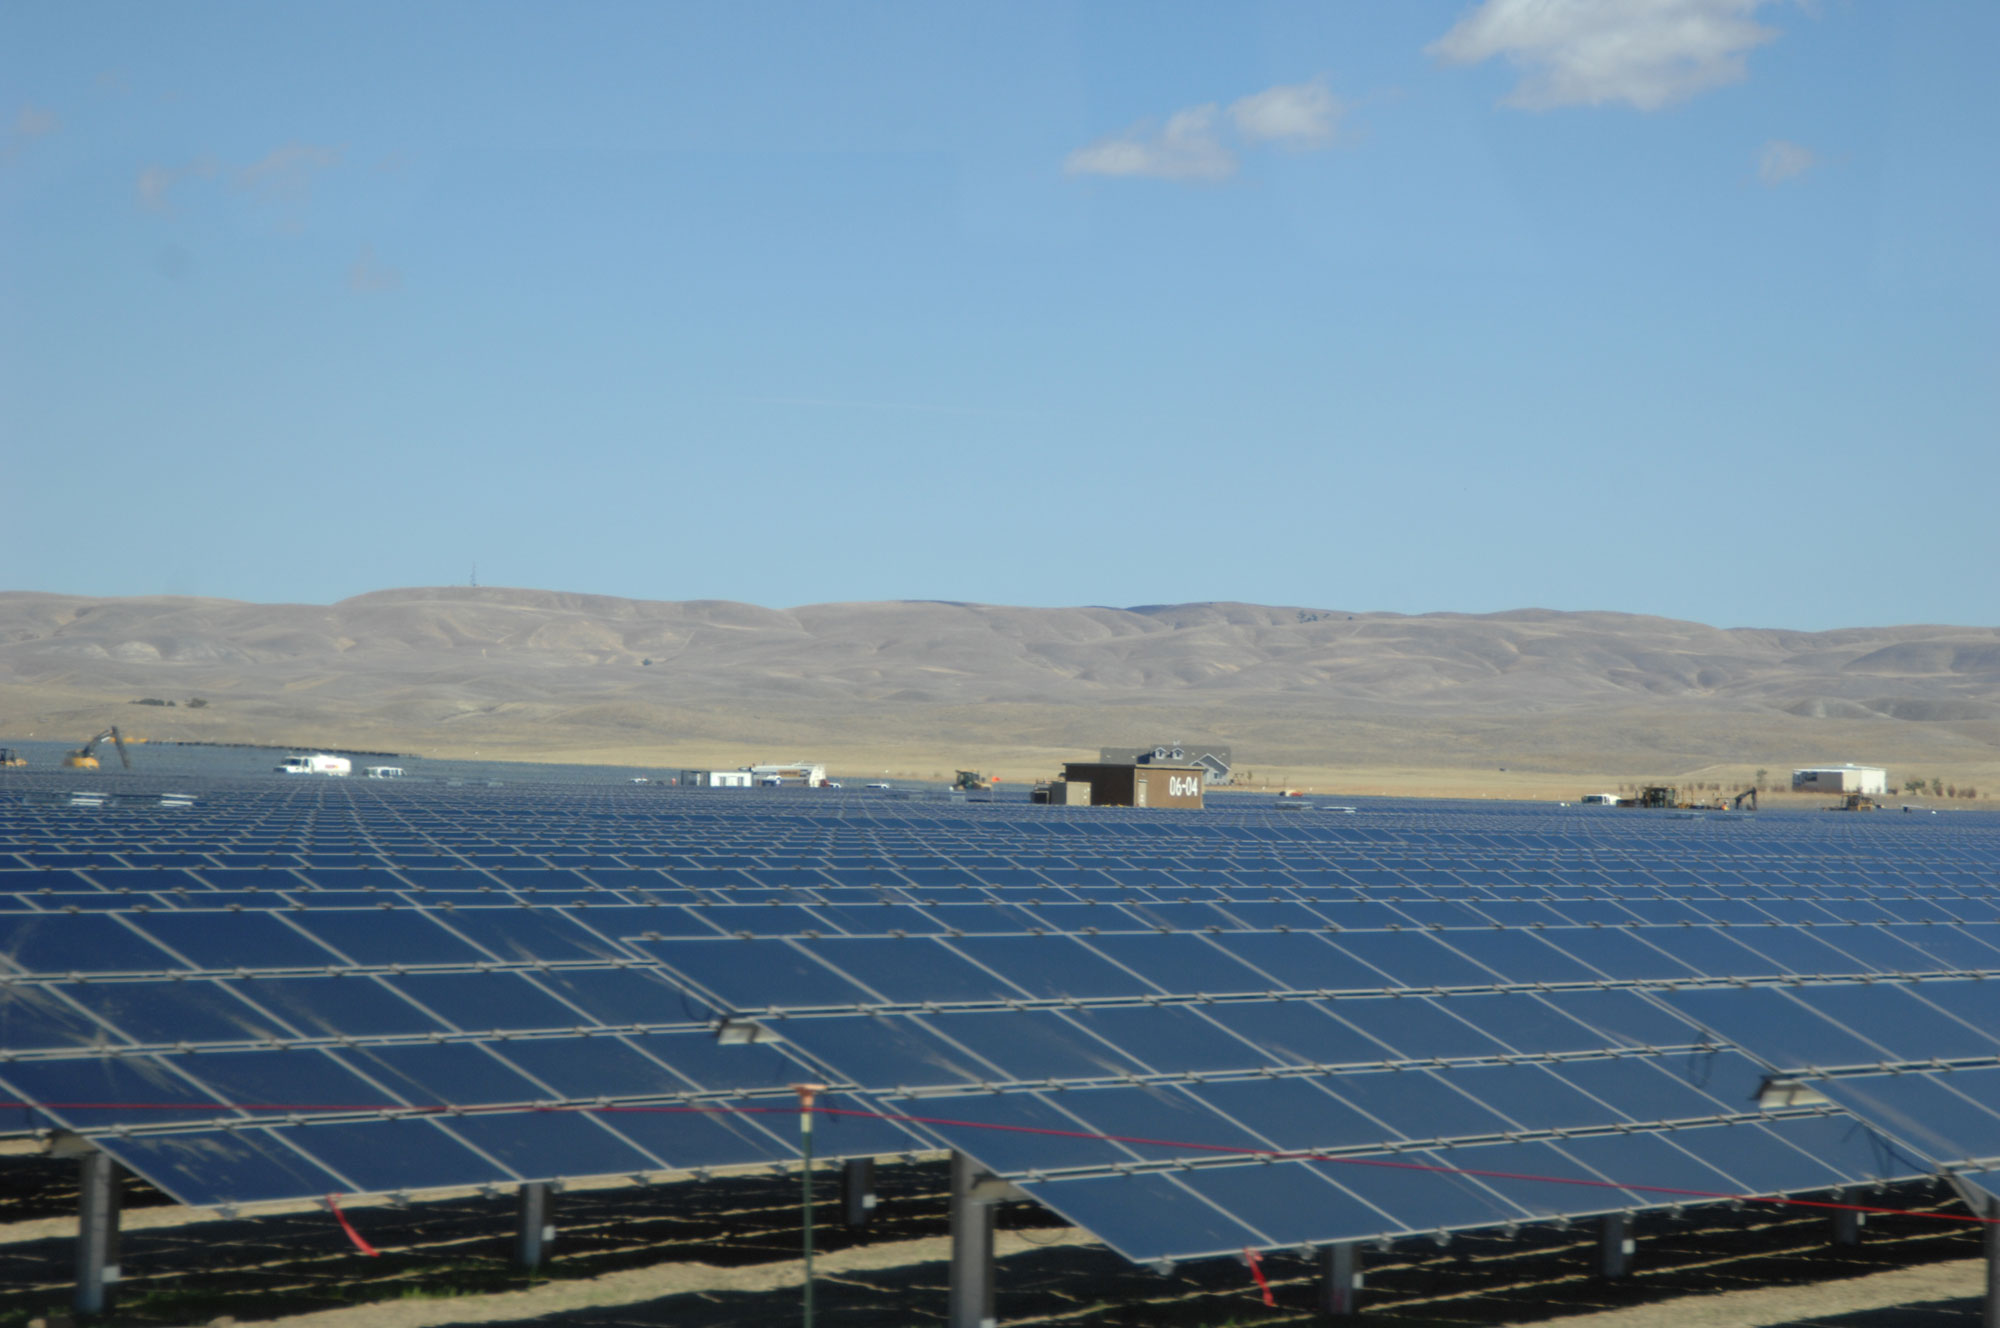
Topaz Solar farm, San Luis Obispo County, California. Photo "Solar Panels at Topaz Solar 7" by Sarah Swenty/USFWS (USFWS Pacific Southwest region of flickr, Creative Commons Attribution 2.0 Generic license, image resized).
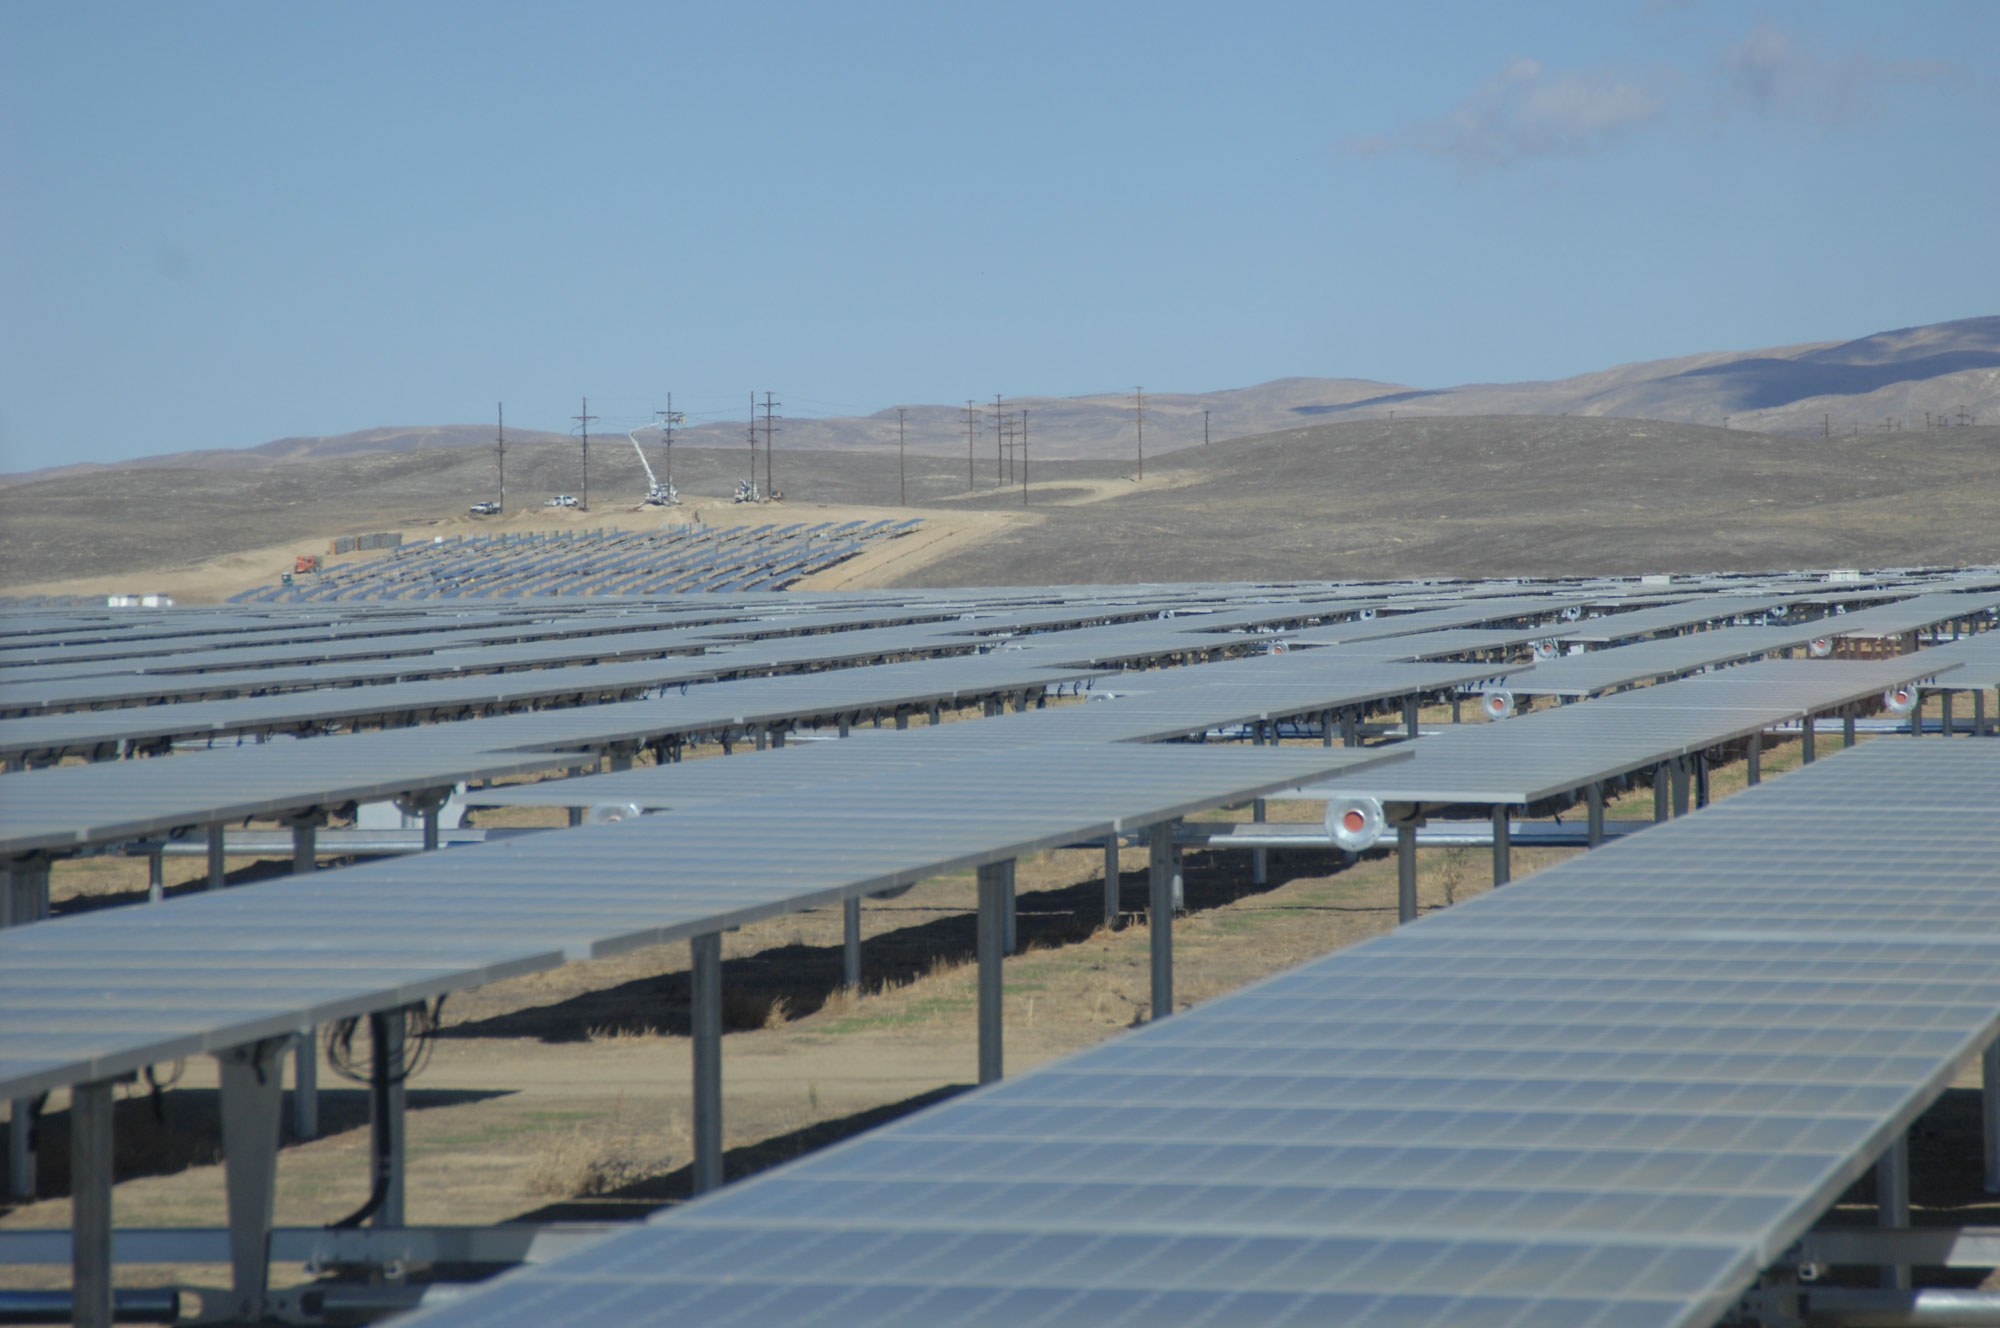
California Valley Solar Ranch, San Luis Obispo County, California. Photo "Solar Panels at California Valley Solar Ranch 2" by Sarah Swenty/USFWS (USFWS Pacific Southwest region of flickr, Creative Commons Attribution 2.0 Generic license, image resized).
Geothermal energy
Geothermal energy comes from heat within the Earth, which is created on an ongoing basis by radioactivity. This energy powers mantle convection and plate tectonics. Coastal California is a tectonically active area where geothermal is being produced. The total geothermal capacity of all plants in California is more than 2700 MW. The Geysers geothermal field in northern California is currently the world’s largest complex of geothermal power plants, containing 22 plants that generate an average of 955 MW.
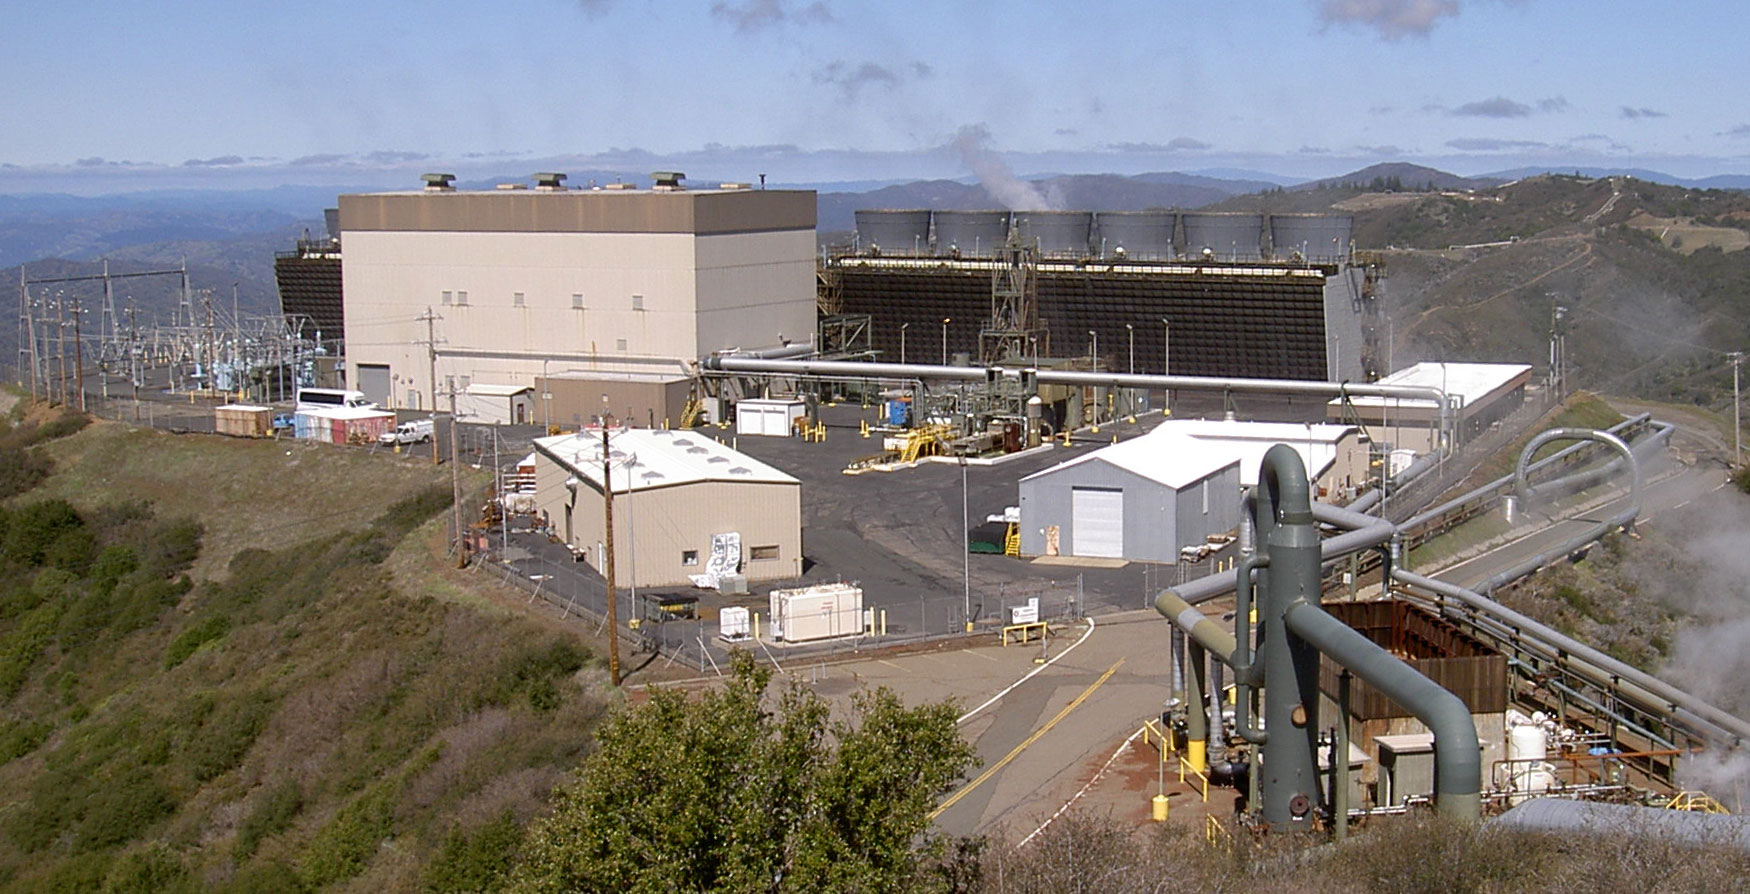
Sonoma Calpine 3 plant at The Geysers geothermal power complex, Sonoma County, California. Photo by Stepheng3 (Wikimedia Commons, CC0 1.0 Universal/Public Domain Dedication).
Hydroelectricity
Hydroelectric plants dot the rivers of the Cascade-Sierra Nevada and Pacific Border regions. The mountainous topography and relatively high precipitation (rainfall and snowpack) in western Oregon and Washington and in the Sierra Nevada of California that feeds the rivers makes hydropower a clean and abundant source energy.
Nevertheless, increasing aridity driven by climate change may limit hydroelectric power generation in the future. Drought and water shortages are already affecting energy production and supply. For example, the hydroelectric plant on Lake Oroville, a reservoir in northern California, had to be shut down in August 2021 because water levels fell too low to sustain power generation.
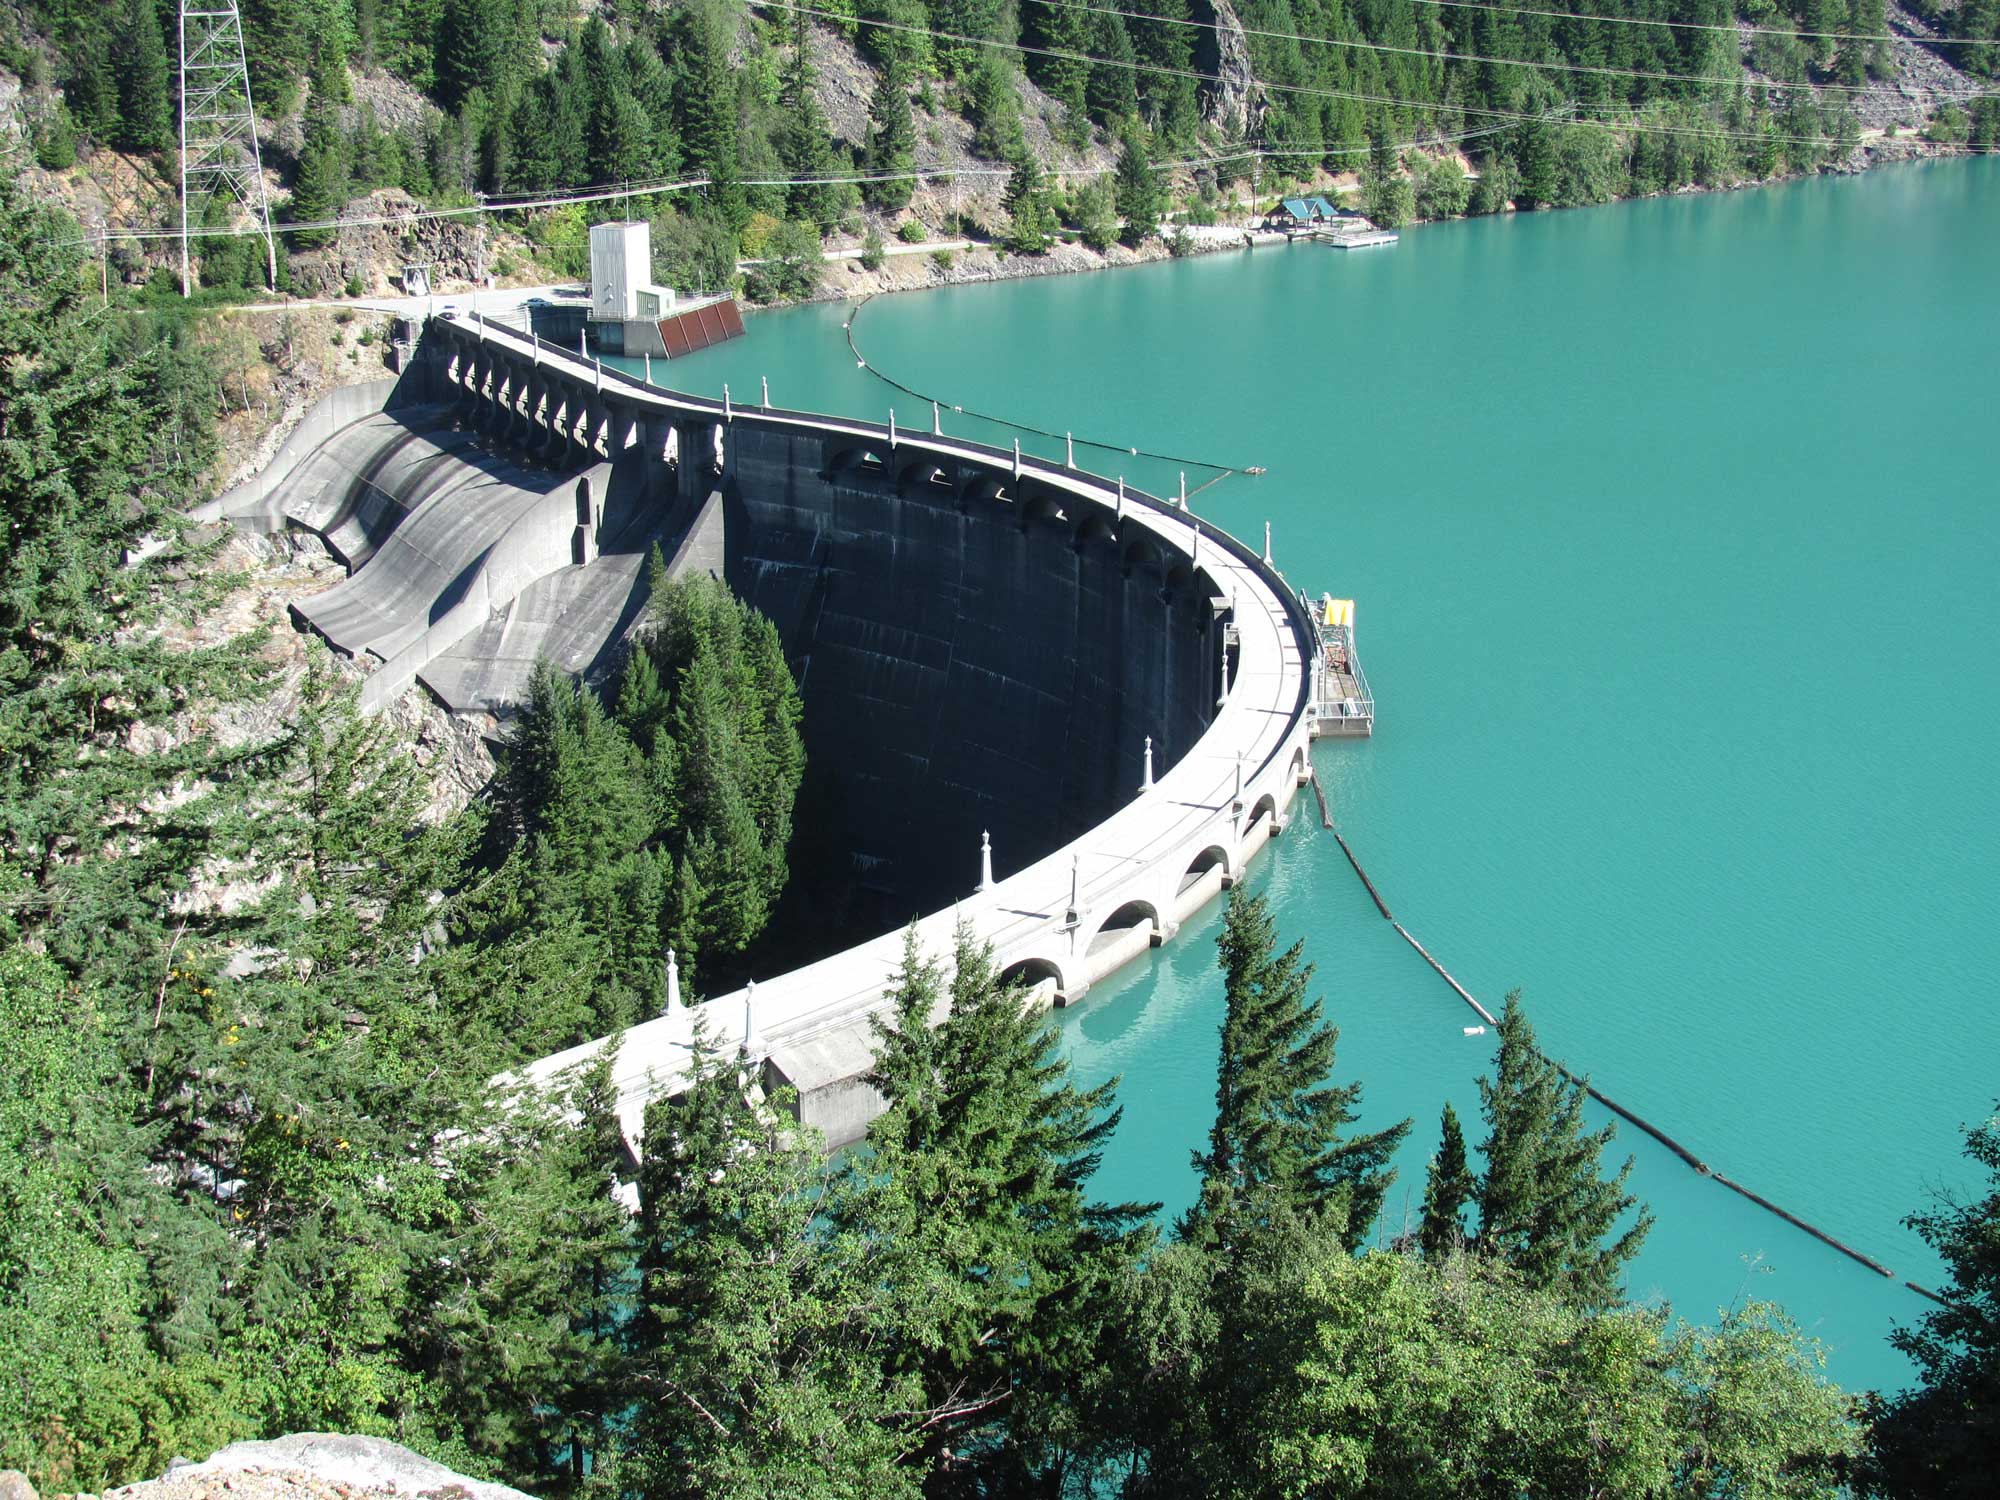
Diablo Dam on the Skagit River, northwestern Washington, 2010. Photo by Robert Ashworth (flickr, Creative Commons Attribution 2.0 Generic license, image resized).
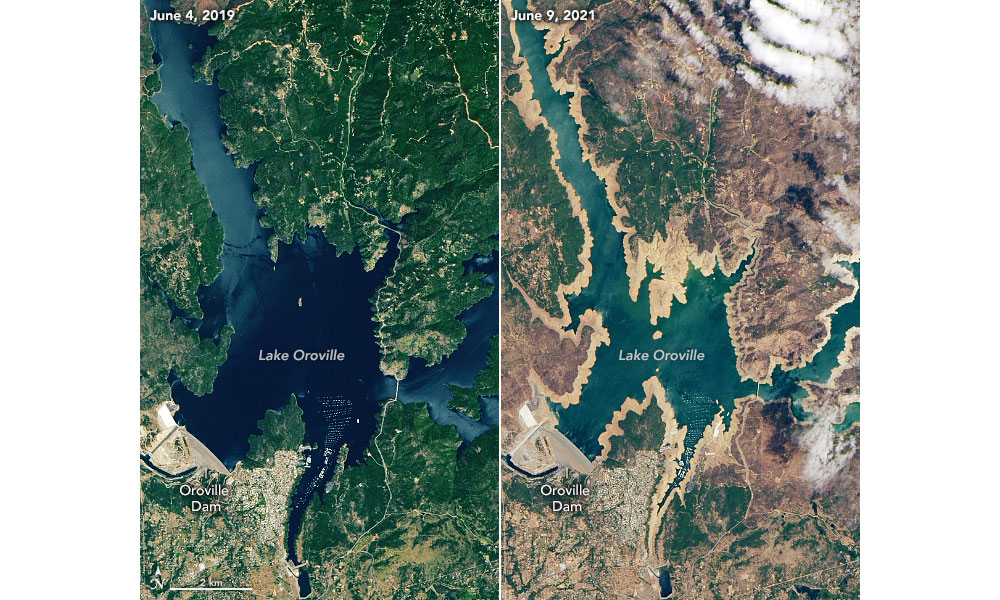
Satellite images of Lake Oroville, a reservoir in northern California. Left: At capacity (highest level), June 2019. Right: At a much lower water level due to drought, June 2021. In August 2021, the Edward Hyatt Power Plant, a hydroelectric plant on Lake Oroville, was shut down because water levels were too low. Source: USGS (public domain).
Salmon, steelhead, and dams
While dams and hydroelectric plants are sources of abundant clean energy, they also have some negative environmental impacts. Dams in the Cascade-Sierra Nevada and Pacific Border regions have caused populations of salmon and steelhead to drop. These fish are anadromous, meaning that they live in the ocean but spawn in freshwater. They swim many miles upstream from the ocean to spawn, and dams are barriers that can prevent them from reaching their spawning grounds. Furthermore, turbines can injure or kill young salmon swimming downstream to the ocean.
The problems caused by dams have been partially addressed, although the solutions are imperfect, and salmon and steelhead populations remain in peril. Fish ladders, structures that allow adult fish to maneuver around dams to travel upstream to spawning grounds, have been built on some dams. Fish hatcheries run by U.S. government agencies and Native American nations help augment the reduced fish populations.
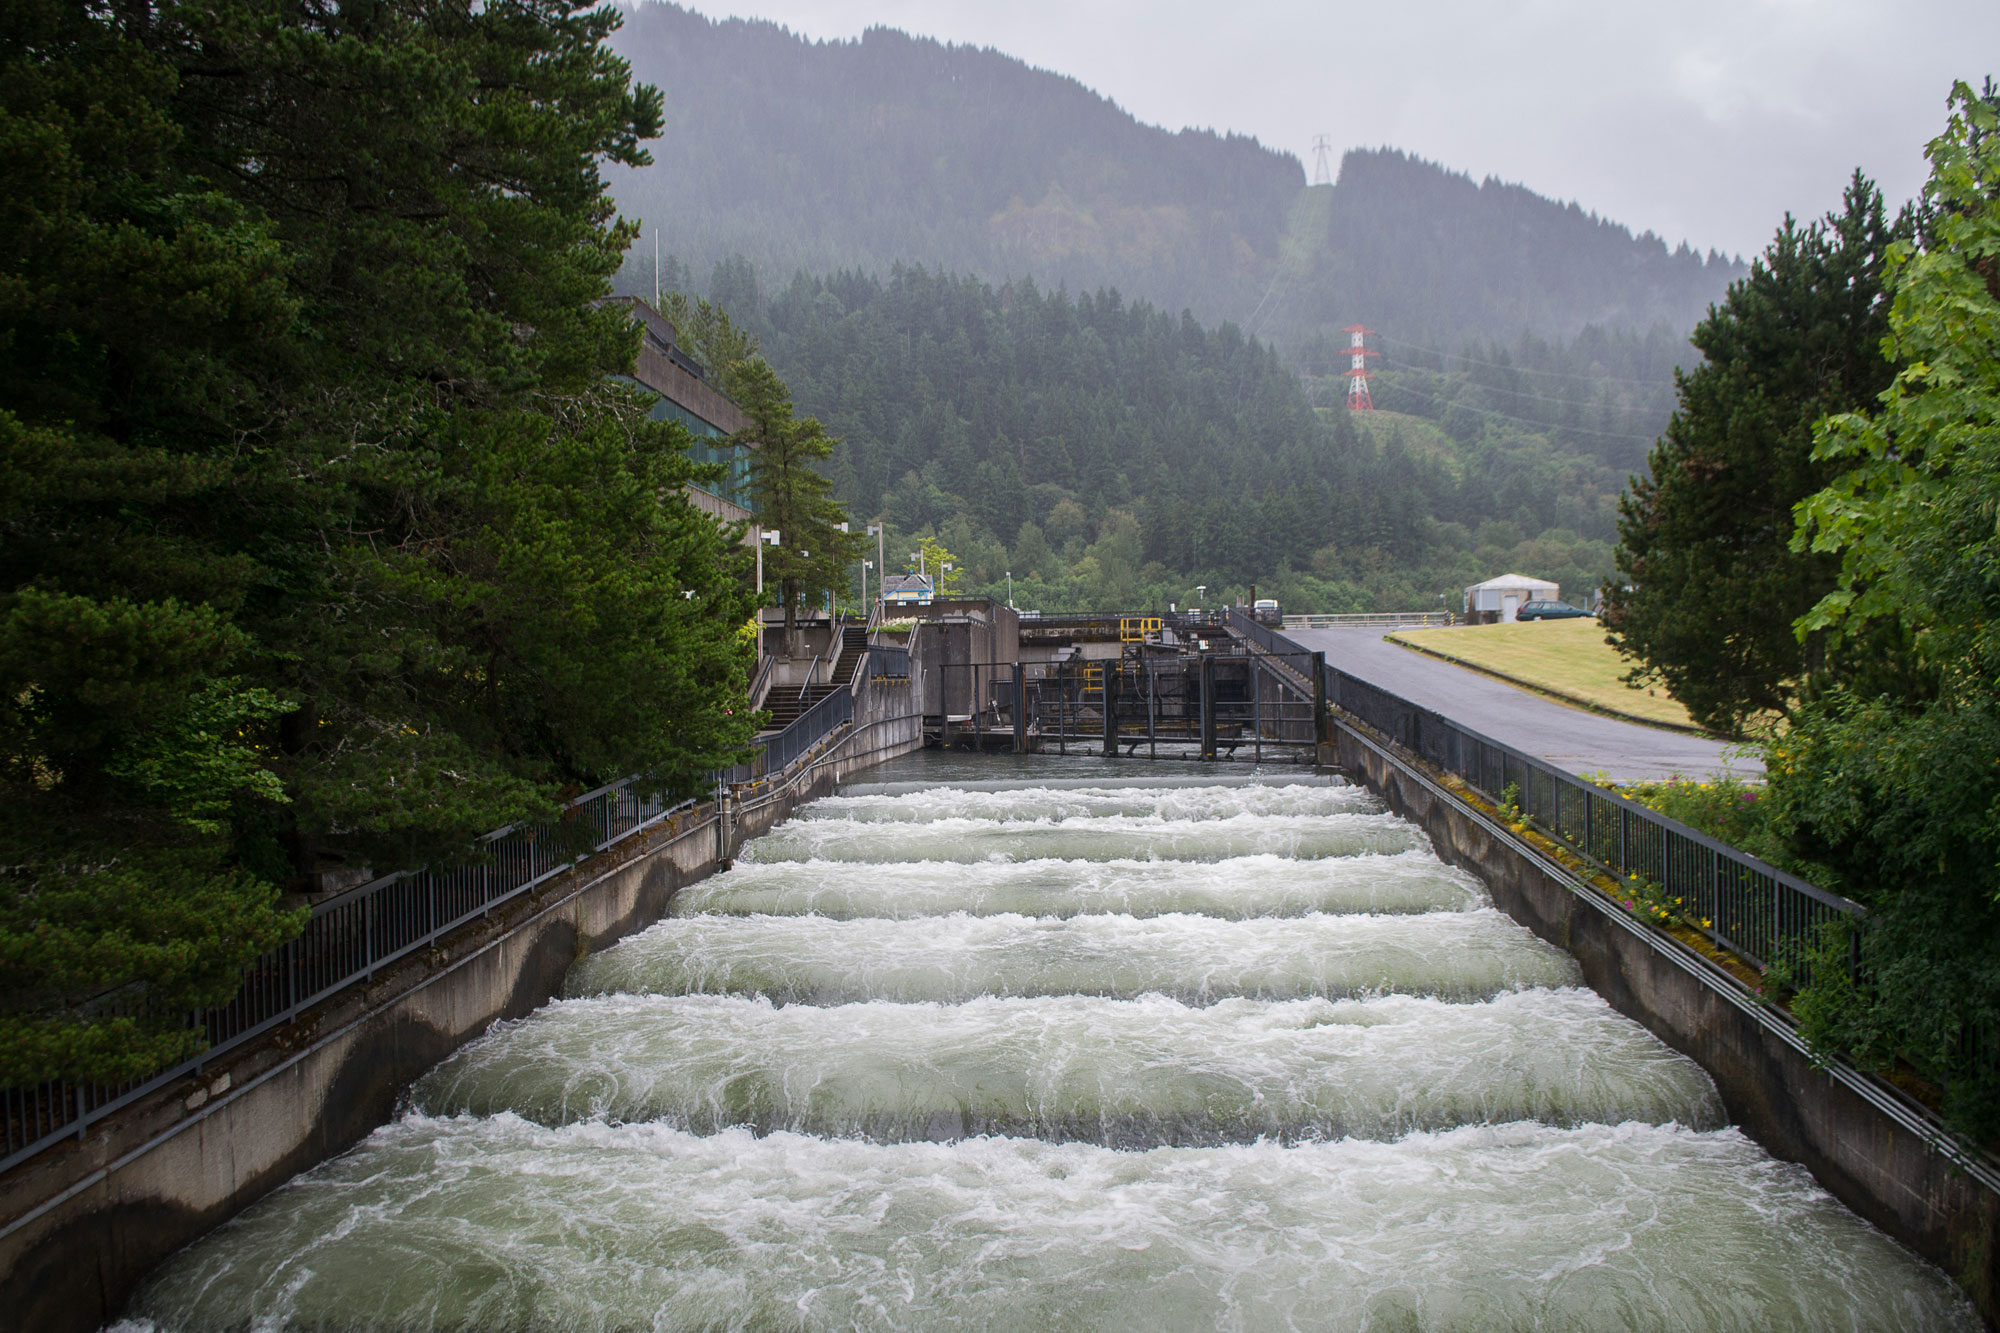
A fish ladder on the Bonneville Dam, Columbia River, Oregon. Photo by Visitor7 (Wikimedia Commons, Creative Commons Attribution-ShareAlike 3.0 Unported license, image resized).
Dam removal
Dams have been removed or are under consideration for removal in certain areas. For example, Elwha Dam (dating to 1913) and the Glines Canyon Dam (dating to 1927) on the Elwha River in Olympic National Park, Washington, were removed in 2011 and 2014, respectively. Both of these dams were used to run relatively small (less than 15 MW each) hydroelectric plants. Restoration of the Elwha River continues, and the degree to which anadromous fish populations may rebound remains to be seen.
Native American nations and environmental groups in the region have advocated for the removal of dams on the Klamath River in northern California. These dams have caused the numbers of salmon spawning in the river to plummet. Four dams in the lower Klamath River are now scheduled for removal beginning in 2023. While the dams do provide power to the region, their role can be taken over by existing wind farms. Despite the plan for dam removal, there are fears that the salmon population could completely collapse in parts or all of the Klamath River Basin.
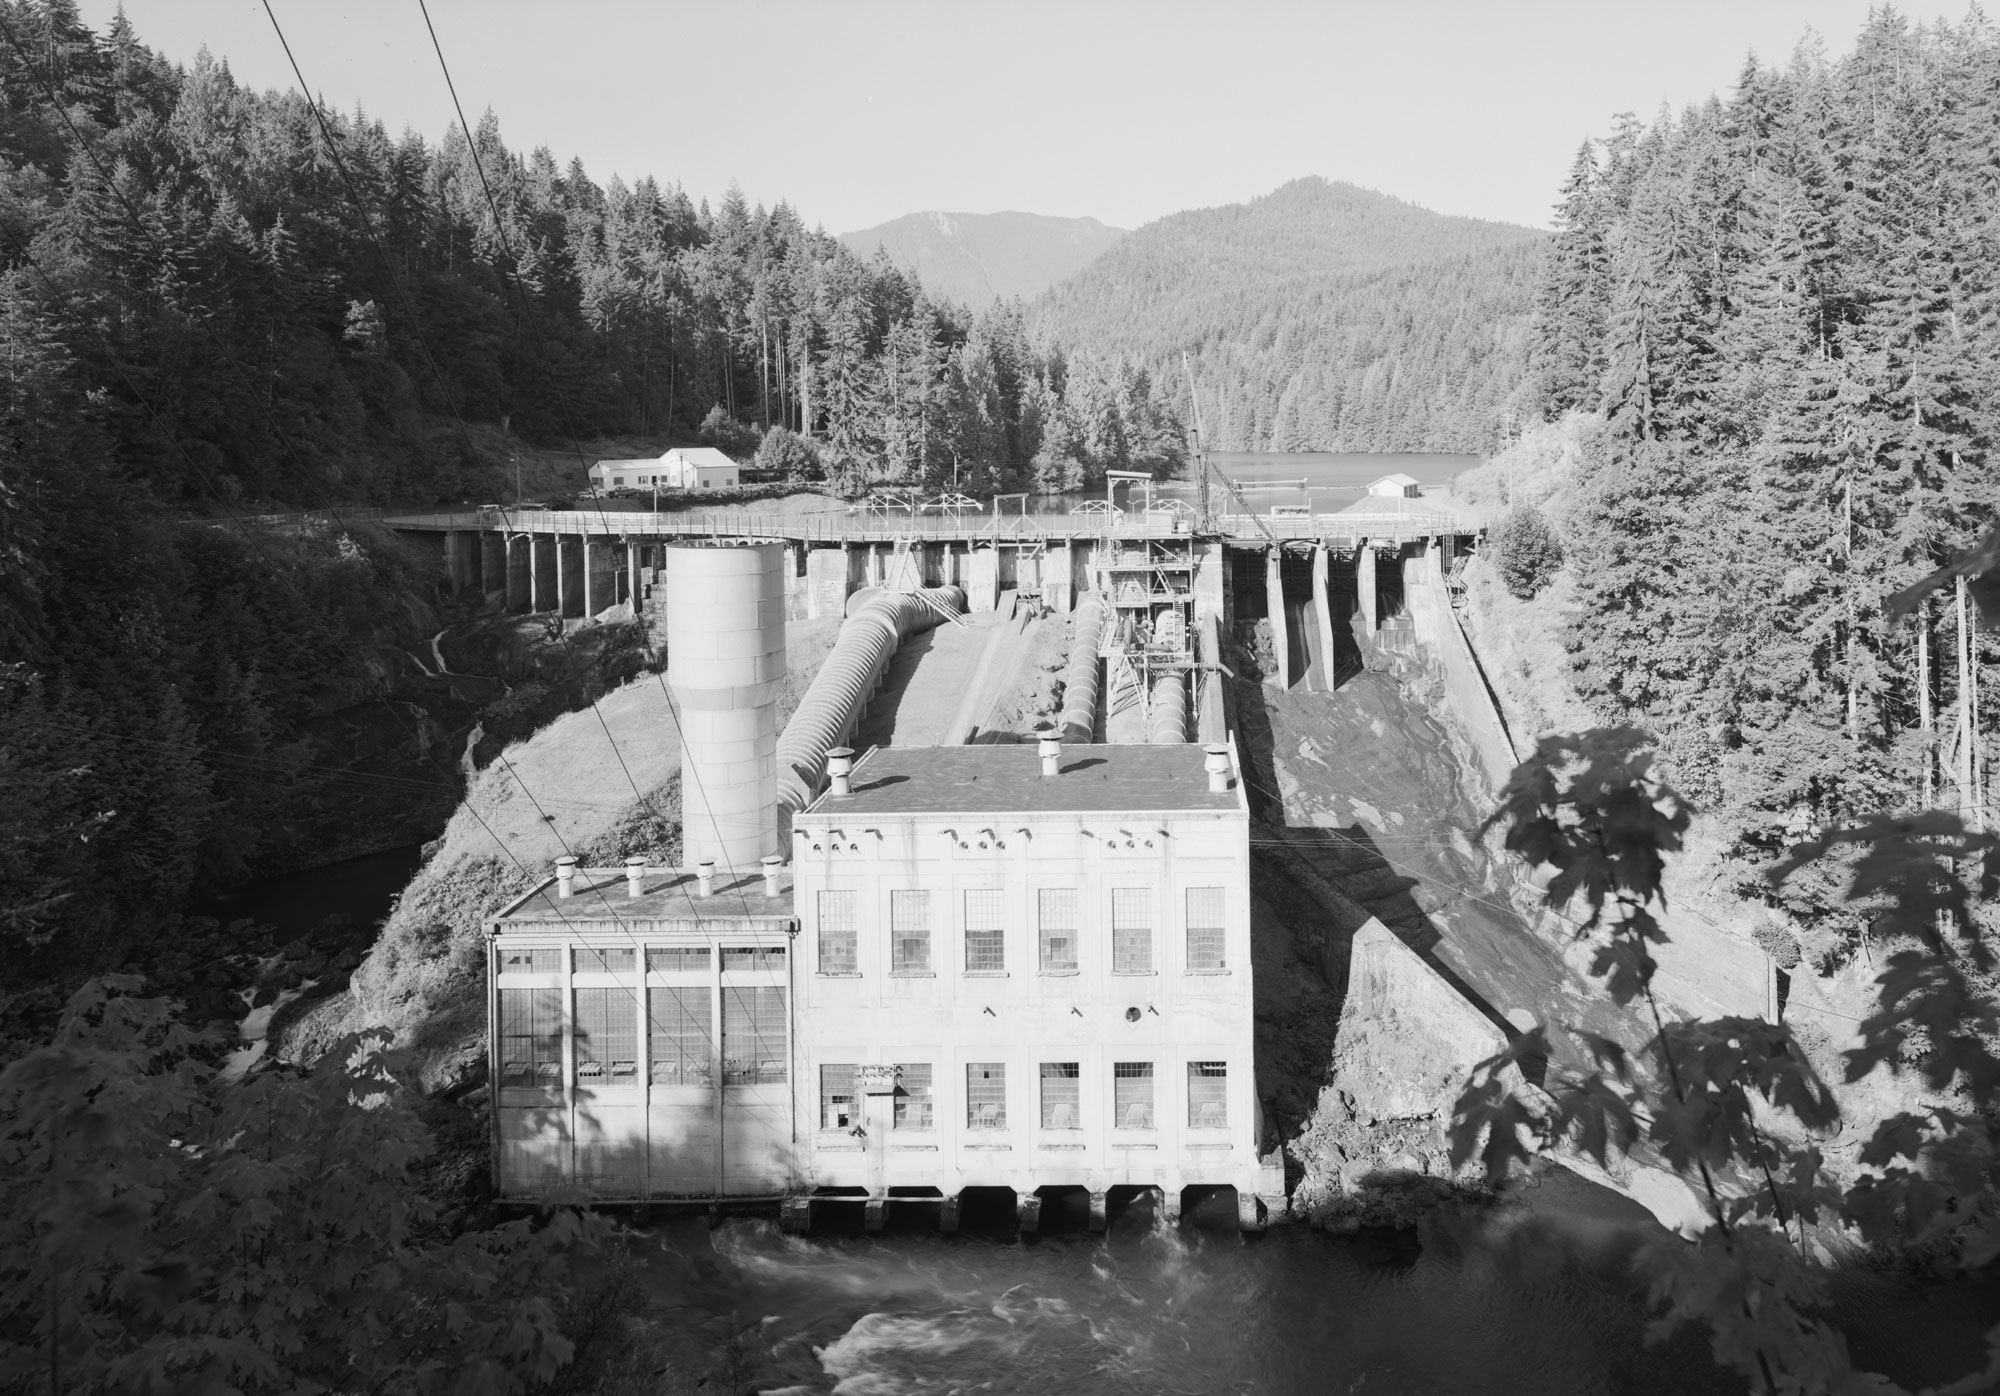
Elwha Dam and hydroelectric plant on the Elwha River, Clallam County, Washington, 1995. This plant had a capacity of 14.8 MW. Source: Library of Congress, Prints & Photographs Division, Historic American Engineering Record (HAER), Control number wa0604 (no known restrictions on images made by the U.S. Government).
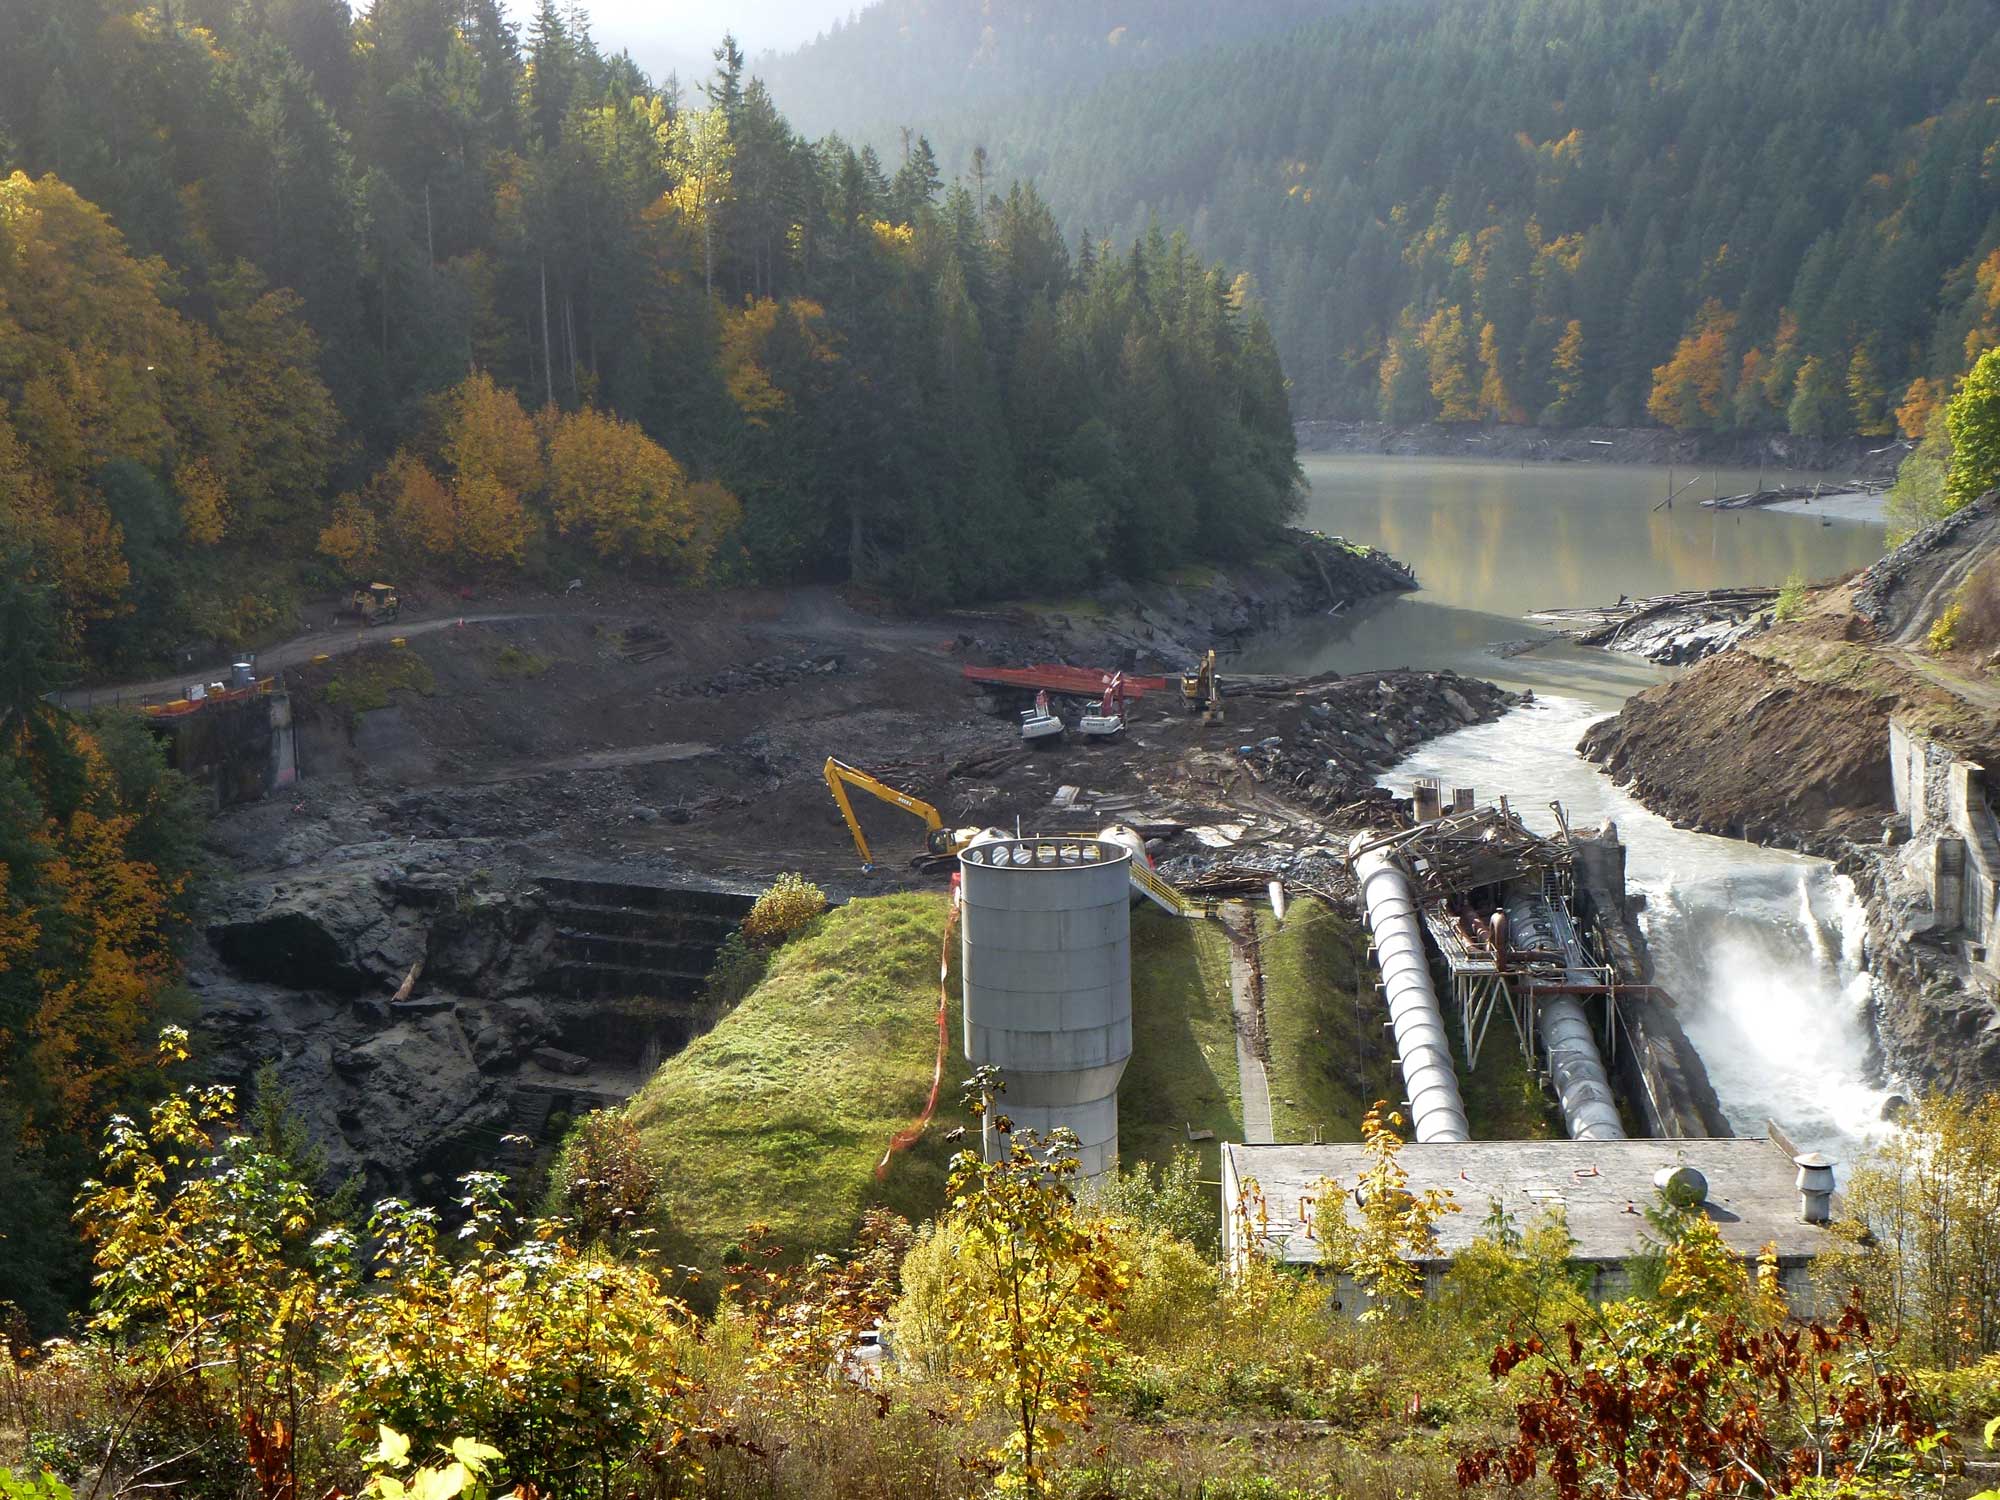
Elwha Dam being removed from the Elwha River, Clallam County, Washington, 2011. Photo by Kate Benkert, UWFWS (United States Fish and Wildlife Service-Pacific Region on flickr, Creative Commons Attribution-NonCommercial 2.0 Generic license, image resized).
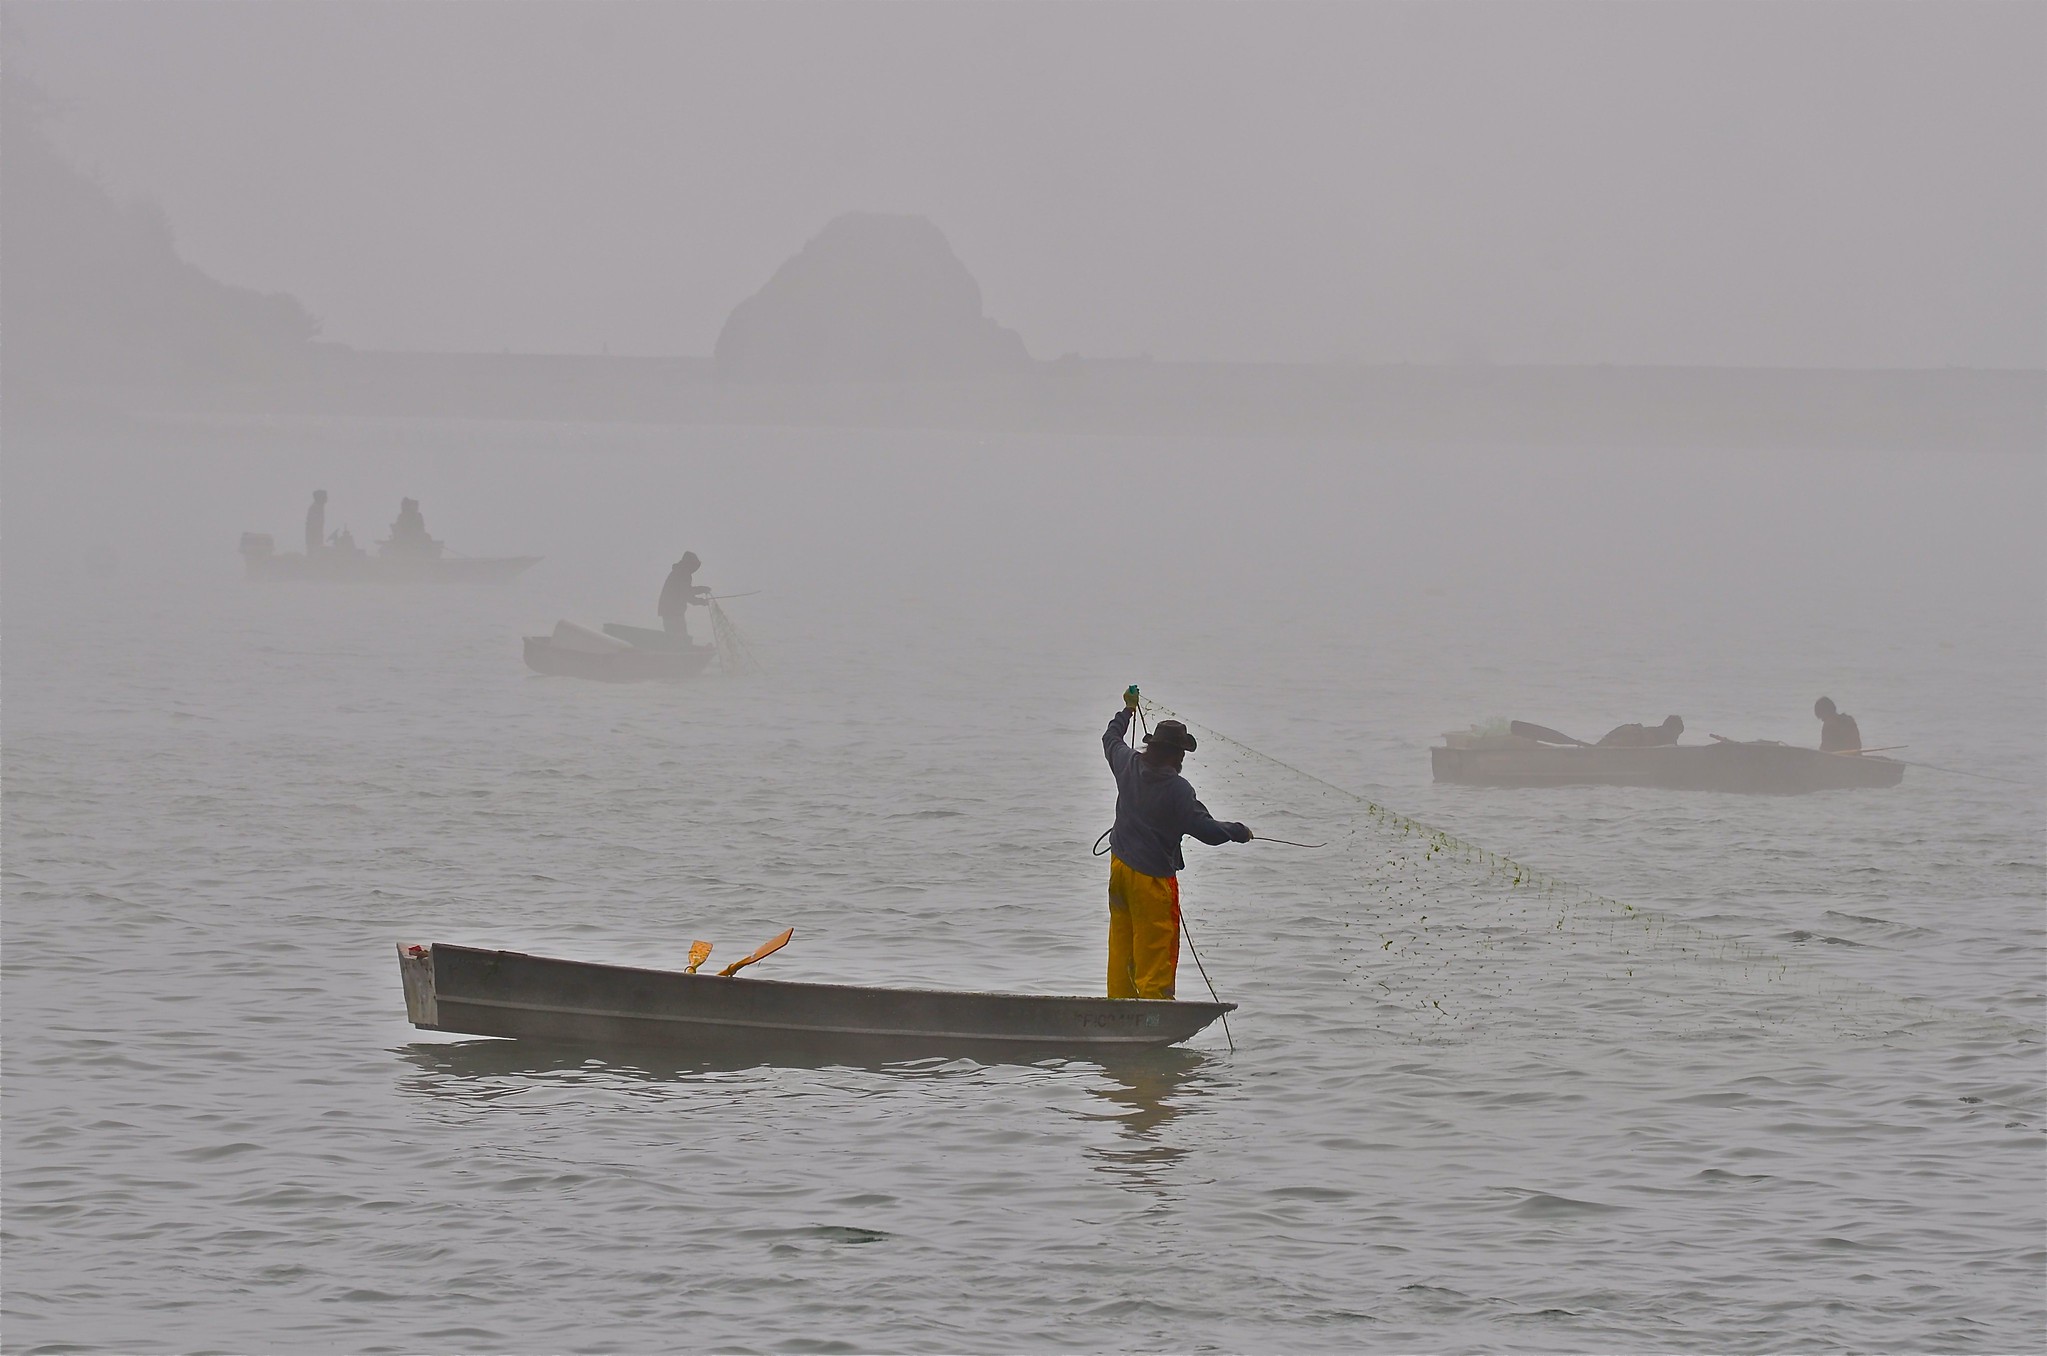
Yurok people fishing on the Klamath River, 2011. The Yurok Tribe has long fought for dam removal to sustain salmon populations, as salmon is traditionally an important source of food. Photo "Yurok Fishermen on the Klamath River" by Linda Tanner (flickr, Creative Commons Attribution-NonCommercial-NoDerivs 2.0 Generic license, image resized).
Wind energy
California is also first in large-scale wind energy production in the U.S. In fact, the Altamont Pass Wind Farm, with 4930 wind turbines that produce 1.1 terawatt-hours (TWh) yearly, is the largest array of wind turbines with the greatest production capacity in the world.
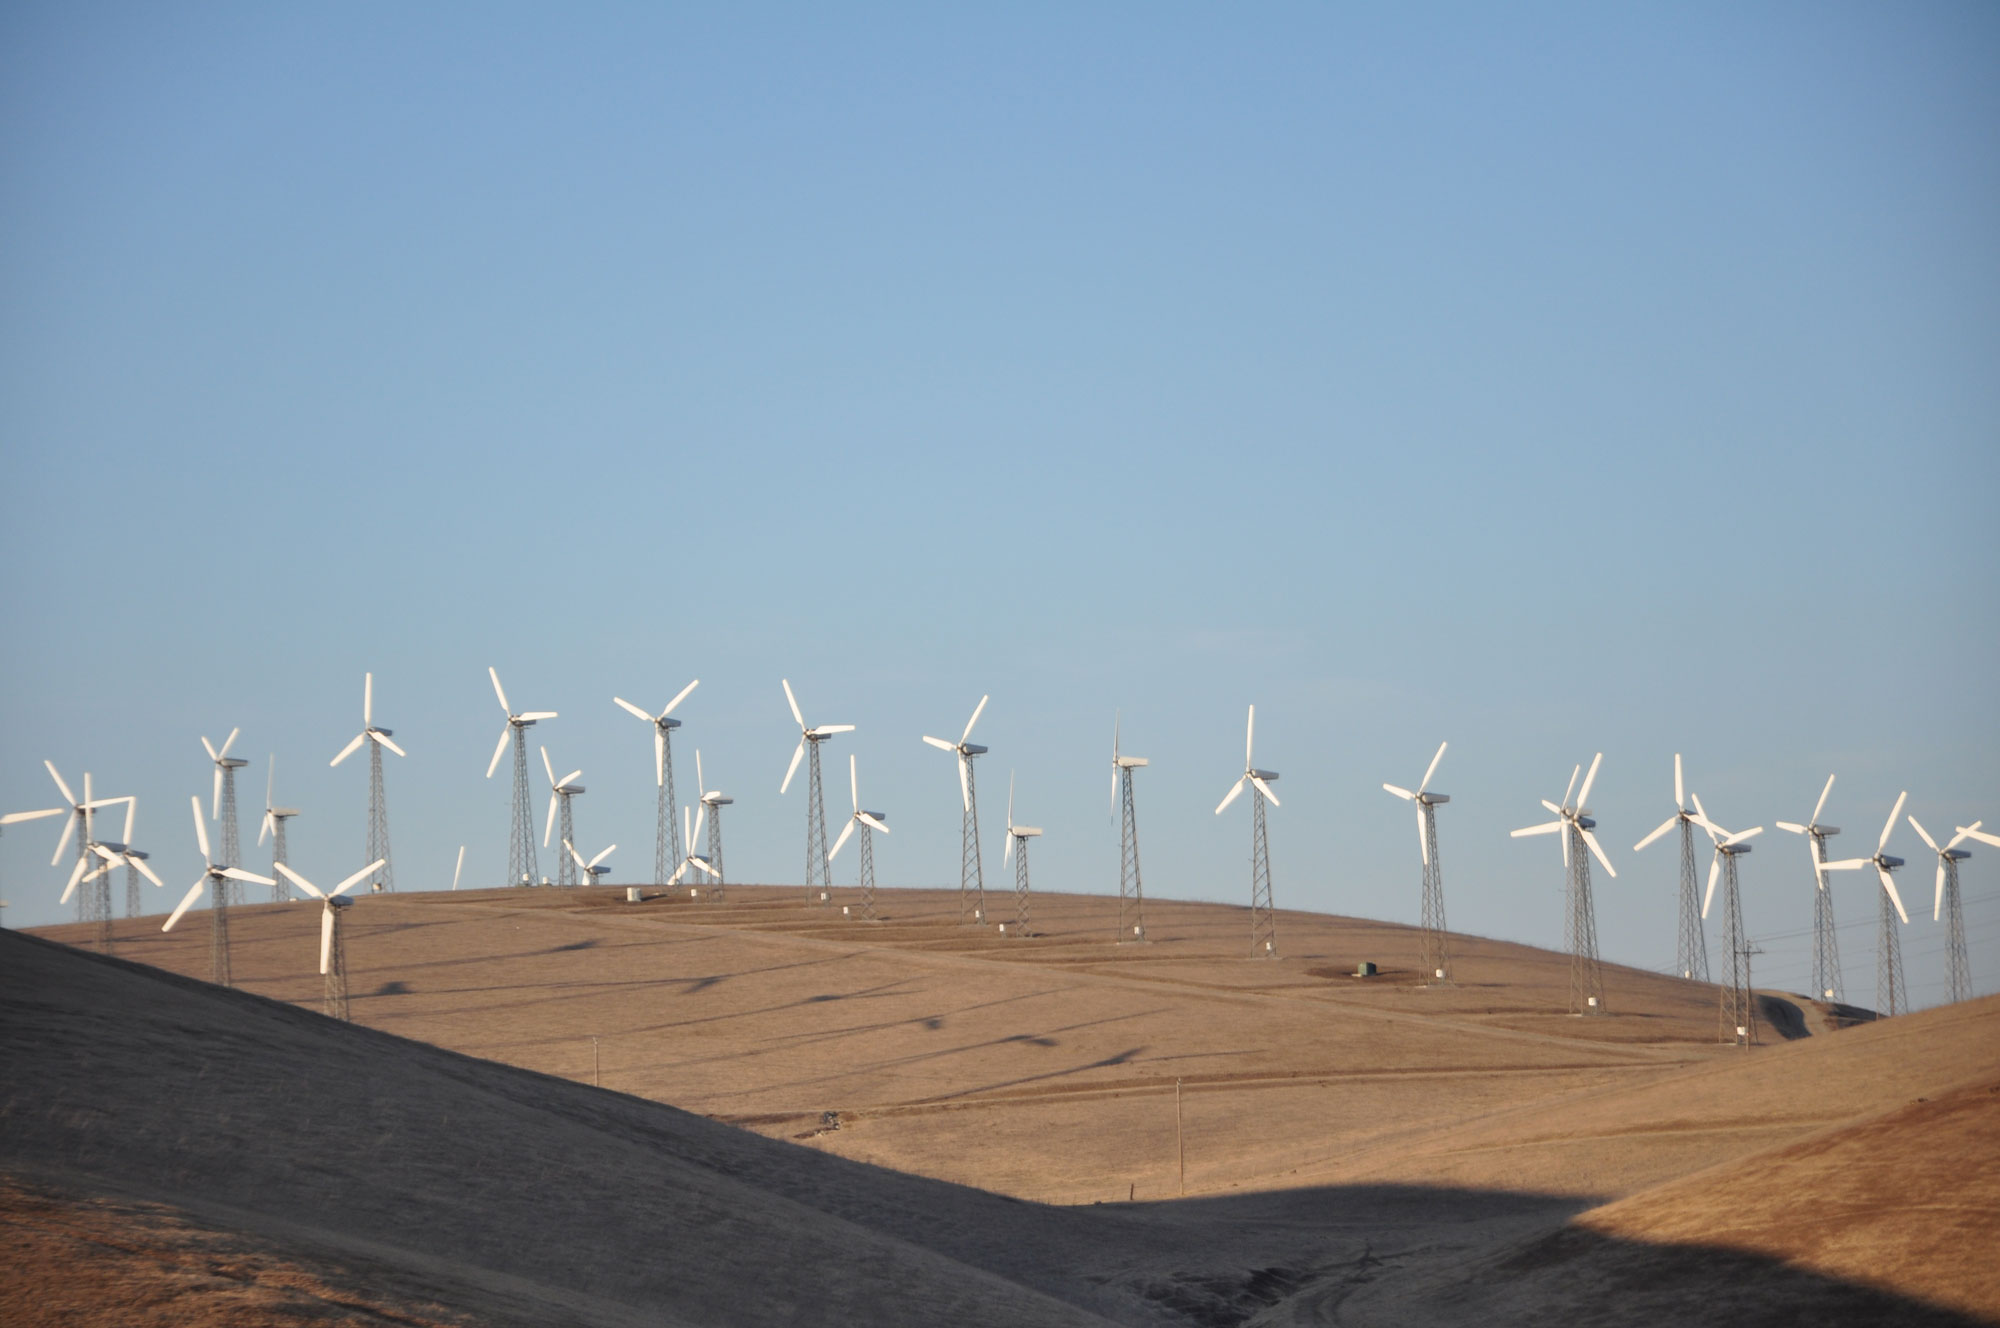
Altamont Pass Wind Farm, Alameda County, California. Photo by Eric Molina (Wikimedia Commons, Creative Commons Attribution 2.0 Generic license, image resized).
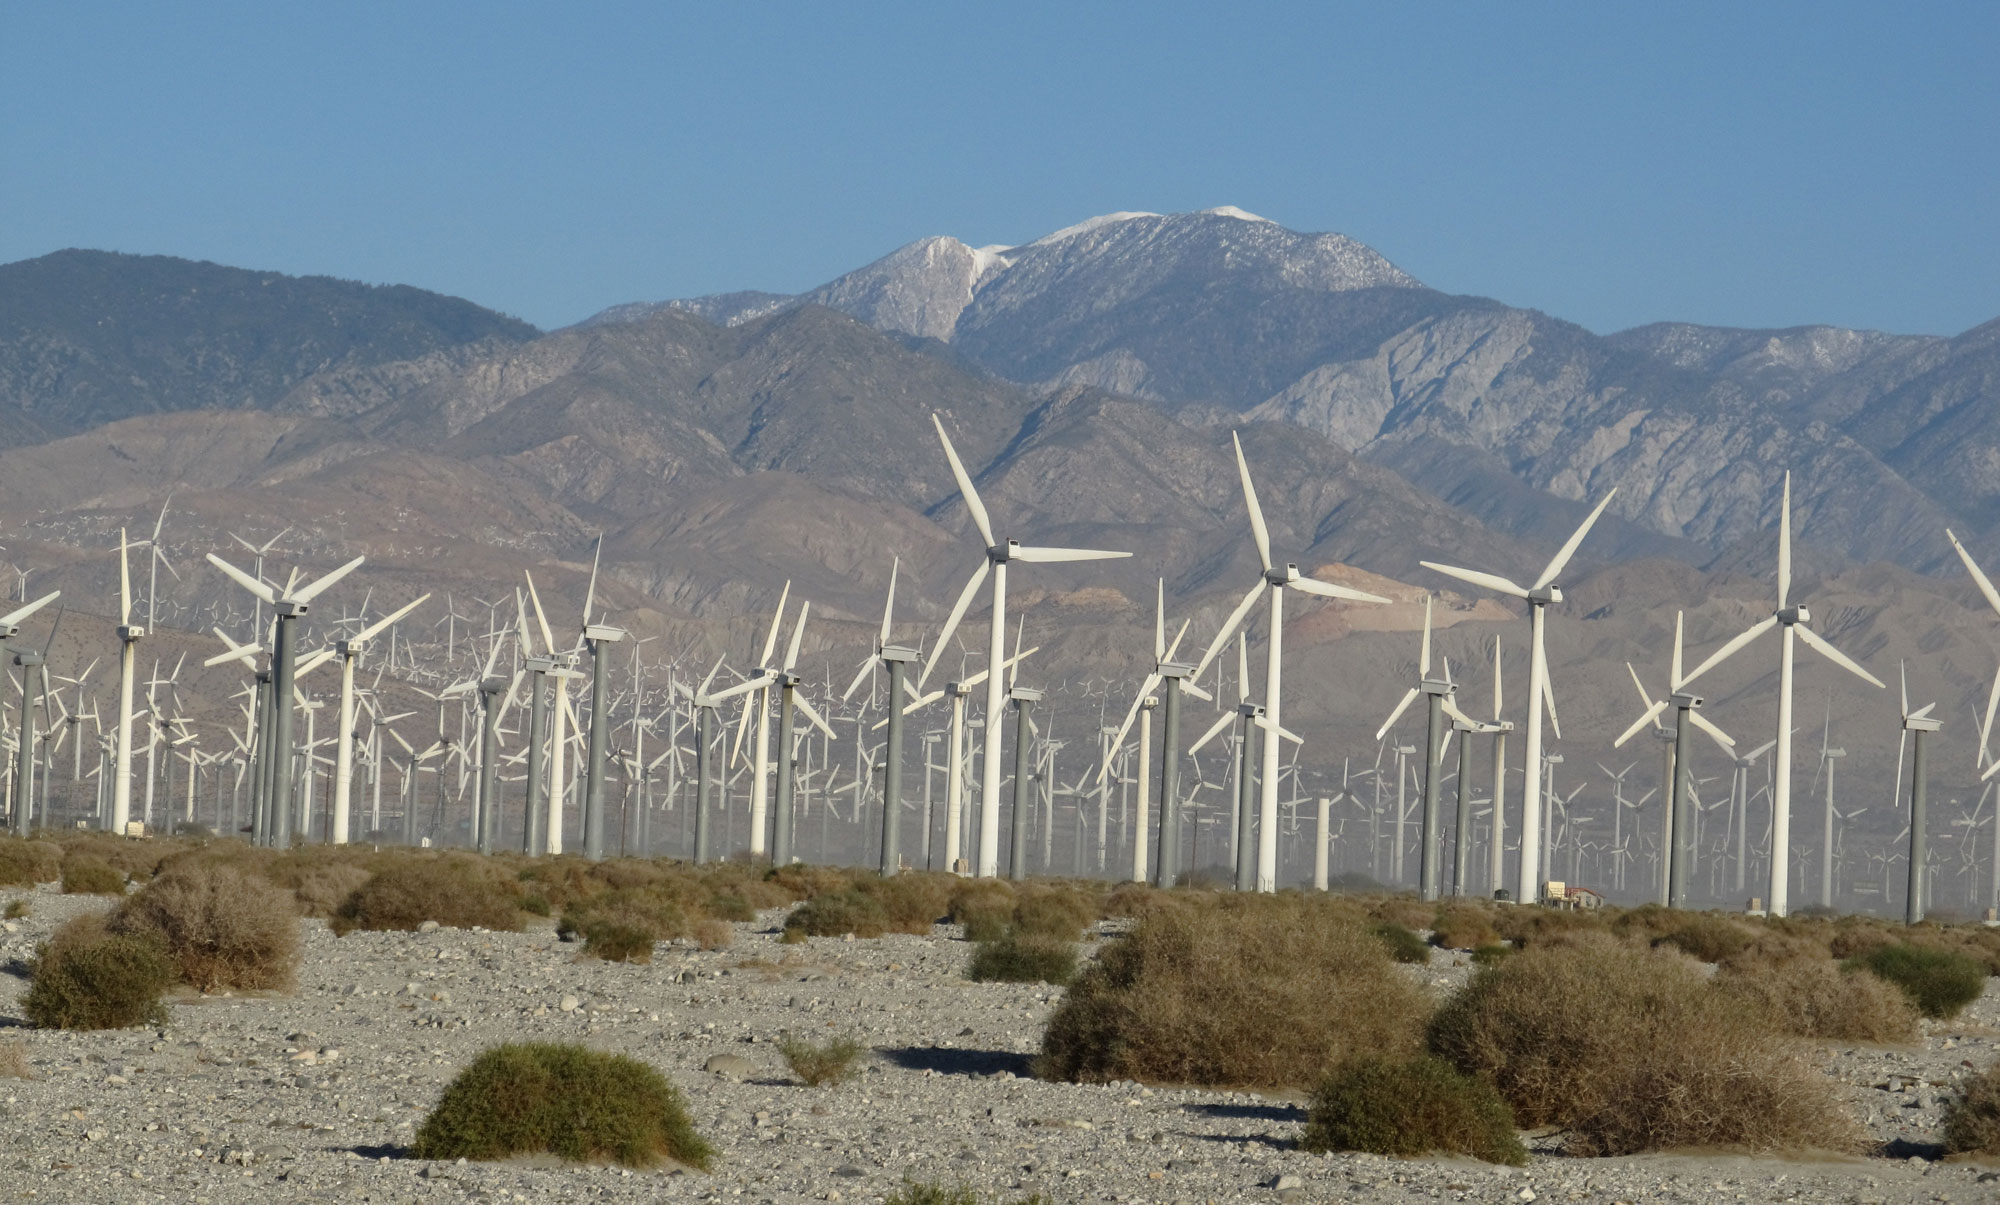
San Gorgonio Pass wind farm, southern California, near the border between the Pacific Border and Basin and Range regions. Photo by Ken Lund (flickr, Creative Commons Attribution-ShareAlike 2.0 Generic license, image cropped and resized).
Nuclear power
Nuclear power plays a part in the region’s energy production, although the proportion of energy provided by nuclear power is decreasing. The San Onofre Nuclear Power Plant in southern California was decommissioned in 2012, cutting the state’s nuclear energy production in half, from about 4000 MW to about 2000 MW. Because of the loss of this power source, California has had to rely more heavily on natural gas-fueled power plants. The California Air Resources Board estimates that through the loss of the “clean” nuclear energy and an increase in the use of natural gas, air pollution in the area has increased by about 25%.
The Diablo Canyon Power Plant near San Luis Obispo, California, and the Columbia Generating Station in Richland, Washington, are the only two operating nuclear energy plants on the West Coast. Diablo Canyon has a capacity of 2240 MW. While the plant was scheduled for closure in 2025, that plan is being reconsidered in light of the state's energy needs and clean (carbon-free) energy goals.
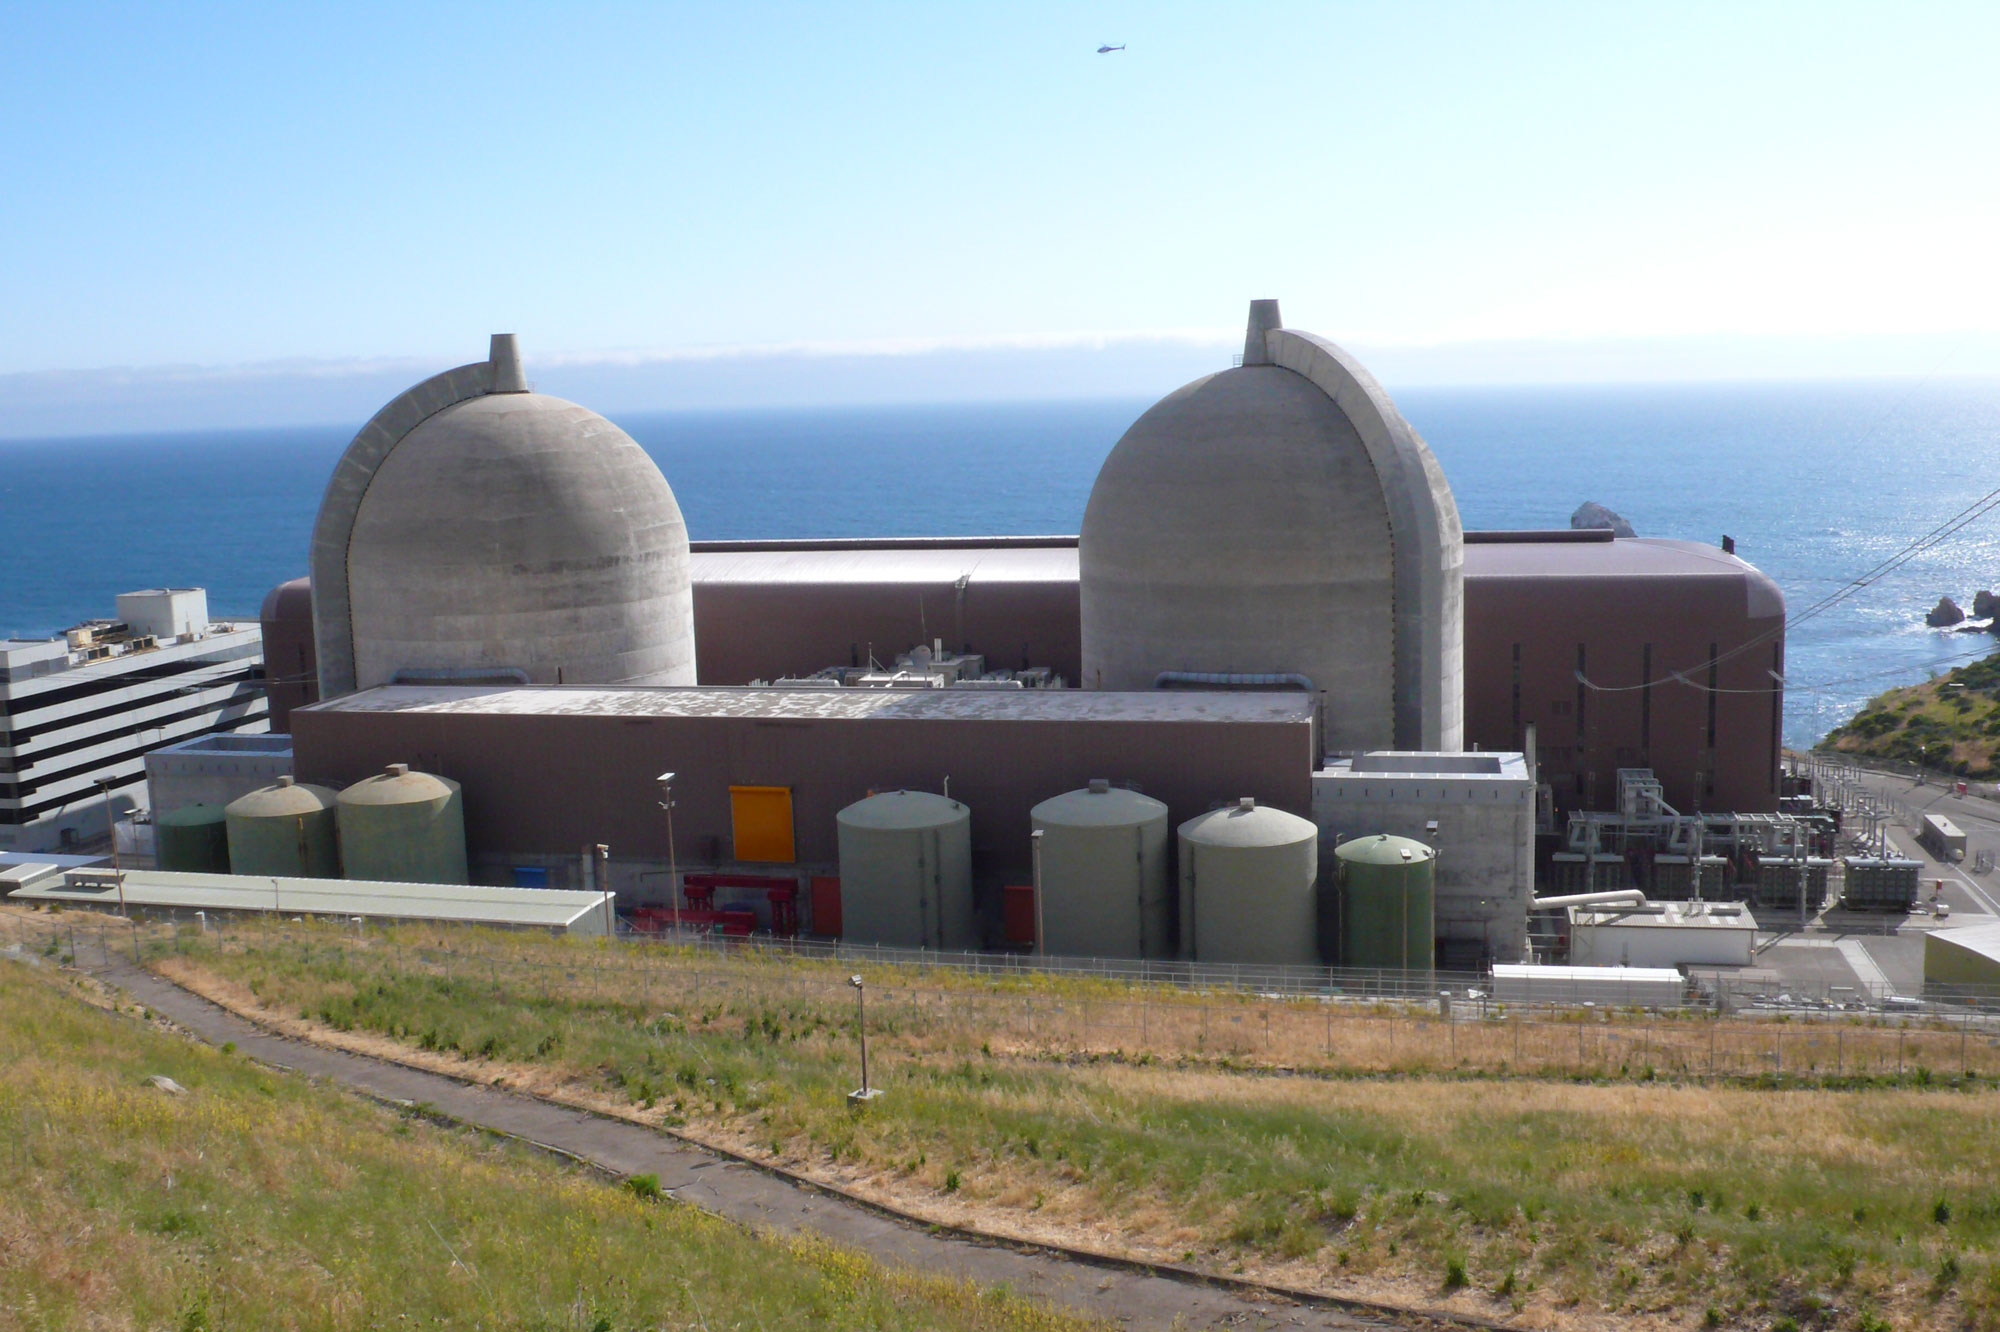
Diablo Canyon Power Plant, California, 2008. Photo by Tracey Adams (flickr, Creative Commons Attribution 2.0 Generic license, image resized).
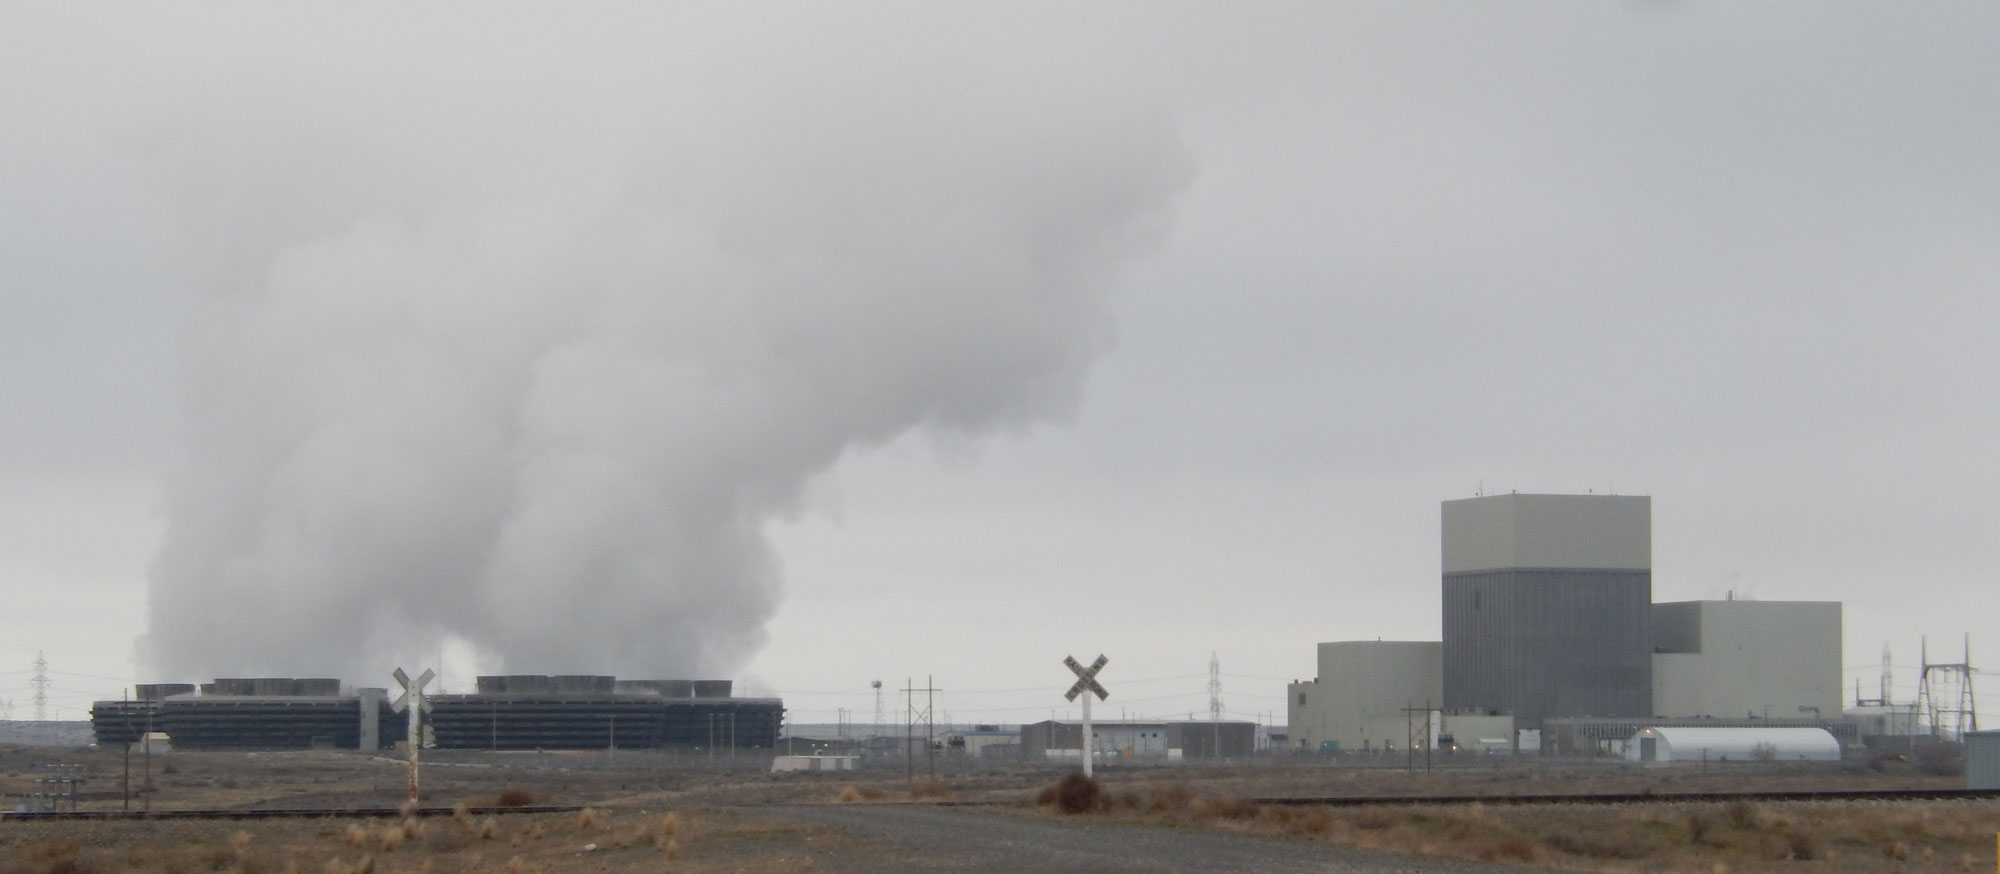
Columbia Generating Station, Washington, 2015. Photo by Chris Uhlik (Wikimedia Commons, Creative Commons Attribution-ShareAlike 4.0 International license, image cropped and resized).
Resources
Resources from the Paleontological Research Institution & partners
Earth@Home: Introduction to Energy: https://earthathome.org/hoe/energy
Earth@Home: Introduction to Plate Tectonics: https://earthathome.org/hoe/plate-tectonics