

Chapter Contents:
- Climate is a System
- Measuring Climate
- Greenhouse Gases and Global Temperature
- Natural Causes of Climate Change
- Summary and Additional Resources
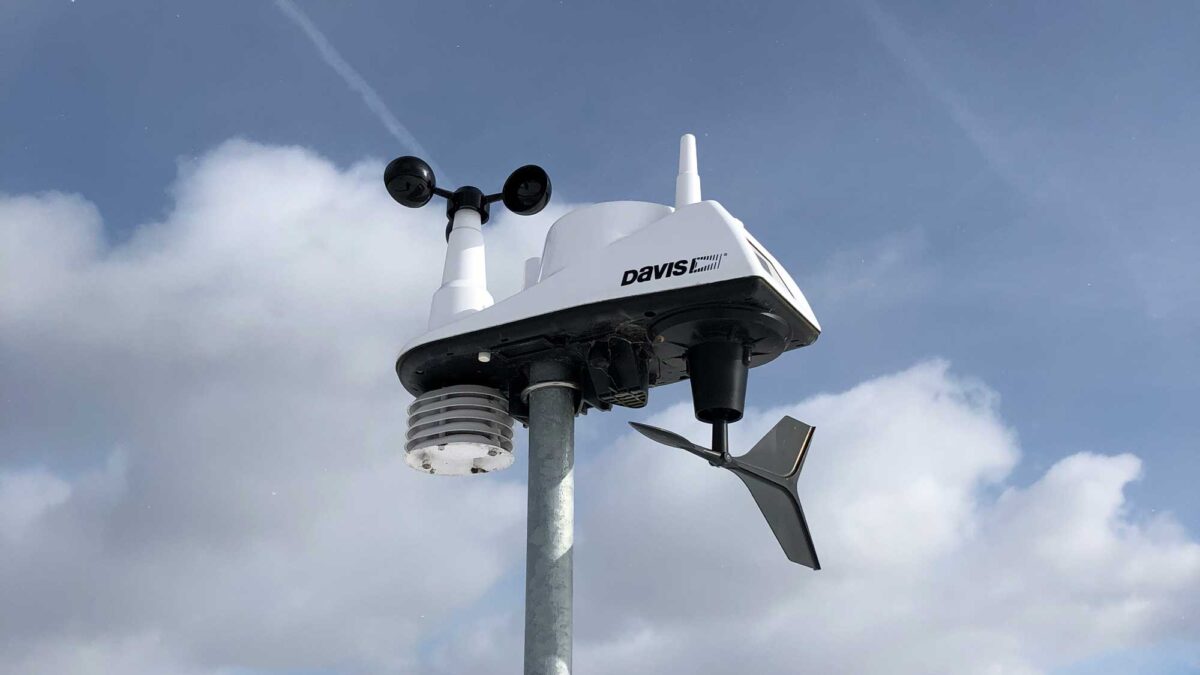
Image above: Photograph of a climate measuring device at the Museum of the Earth, Ithaca, New York. Photograph by Ingrid Zabel for PRI's Earth@Home project (CC BY-NC-SA 4.0 license).
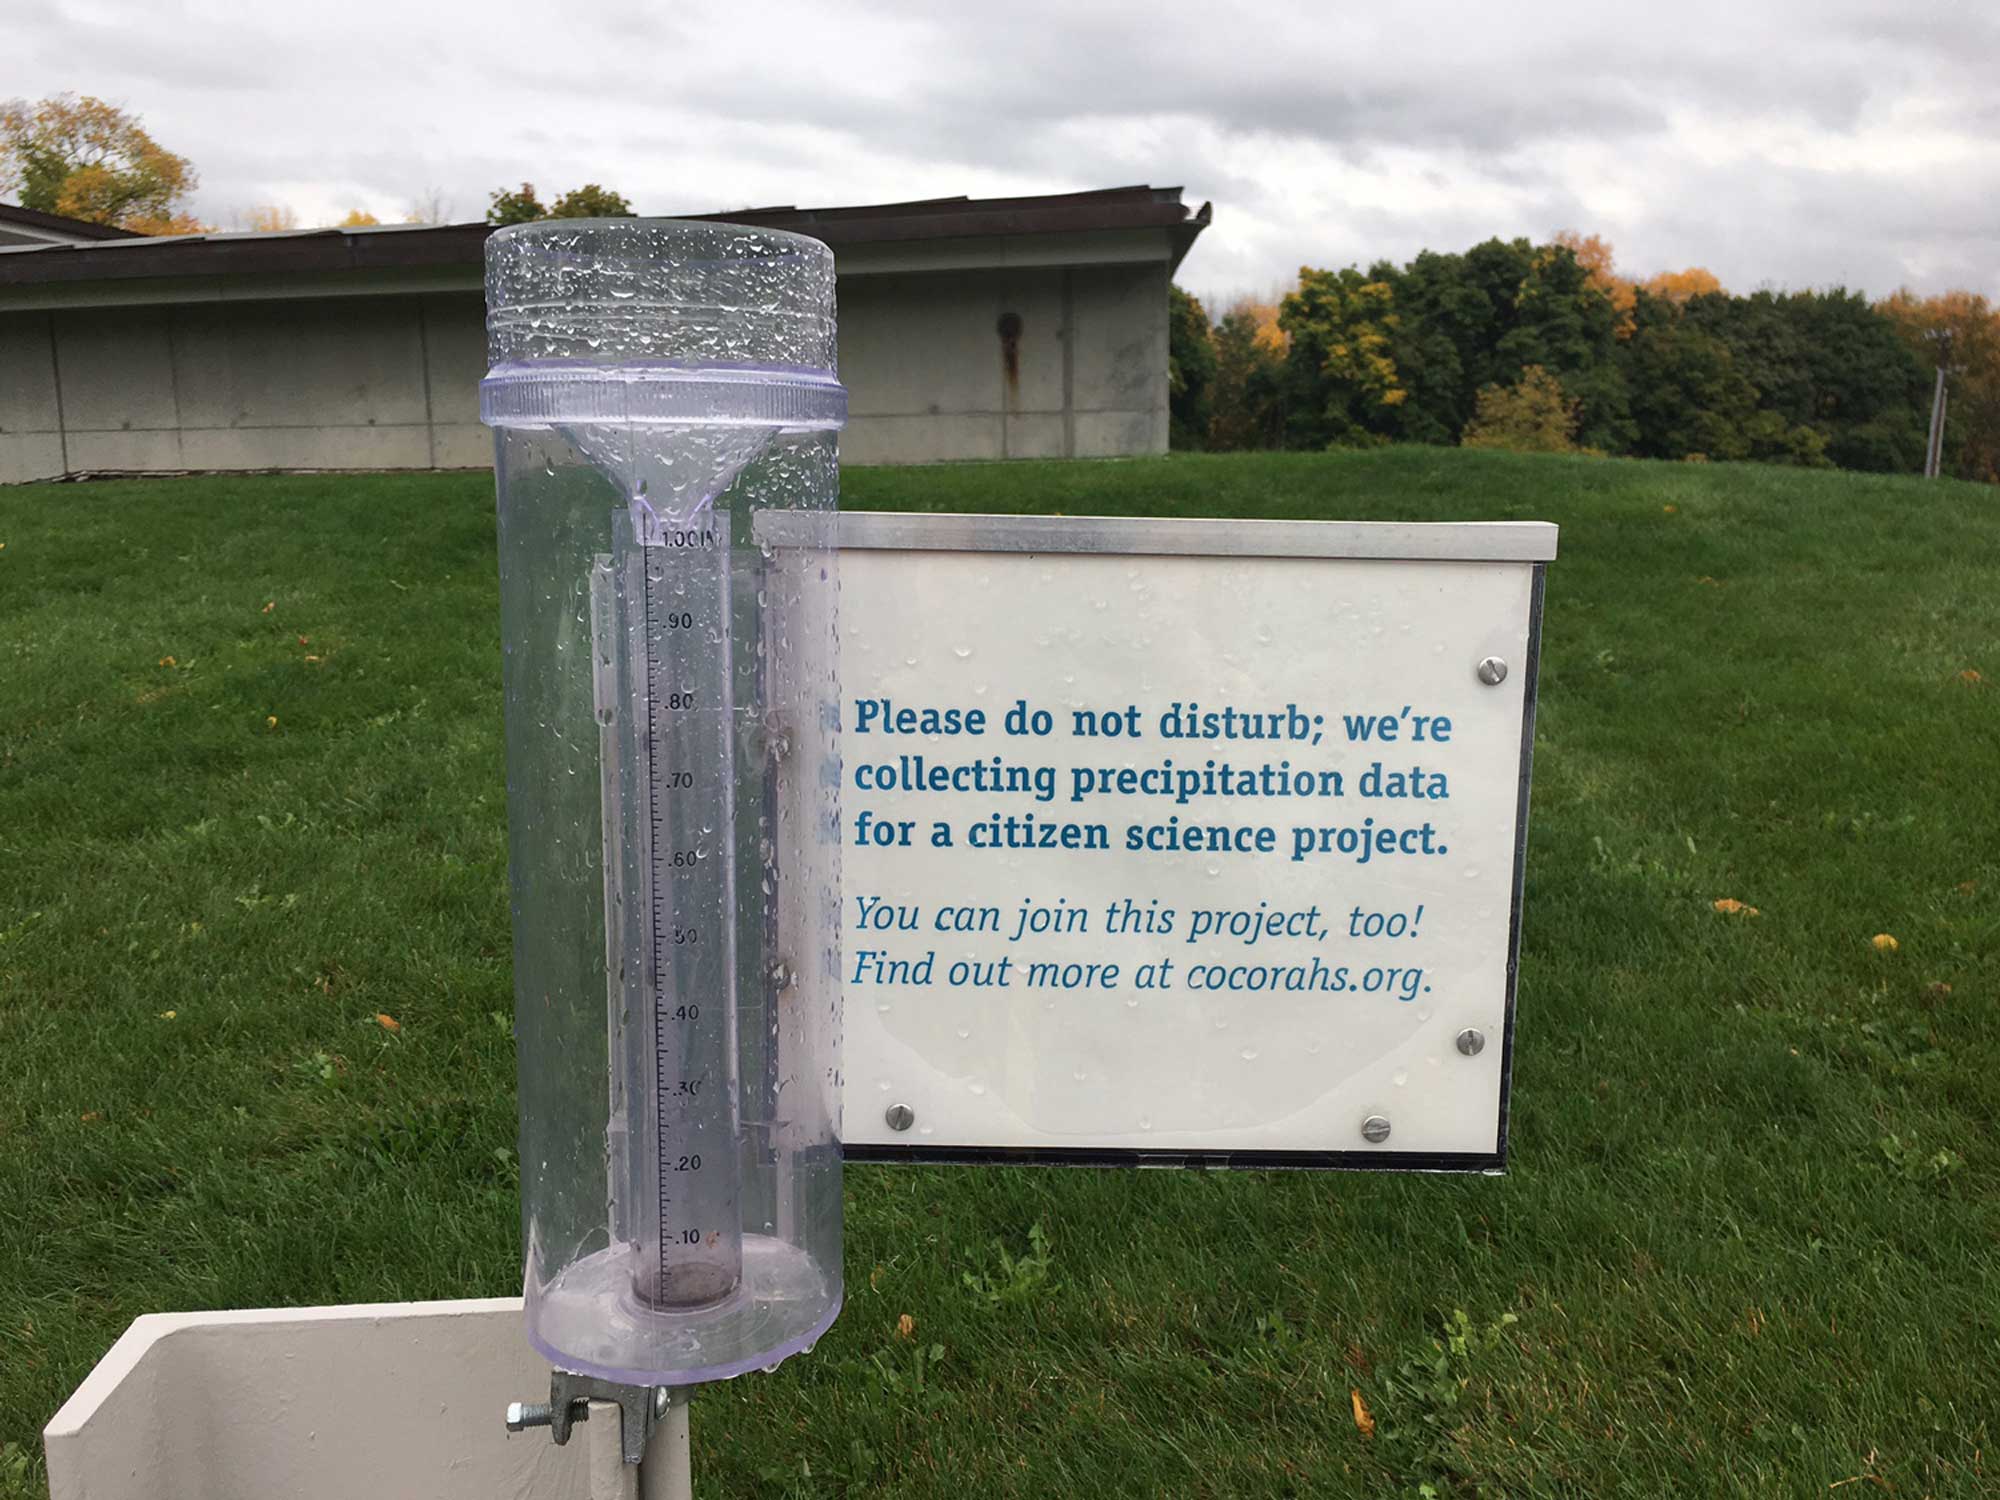
Standard rain gauge. Measurements of rainfall from this gauge are sent to the Community Collaborative Rain, Hail, and Snow Network's database. Photograph by Ingrid Zabel for PRI's Earth@Home project (CC BY-NC-SA 4.0 license).
The amount of rain that falls in a certain time period, typically 24 hours, is measured in inches or centimeters of water height captured by the gauge. If the precipitation fell as snow then the standard measurement is the liquid water equivalent of ice, measured by melting the snow captured by the gauge and then reading the height of the melted liquid in the gauge.
Rain gauge measurements have their limits. For example, they may not capture accurate measurements of rainfall during storms with high winds because winds may direct the rain horizontally and out of reach of the gauge. They also only give point measurements at the location of the gauge. The National Weather Service’s rain gauges are spaced about 20 miles apart on average. The gaps in this network of measurements may be filled in by citizen scientists, particularly by members of the Community Collaborative Rain, Hail, and Snow Network (cocorahs.org).
For broader coverage of precipitation measurements we now can rely on satellite data. Early satellite instruments could only measure precipitation in the tropics and could not detect light rain or snow. In February 2014, NASA and JAXA, Japan’s space agency, launched the Global Precipitation Measurement (GPM) Core Observatory, with sensors that can detect a range of precipitation from light rain to heavy snow, and that provide data from the tropics to near the poles.
The temperatures that we hear or read about in the local daily weather report are almost always measurements of air temperature obtained by thermometers in particular locations close to the ground (referred to as near-surface) at particular moments (e.g., taken at a nearby airport at 8:00 a.m., or taken at a station on the roof of a local school). These individual measurements are likely to be similar to one another, but rarely are they identical, and they can be averaged to produce assessments of temperatures over some geographic area or a length of time (e.g., this morning’s mean temperature for the Northeastern US, or Florida’s daily high from yesterday). Extreme values are smoothed away if the data are averaged over large areas over long periods of time, and the site-to-site and day-to-day variability converges to an area or time average.
There are also differences from year to year. We all know that July is going to be hotter than January, but the high temperature on July 15th of this year is going to be different than the high temperature of last July 15th, or the July 15th from ten years ago. These differences are caused by natural cycles in our Earth climate system. El Niño, for example, is a well-known example of an interannual cycle, in which the temperature or rainfall of a region can be higher or lower than average depending on the strength of El Niño that year. There are also differences on decadal time scales. For example, in the 1930s a severe drought together with land use changes (millions of acres plowed for farming) caused the famous “Dustbowl” conditions in the American West and Midwest. More recently, California experienced a prolonged and exceptionally severe drought from 2012 to 2016.
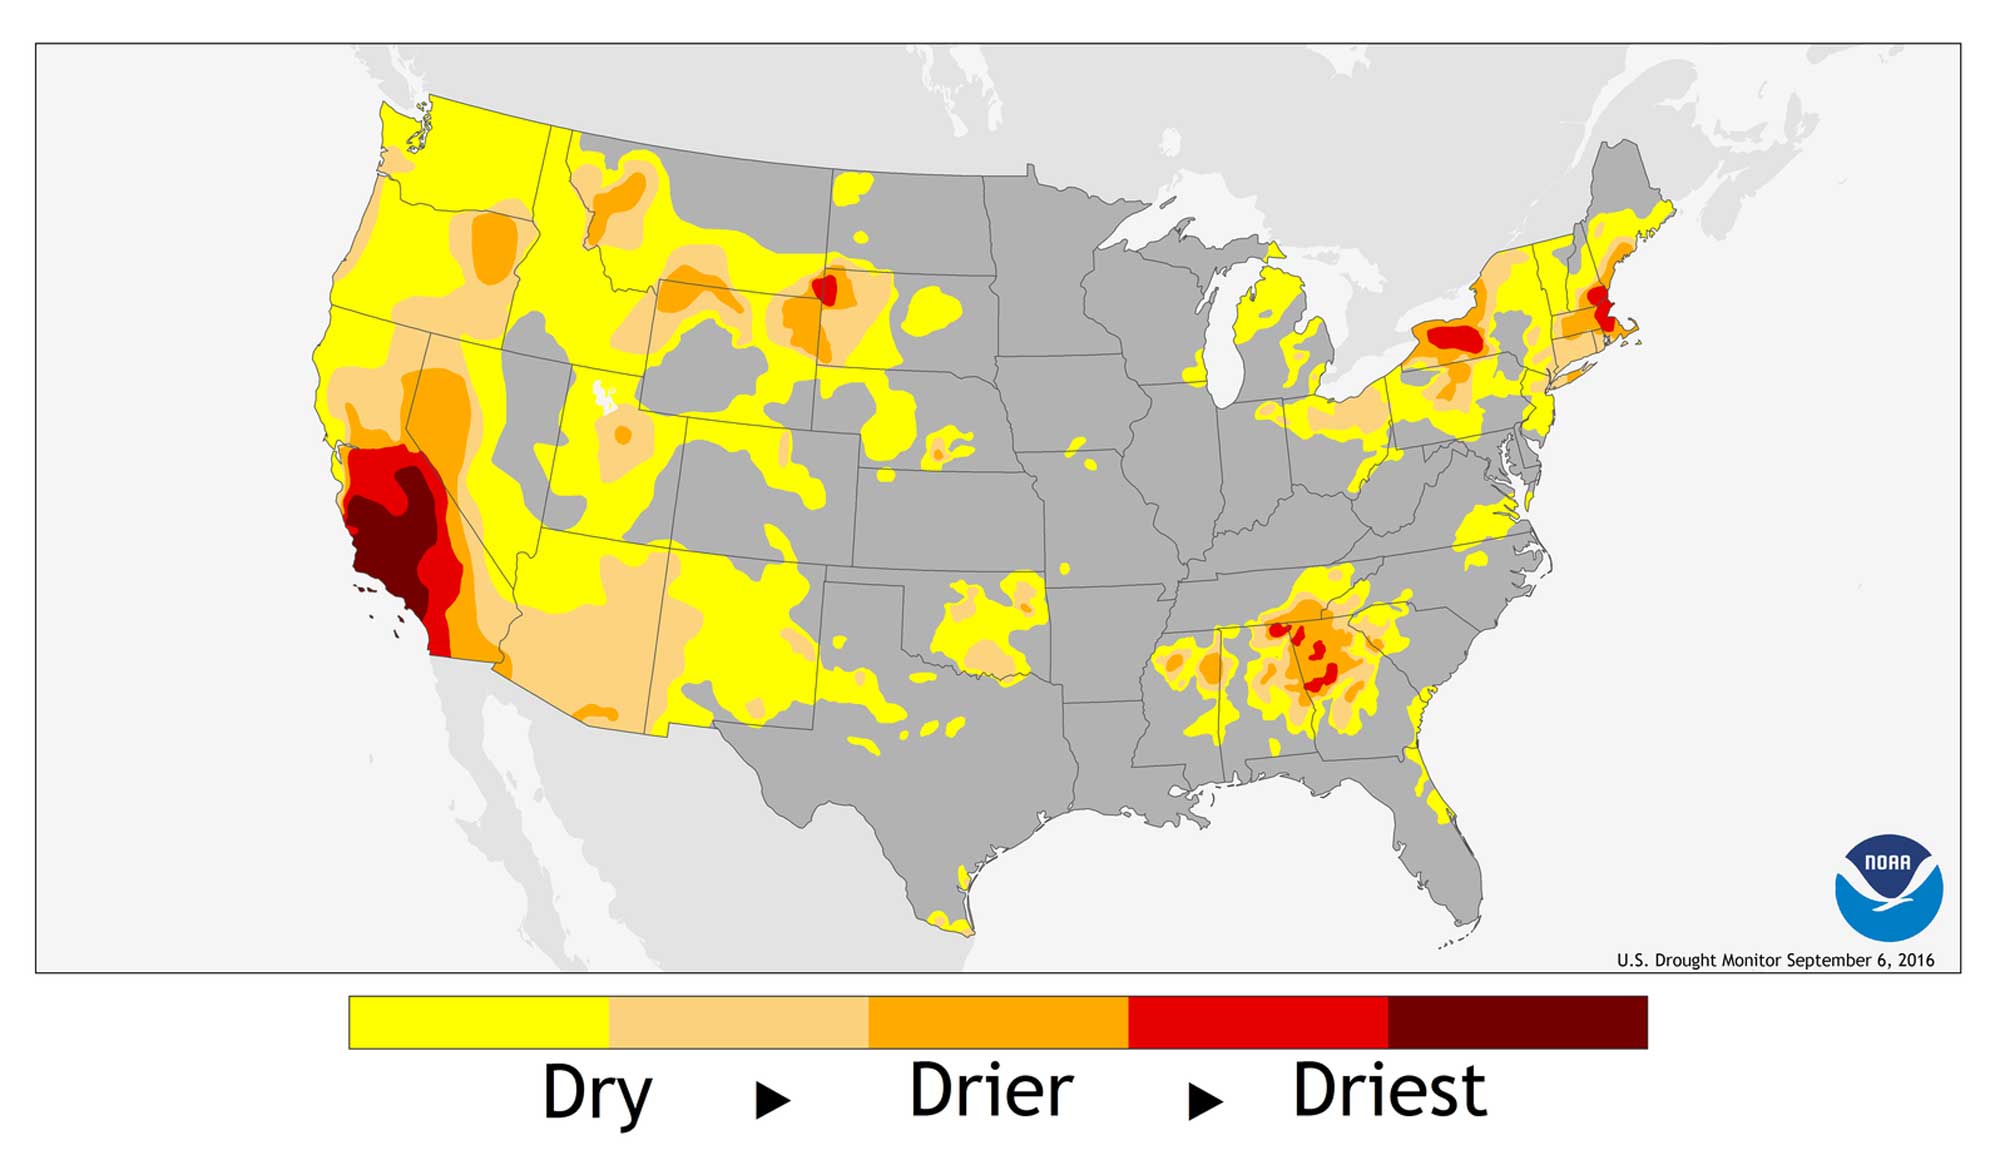
Drought conditions across the continental US as of September 6, 2016. A large part of southern California was experiencing Exceptional Drought, the most severe category. Image from NOAA (public domain).
Satellite-based sensors also provide surface temperature measurements, and climate scientists have developed sophisticated models to provide temperature and precipitation data over geographic grids and to obtain coverage between point weather stations. These models, such as the Parameter-elevation Regressions on Independent Slopes Model (PRISM; this model was developed by the PRISM Climate Group at Oregon State University), have been shown to be very accurate and are widely accepted by the scientific community, government agencies, and businesses that need these data.
The average global surface temperature (the average of near-surface air temperature over land and sea surface temperature) on Earth during the 20th century was approximately 14.8°C (58.6°F). (This measurement and many climate datasets are available from the NOAA National Centers for Environmental Information.) It is important to note that there were very few moments when the actual temperature in any given location was exactly that temperature. This value is a long-term global average. As of 2016, the average global surface temperature has increased since 1880 by about 0.8°C (1.4°F). The temperature that you feel when you step outside today will be different from this average value due to many factors such as land use, elevation, topography, and proximity to bodies of water.