


Summary
Climate is a system, driven by solar radiation and interactions of the atmosphere, hydrosphere, geosphere, and biosphere. A number of natural phenomena contribute to Earth’s climate. These phenomena—plate tectonics and weathering, evolution of new life, and others—have interacted via the carbon cycle to change the amount of CO2 in the atmosphere and cause temperatures to change throughout geologic time.
Online Resources
Teaching Resources
The Paleontological Research Institution's Teach Climate Change page on the Climate section of Earth@Home has activities on climate science as well as on solutions.
Climate Literacy and Energy Awareness Network (CLEAN): A reviewed collection of teaching resources.
The Greenhouse Effect
Greenhouse Gas Simulation: An interactive simulation from the University of Colorado Boulder in which one can vary the concentration of greenhouse gases in the atmosphere and see the changes in infrared radiation in the atmosphere and the effect on Earth’s temperature.
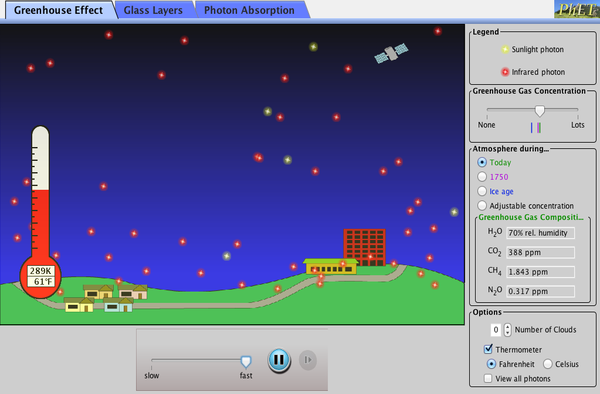
| Click to Run |
Climate Measurements
1) Global Precipitation Measurement Core Observatory: An article and video about satellite measurements of precipitation.
2) CoCoRaHS Network: A website with information about the Community Collaborative Rain, Hail, and Snow Network, a citizen scientist project that generates measurements of precipitation all over the US. The site contains maps, data, and information about how to join the project and make measurements.
Climate Change Over Geologic Time
Paleomap Project: a set of detailed maps of the world showing the past positions of the continents and describing Earth’s past climates, going back to the Cambrian period.
Recent Climate Change: Data and Visualizations
1) NASA Vital Signs of the Planet website: An excellent overview of key climate change data. This site also contains many links to articles, information about solutions, images, videos, interactives, education resources, and information about NASA missions.
2) NASA Climate Time Machine: Animation of global temperature change from 1884 to 2014.
3) NOAA Climate Data Snapshots: maps of monthly US climate data including temperature, precipitation, drought, and severe weather. The time records of the datasets vary, but the earliest go back to 2000.
4) NOAA Global Climate Dashboard: A source of time-series graphs of global climate indicators such as temperature, CO2, sea ice, sea level, and more.
5) EPA Climate Change Indicators in the United States: a website with access to maps and graphs of many different climate change indicators as well as a summary report.
6) The Fourth National Climate Assessment: Impacts, Risks, and Adaptation in the United States: A comprehensive overview of climate change impacts in the U.S. An assessment of the science behind this report is available here.
Carbon Cycle
1) Carbon Budget Tool: An interactive carbon budget tool which allows users to explore altering sources and sinks and see the effects on atmospheric CO2.
2) NASA Carbon Cycle Overviews: A set of clearly written and illustrated articles on the carbon cycle.
Contributions (Natural and Anthropogenic) to Climate Change
1) Bloomberg Businessweek: What's Really Warming the World?: An infographic on potential causes of climate change from 1880-2005 and their effects, based on datasets from NASA.
2) U.S. Energy Information Administration Charts: U.S. greenhouse gas emissions by type of gas, fuel source, and sector.
Weather Simulation
MIT Weather in a Tank: Information about a system for running rotating fluid laboratory experiments, allowing one to simulate dynamics of the atmosphere and ocean.
"Weather in a tank" by Massachusetts Institute of Technology (MIT) (YouTube).