

Page snapshot: Introduction to the climate of Hawai'i, including past, present, and future climate.
Topics covered on this page: The big picture; Present climate of Hawai'i; Effect of the ocean; Effect of latitude; Effect of topography; Past climate of Hawai'i; Future climate of Hawai'i; Resources.
Credits: Most of the text of this page is derived from "Climate of the Western US" by Ingrid H. H. Zabel, Judith T. Parrish, Alexandra Moore, and Gary Lewis, chapter 9 in The Teacher-Friendly Guide to the Geology of the Western US, edited by Mark D. Lucas, Robert M. Ross, and Andrielle N. Swaby (published in 2014 by the Paleontological Research Institution; currently out of print). The book was adapted for the web by Elizabeth J. Hermsen and Jonathan R. Hendricks in 2022. Changes include formatting and revisions to the text and images. Credits for individual images are given in figure captions.
Updates: Page last updated June 22, 2022.
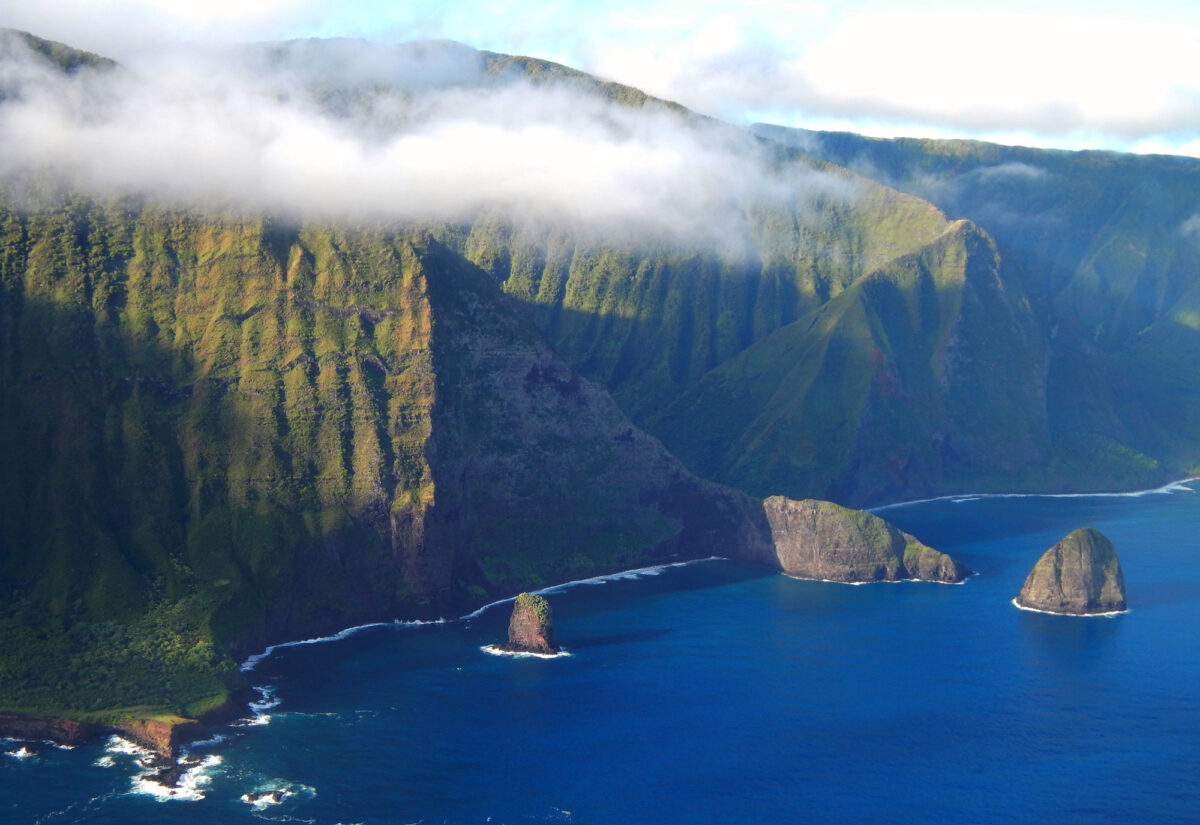
Image above: The shore of Moloka'i. Photo by Forest Starr and Kim Starr (flickr, Creative Commons Attribution 2.0 Generic license, image cropped and resized).
The big picture
The eight main Hawaiian Islands stretch between 19° and 22° north latitude. This places them within the tropics, and also within the belt of persistent northeast trade winds. This geography, combined with the high topography of many Hawaiian peaks, gives rise to large variations in climate across the islands. Hawai'i Island alone has some of the most extreme climate gradients of any place on earth. Because half of the land area of Hawai'i lies within eight kilometers (five miles) of the ocean, the ocean is an important control on climate.
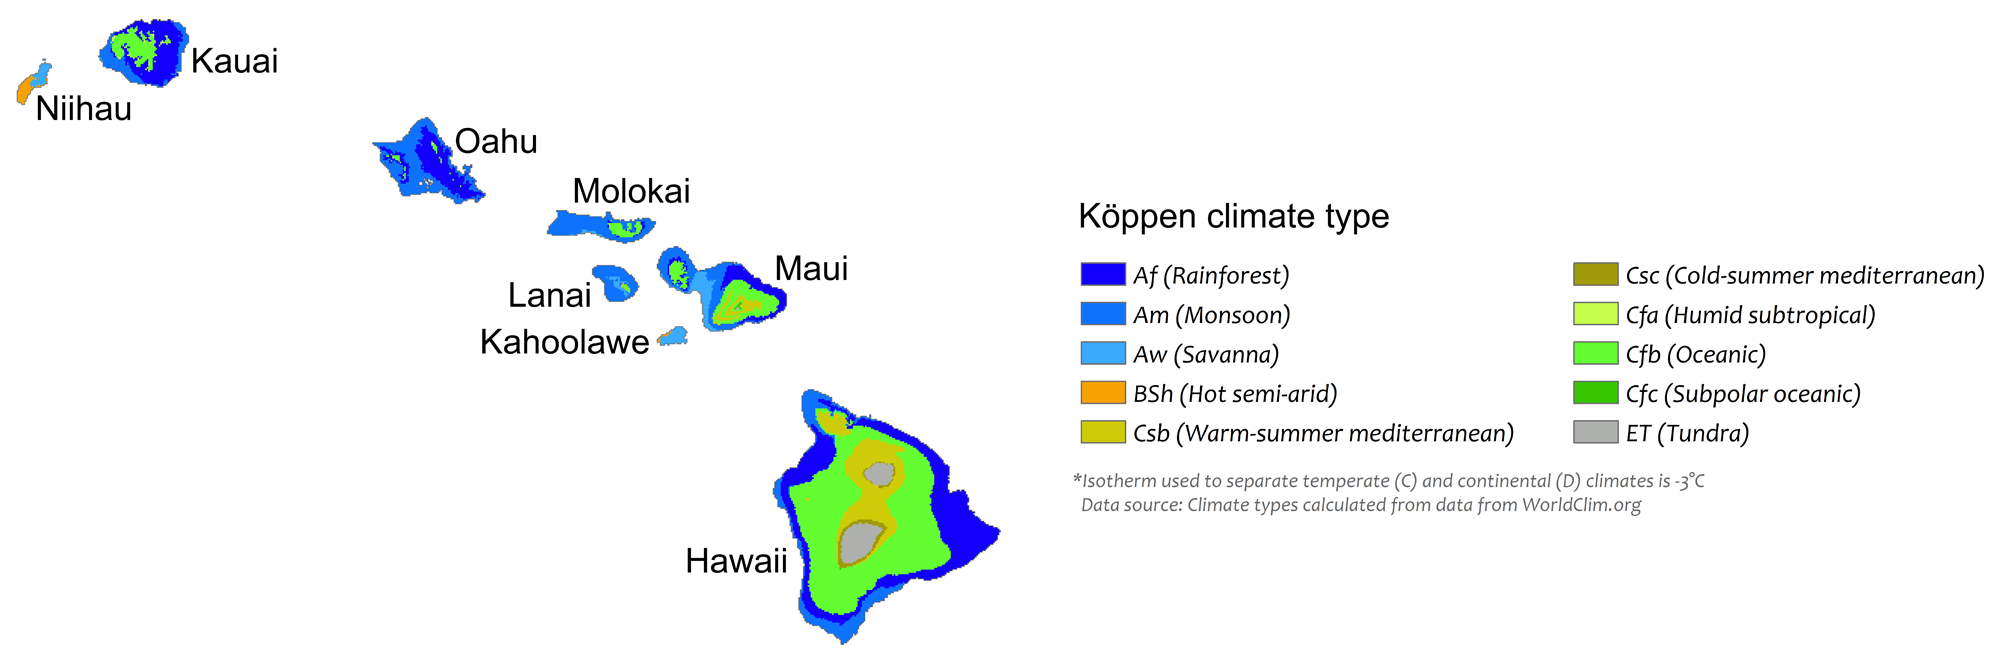
Köppen map of the Hawai'i. The first letter of each zone in the key indicates its major classifcation. A = Tropical (equatorial), B = Arid, C = Temperate (warm temperate), E = polar. Modified from a map by Adam Peterson (Wikimedia Commons, Creative Commons Attribution-ShareAlike 4.0 International license).
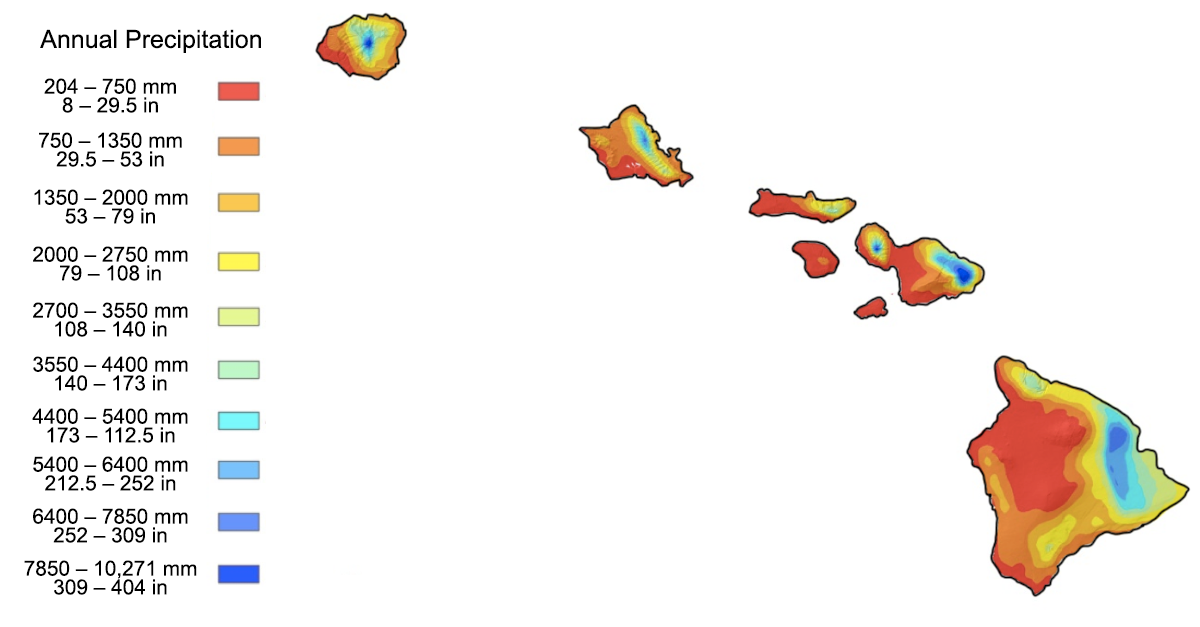
Ocean, atmosphere, and topography interact in Hawai'i to make the islands a land of diverse climate with extreme climate gradients. Large changes over short distances characterize the Hawaiian Islands and drive natural processes as well as human activity. The maps of rainfall and temperature distribution in Hawai'i show the range and proximity of these variations. On Maui, the distance is only 32 kilometers (20 miles) from Big Bog (the wettest location, with 1029 centimeters or 405 inches per year) to Kihei (the driest, at 28 centimeters or 11 inches per year). On Kaua'i the distance from the wettest spot, Wai'ale'ale (1143 centimeters or 450 inches per year) to the driest spot, Polihale Beach (46 centimeters or 18 inches per year), is only 26 kilometers (16 miles). This gives Kaua'i a rainfall gradient of 38 centimeters per year per kilometer (24 inches per year per mile).
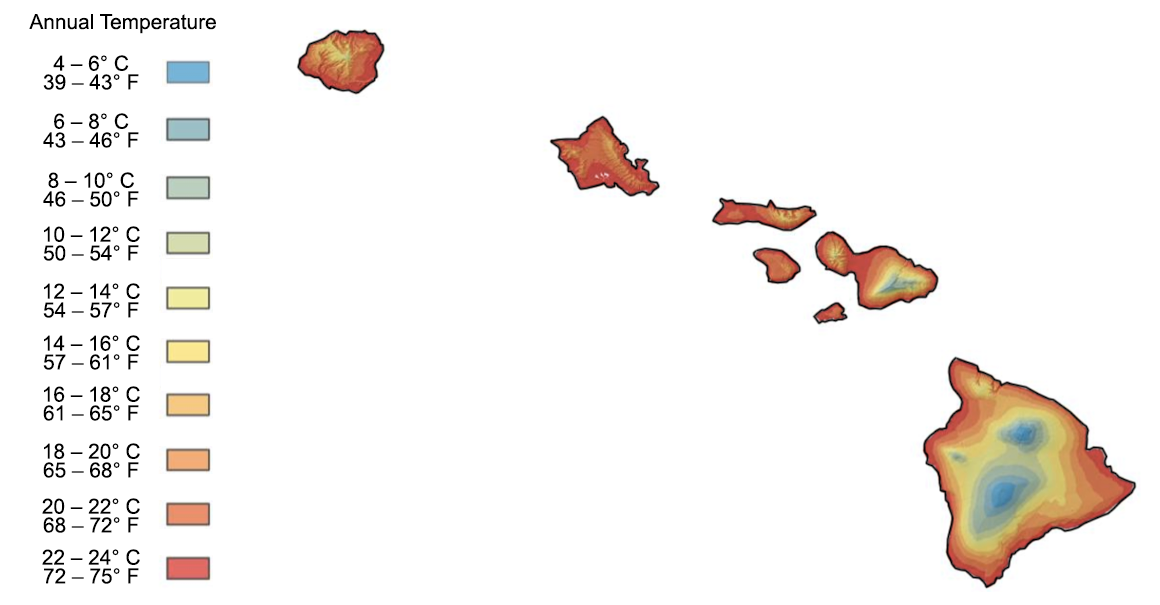
Mean annual temperature for Hawai'i. Image adapted from an image by Scenarios for Climate Assessment and Adaptation, first published in The Teacher-Friendly Guide to the Earth Science of the Western US.
Rates of weathering and erosion are much higher in areas of high rainfall. Therefore, the islands' windward slopes are more deeply incised by stream erosion. In dry areas erosion rates are typically lower; however, episodic winter storms can wash large amounts of sediment from arid areas that have little vegetation into the ocean. These sedimentation events have a negative impact on coral reefs, as corals require clear, sediment-free water for optimal growth. Rates of soil formation are also dependent on climate. Sufficient weathering is required to break down parent material, yet too much weathering will remove nutrients, ultimately rendering soils infertile.
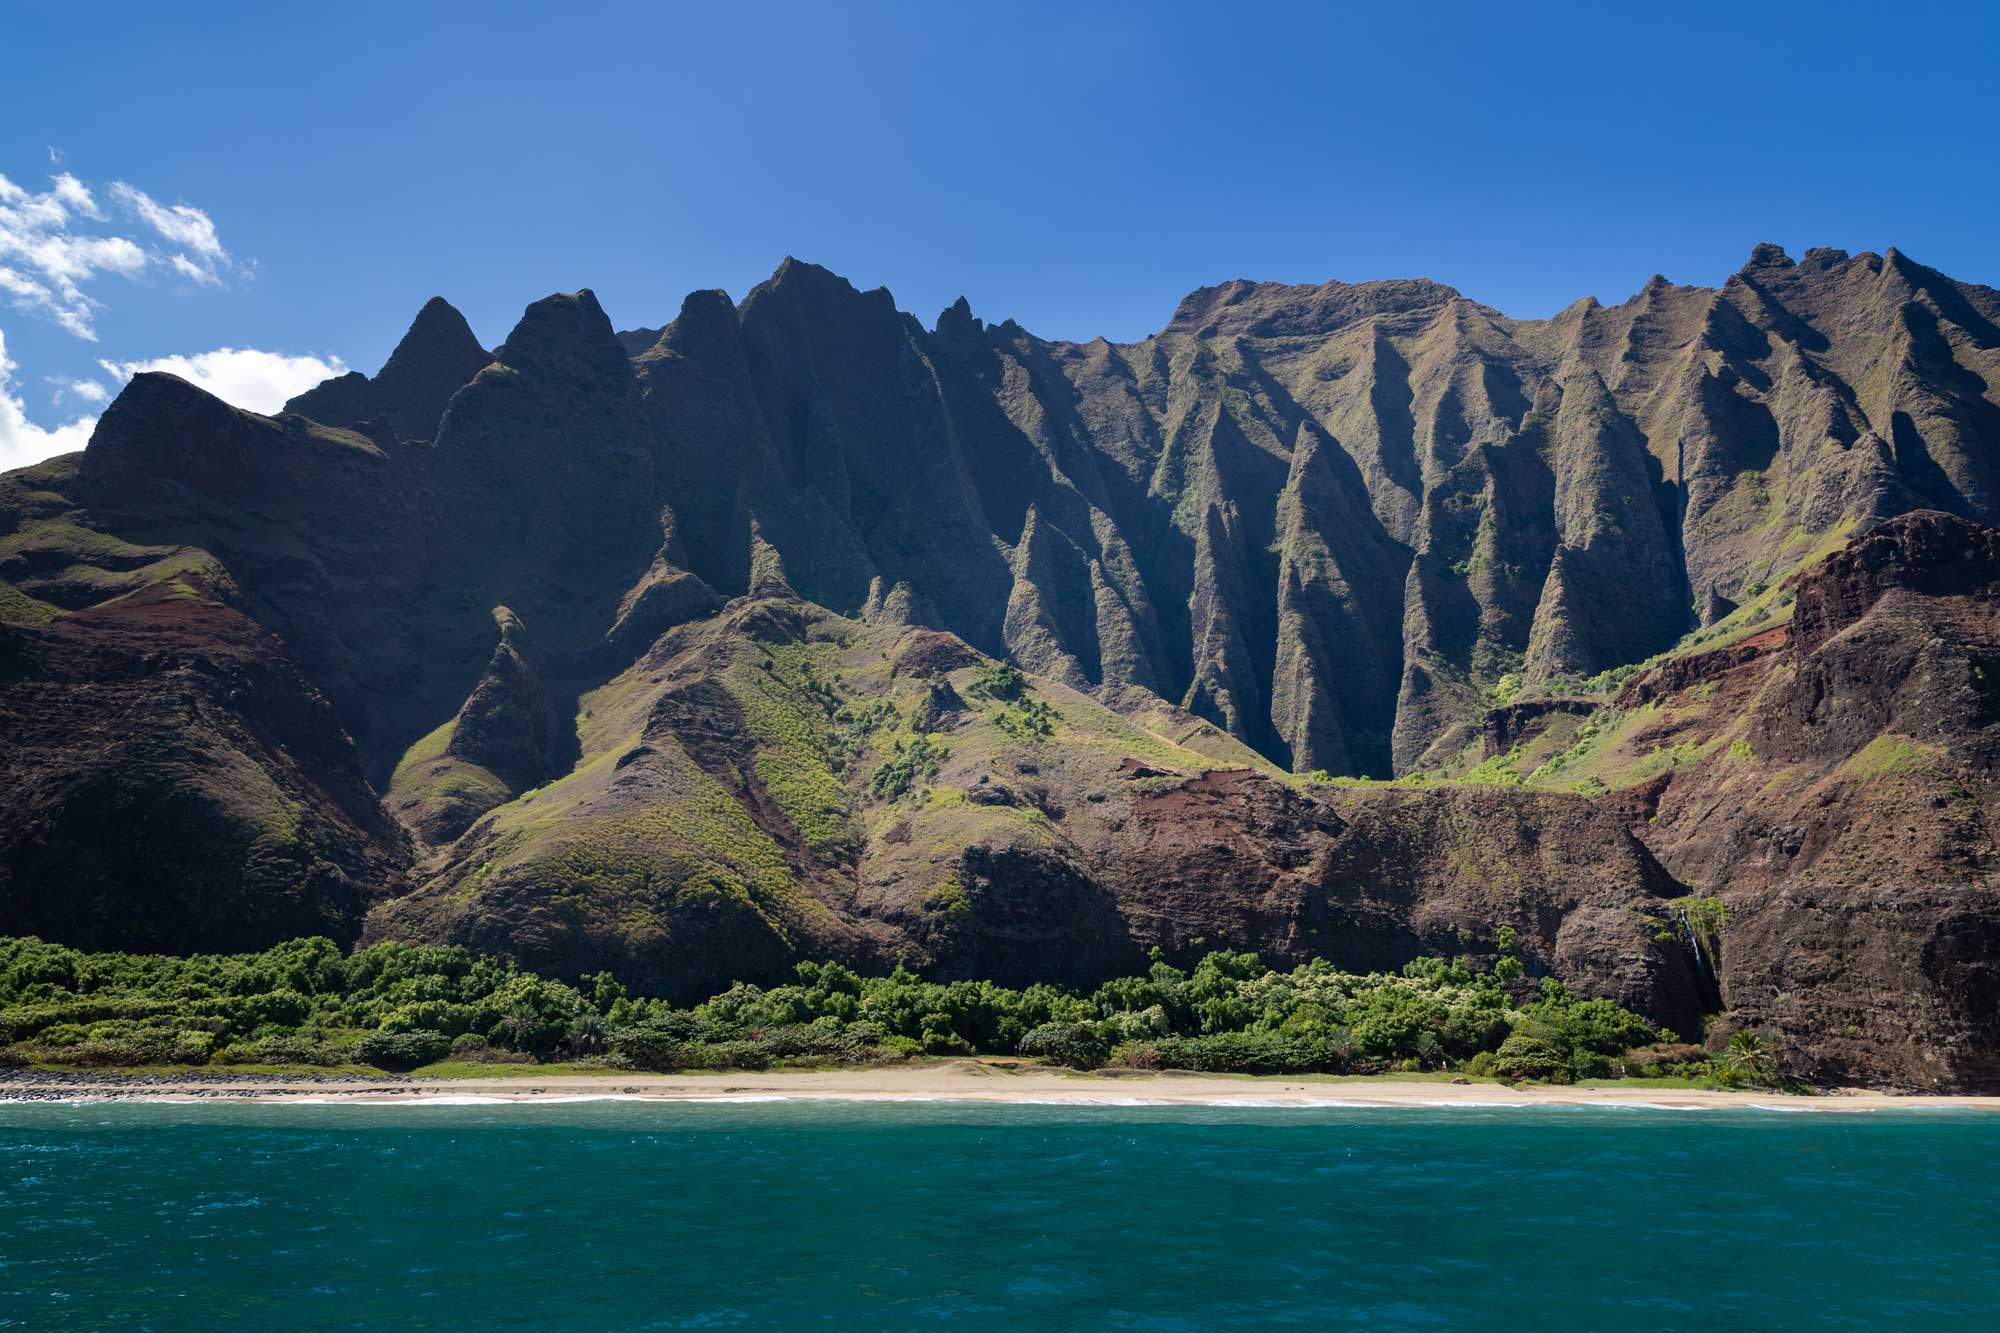
Weathered slopes, Na Pali Coast, Kaua'i. Photo by dronepicr (flickr, Creative Commons Attribution 2.0 Generic license, image resized).
Present climate of Hawai'i
Effect of the ocean
Hawai‘i is a small archipelago in the center of the Pacific Ocean, which is the world’s largest ocean. Water has a very high heat capacity (in other words, it takes a lot of energy to raise the temperature of water). This means that the annual temperature variation of the ocean is small. The ocean surface temperature around the Hawaiian Islands ranges between 24°C (75°F) in winter and 27°C (81°F) in summer. The seasonal variation in land surface temperature for coastal Hawai‘i is similar, about 5°C (9°F) from winter to summer. By comparison, the seasonal land temperature variation in a continental setting would be much larger; for example, in Chicago the seasonal variation is 25°C (45°F). Thus, the ocean dominates climate in Hawai‘i’s coastal areas.
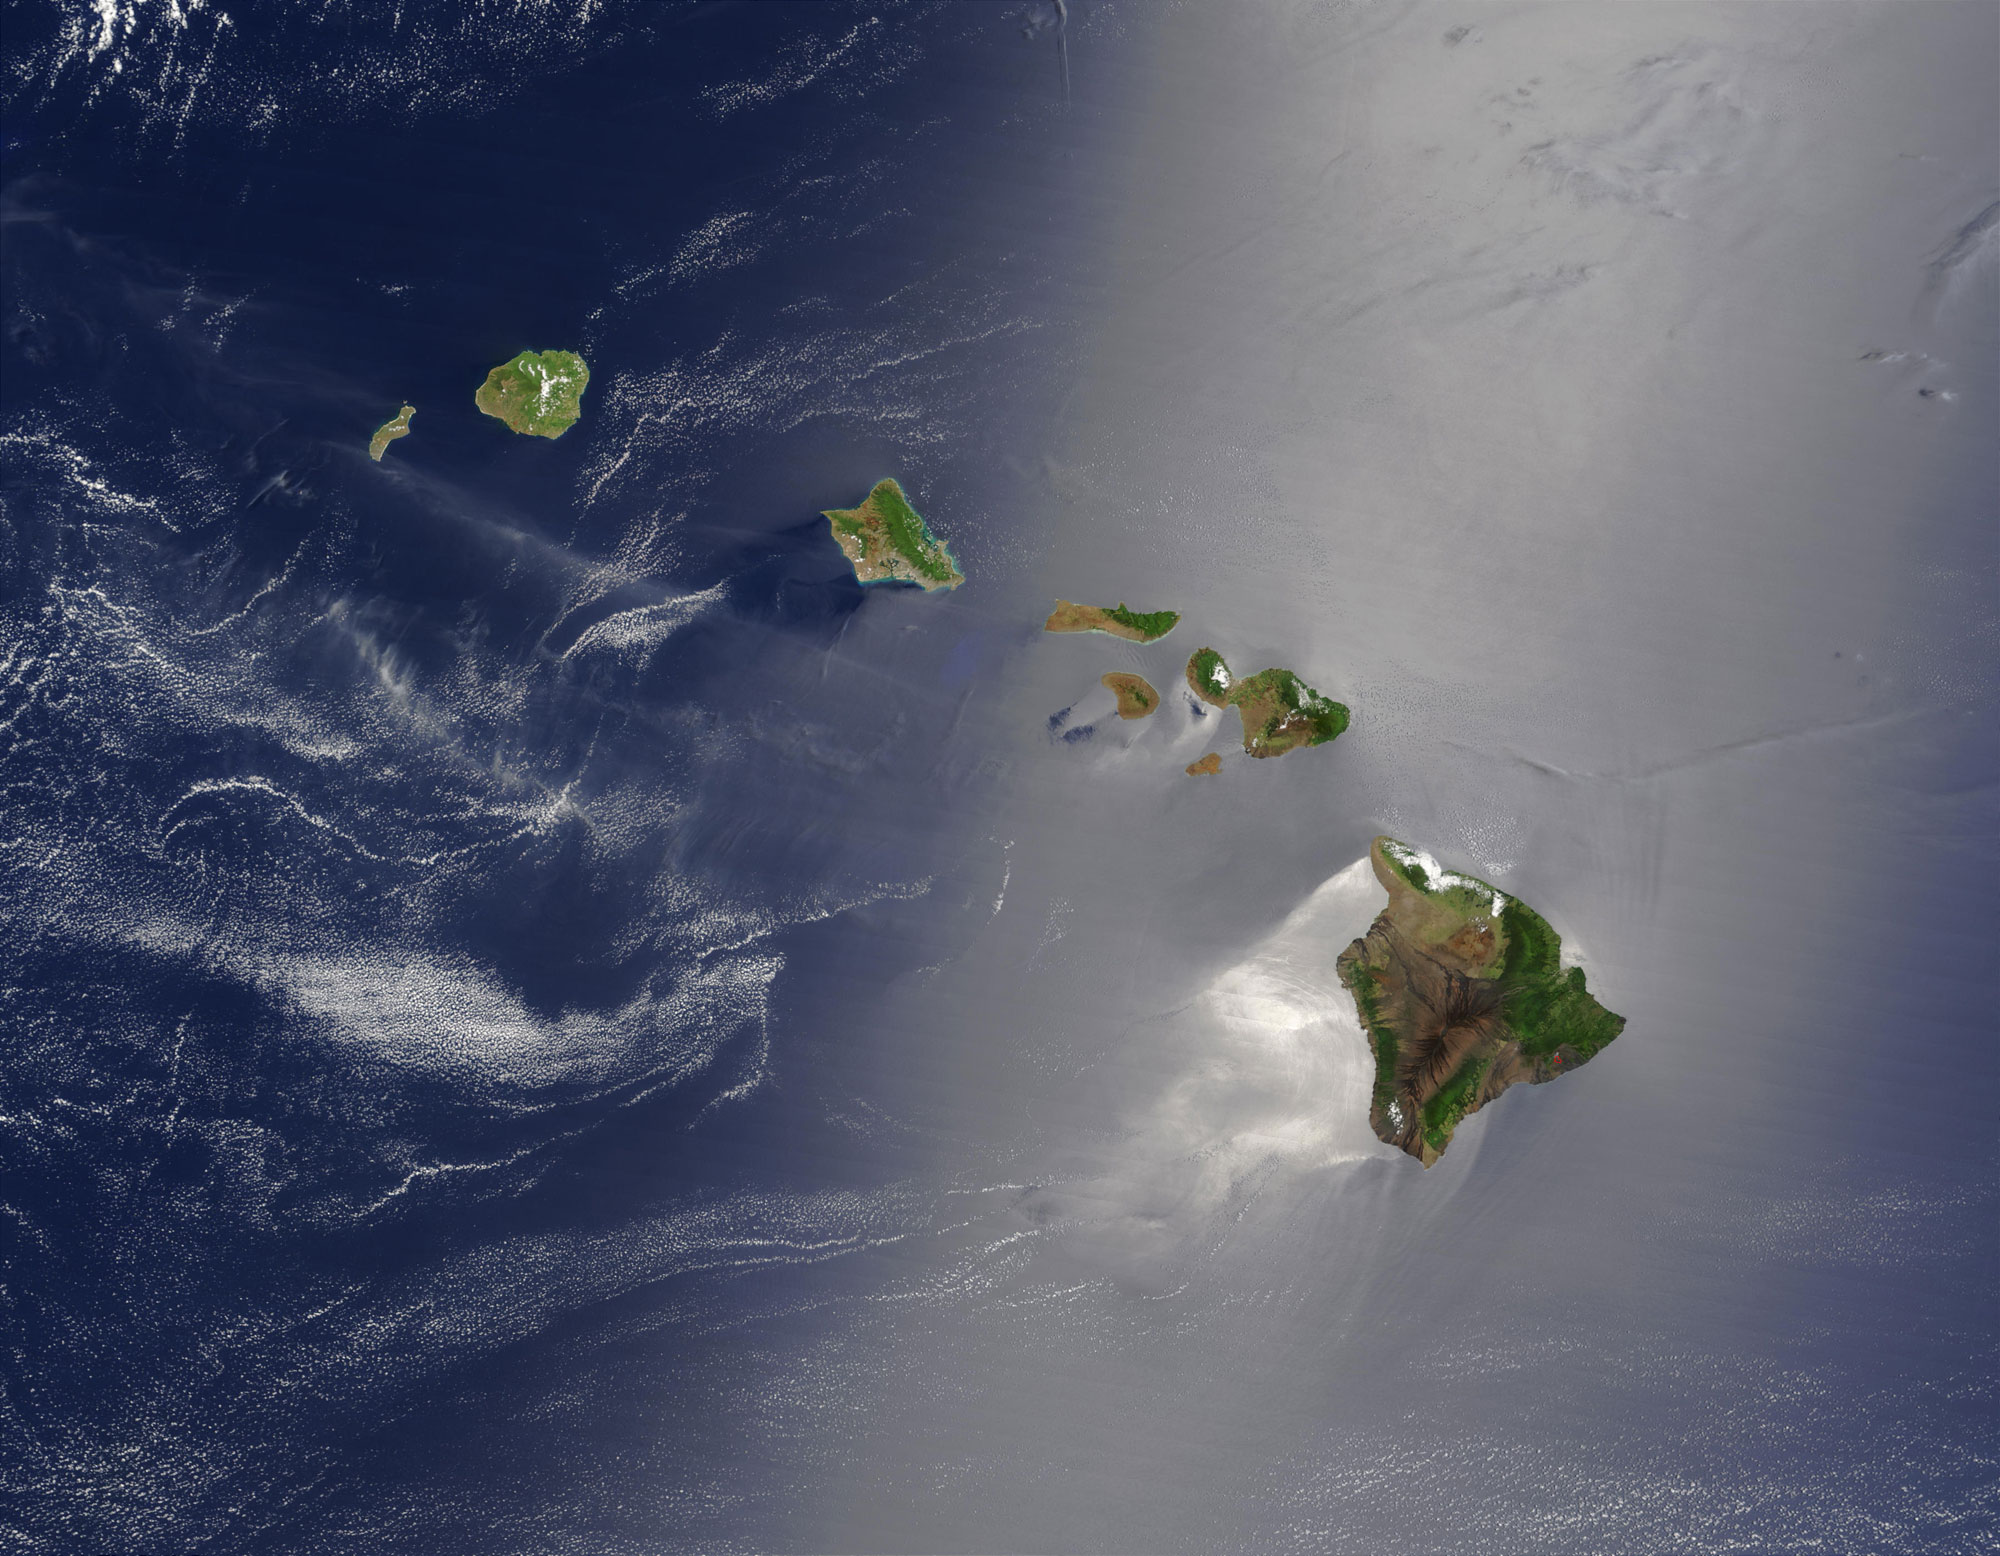
Satellite photo of the Hawaiian Islands surrounded by the waters of the Pacific Ocean. The effect of the northeast trade winds is seen in the shiny, highly reflective, calm water southwest of Hawai'i Island, where the ocean lies in the lee of the island's big volcanoes. Photo by Jacques Descloitres, MODIS Land Rapid Response Team at NASA GSFC (NASA Earth Observatory, used following NASA's image use policy).
Effect of latitude
Hawai'i lies between 19° and 22° north latitude, just south of the Tropic of Cancer. At this latitude, the global circulation of the atmosphere plays a significant role in climate. This circulation pattern the drives Hawai'i's cliamte is called a Hadley cell, named after 17th century meteorologist George Hadley.
Air circulation in Hadley cells
Hadley cells function as follows: Near the Equator, incoming sunlight warms the Earth’s surface year-round. As the Earth's surface warms, the air directly above the surface is also warmed, and this warm rises. The rising air expands (becomes "thinner" or less dense at higher altitudes) and cools, which causes water vapor to condense and fall as rain. Therefore, equatorial latitudes worldwide are characterized by meteorological low pressures and high rainfall.
When the rising air reaches neutral buoyancy with its surroundings (meaning, the air reaches a state where it neither rises nor sinks), it flows poleward. As it flows toward the poles, it continues to cool. When the air is cool enough, it becomes denser, which causes it to sink. The cool air sinks at about 30° latitude in both hemispheres.
The sinking air is compressed (becomes denser at lower altitudes), and compression causes the air to warm. Because warm air can absorb more water vapor than cool air, the warm air is now strongly undersaturated with water vapor (in other words, it is dry or has a low relative humidity). Thus, zones of high pressure and exceptionally dry climate occur near the latitudes of 30°N and 30°S, Earth’s “desert” latitudes.
At the surface, the air completes its circuit by flowing back toward the equator. The surface airflow is deflected westward by the Earth’s rotation, creating the trade winds.
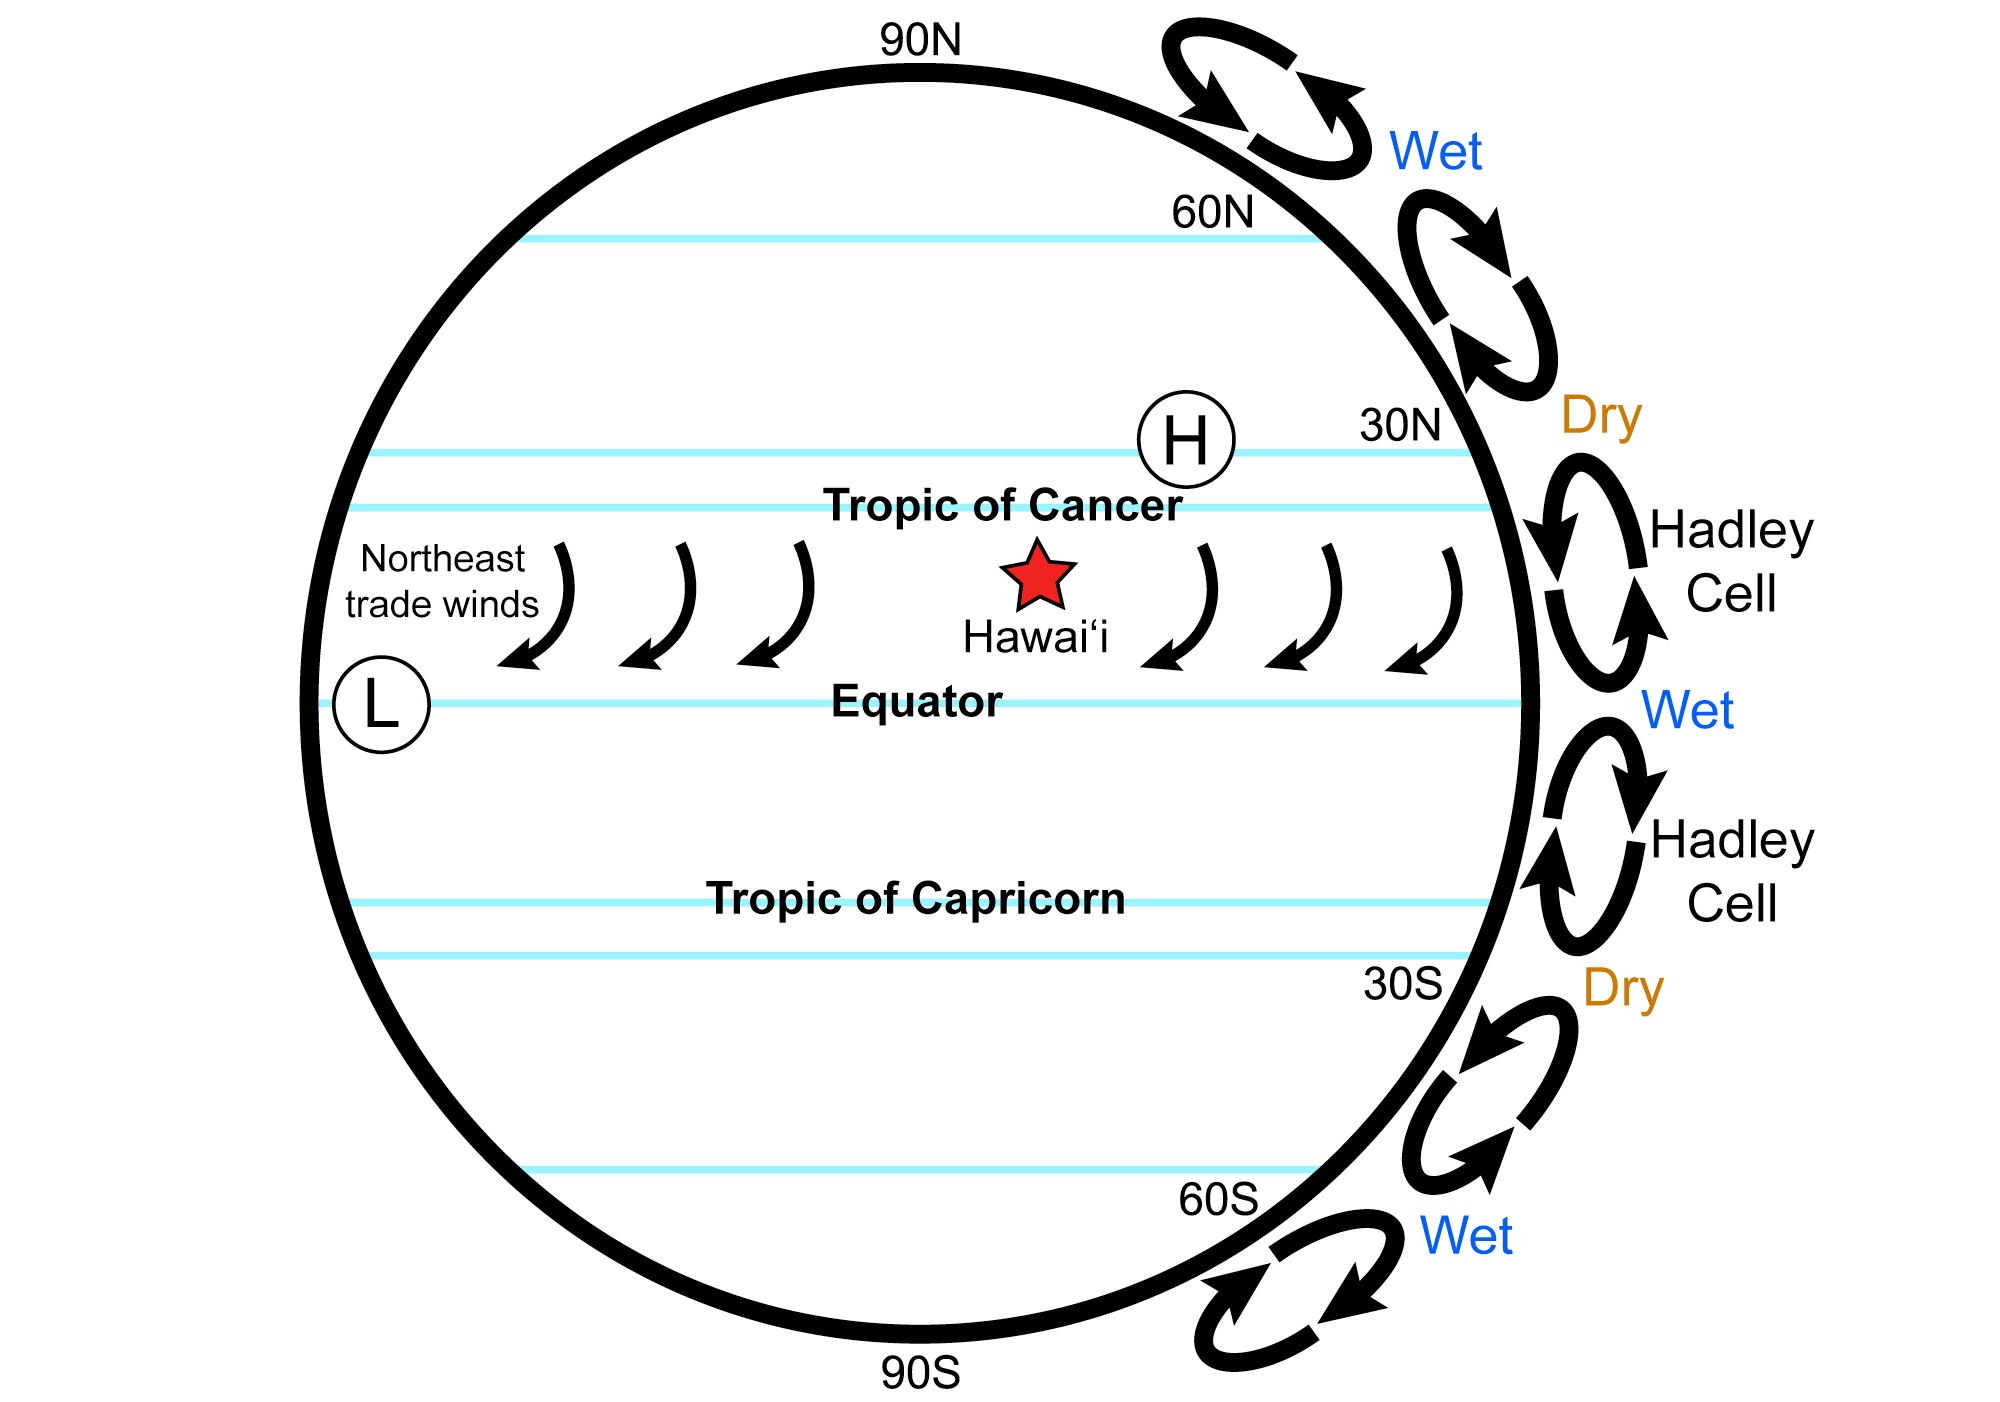
Aspects of general atmospheric circulation important for Hawai'i's climate. The islands lie within the tropics (the approximate location of the Island of Hawai'i is marked by the red star), in a belt of persistent northeast trade winds, and beneath the descending limb of the Hadley circulation cell. A stable high-pressure system called the North Pacific Anticyclone (H) remains north-northweast of the islands throughout the year. Diagram redrawn by E. J. Hermsen from a diagram by Alexandra Moore that was originally published in The Teacher-Friendly Guide to the Earth Science of the Western US.
Hadley cells and Hawai'i
Hawai'i, in the northern tropics, is located beneath the descending limb of the Hadley cell. In other words, it is located in a region where the air is sinking and warming as it approaches the Earth's surface. Thus, the air circulating in the Hadley cell over the islands is warmer at lower altitudes and cooler at higher altitudes. At the same time as this circulating air is sinking and warming, air near the surface is being heated by its contact with the warm Earth surface. This surface air also cools with increasing altitude.
Most of the time (80–90% of days), these two cooling trends are not continuous with one another. Instead, there is a temperature discontinuity at an altitude of about 2000 meters (6000 feet). This discontinuity is caused by differences in the cooling rate of the air circulating in the Hadley cell and the air at the surface. The moist surface air cools more quickly than the dry air circulating in the Hadley cell. This discontinuity between lower (surface) and upper (circulating) air is called the trade wind inversion. The inversion can easily seen from any vantage point in the islands, as it creates a ceiling for cloud formation (in other words, it places a limit on the altitude at which clouds form). Because of the ceiling for cloud formation, the inversion helps control where rain falls across the islands.
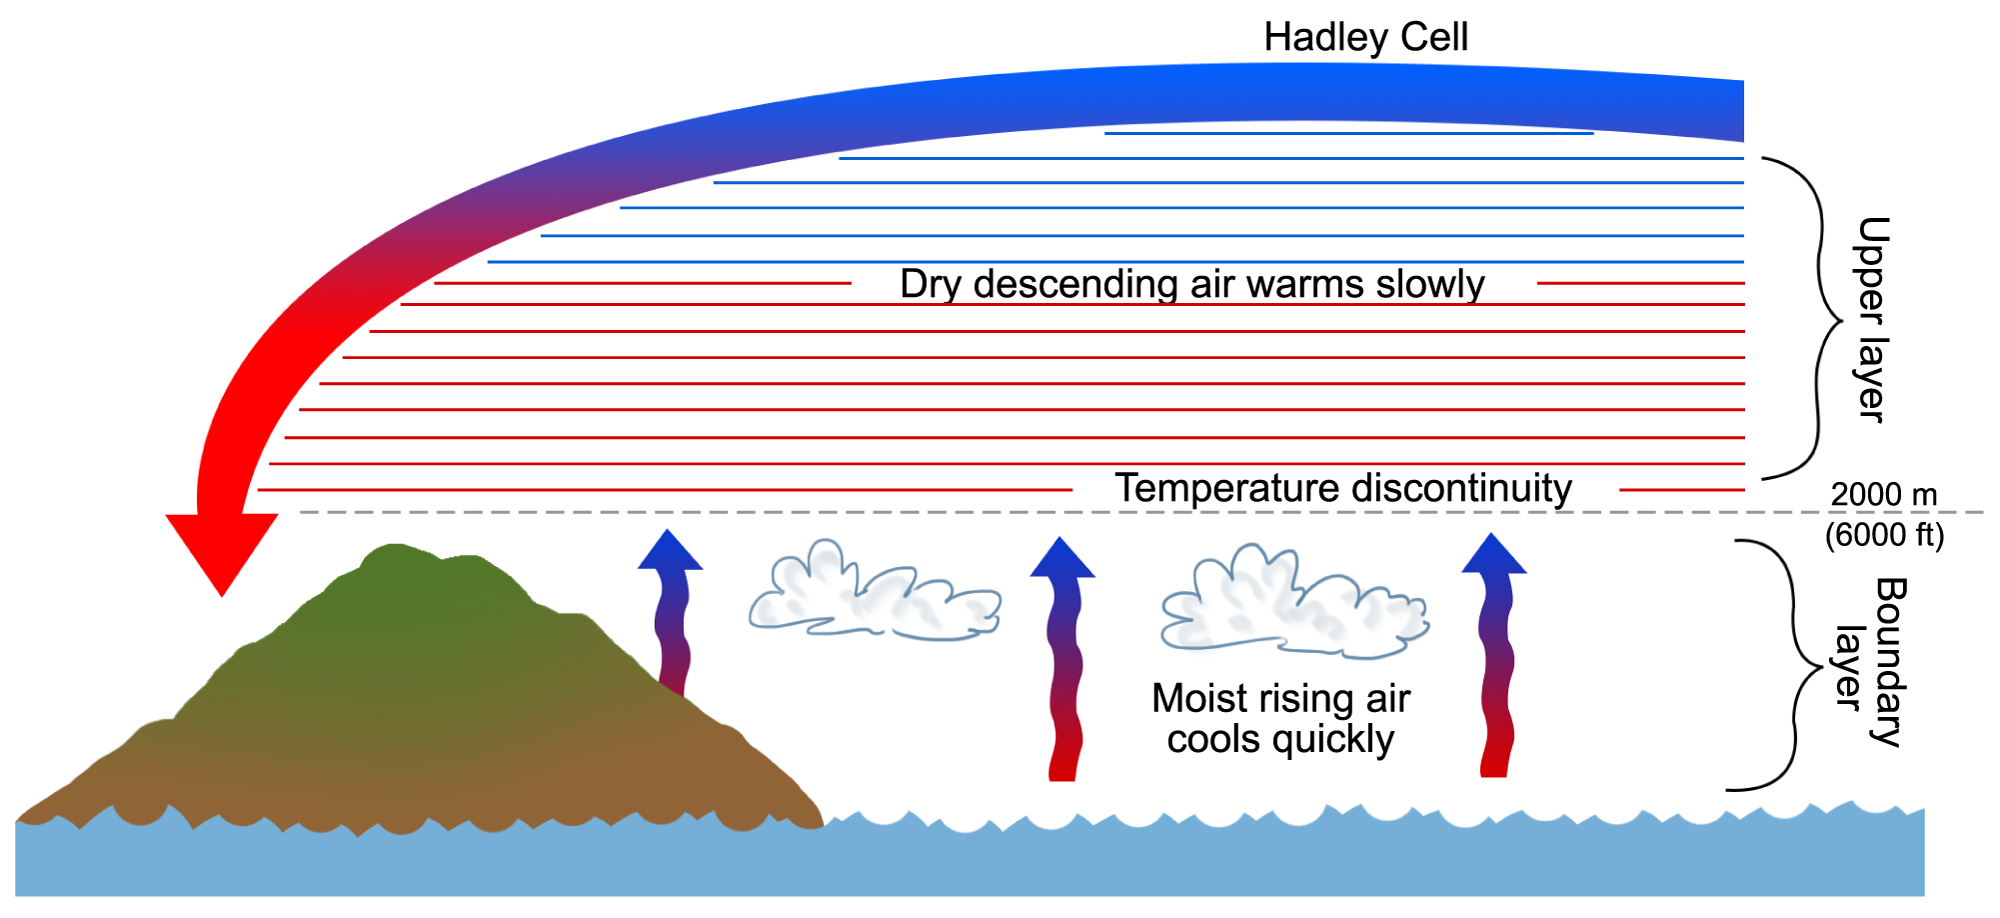
The rate of cooling of moist boundary layer air is faster than the rate of warming of dry descending Hadley cell air. The temperature (density) discontinuity prevents boundary layer air from mixing with upper layer air, and so it creates an upper ceiling for cloud formation. Image modified from an image by Wade Greenberg-Brand, first published in The Teacher-Friendly Guide to the Earth Science of the Western US.
Effect of topography
The most interesting control on the climate of Hawai'i is the high topographic relief of the islands. The islands of Hawai'i, Maui, Kaua'i, Moloka'i, and O'ahu all have summits that are above 1200 meters (4000 feet) in elevation. On Hawai'i Island, the peaks of Mauna Kea and Mauna Loa are each above 4180 meters (13,700 feet). Without these summits, Hawai'i would be a warm and humid place with relatively low rainfall. However, the presence of these huge mountains changes the local climate dramatically, which, in turn, leads to the great diversity of climate zones found in Hawai'i.
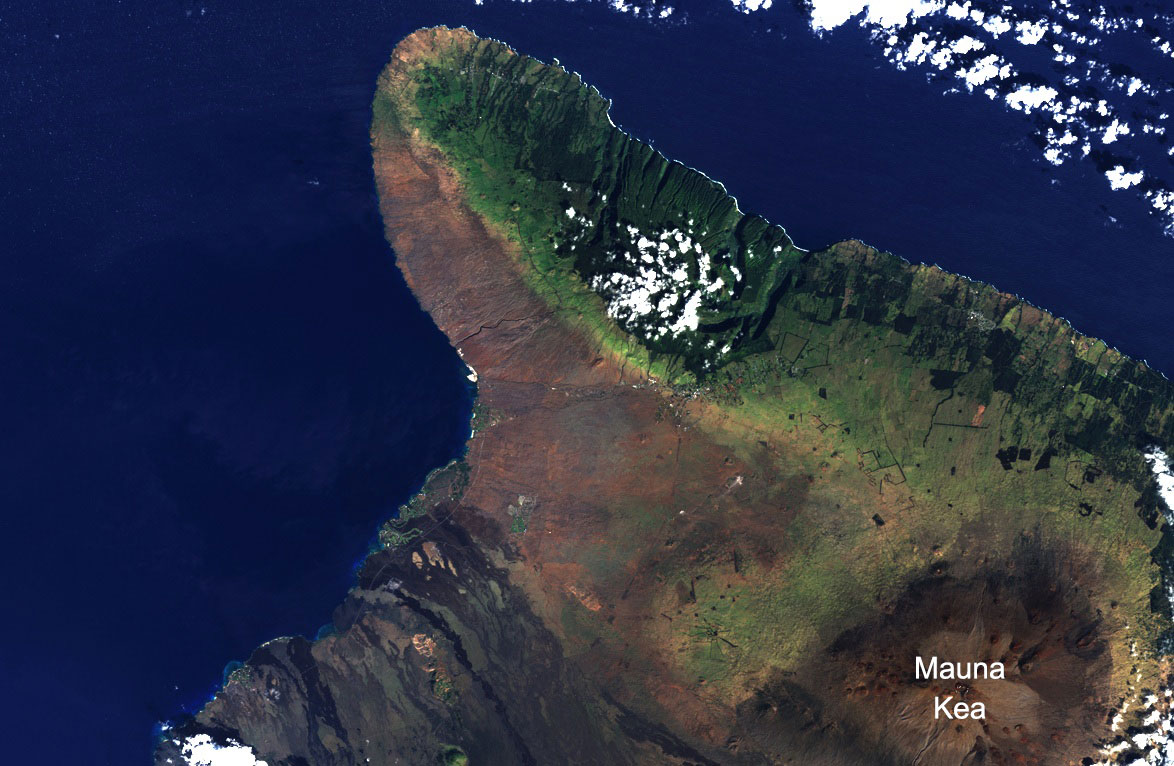
Satellite image of the northern tip of Hawai'i Island showing the effect of the rain shadow. Rain falls on the eastern side of the island, whereas the western side is dry. Photo by Hunter Allen (Climate.gov).
Rain shadows and precipitation
The air above the ocean near the Hawaiian Islands contains a large amount of water vapor (in other words, it is very moist or has a high relative humidity) because it is in contact with the warm tropical ocean. Northeast trade winds carry this moisture-laden air to the Hawaiian Islands. The mountainous islands divert the airflow, and the air travels both around and over the high points on the islands.
Air that rises over the island mountains expands and cools; this cooling causes the moisture in the air to condense and fall as rain. The air, which is now dry, then continues traveling over the mountains and down their leeward slopes, where it warms (as in a Hadley cell, compression of air at lower elevations warms the air). Thus, the windward sides of each island experience frequent and abundant rainfall, sometimes called orographic precipitation, or precipitation caused by the presence of mountains. In contrast, the leeward side of each island is very dry, a phenomenon known as a rain shadow.
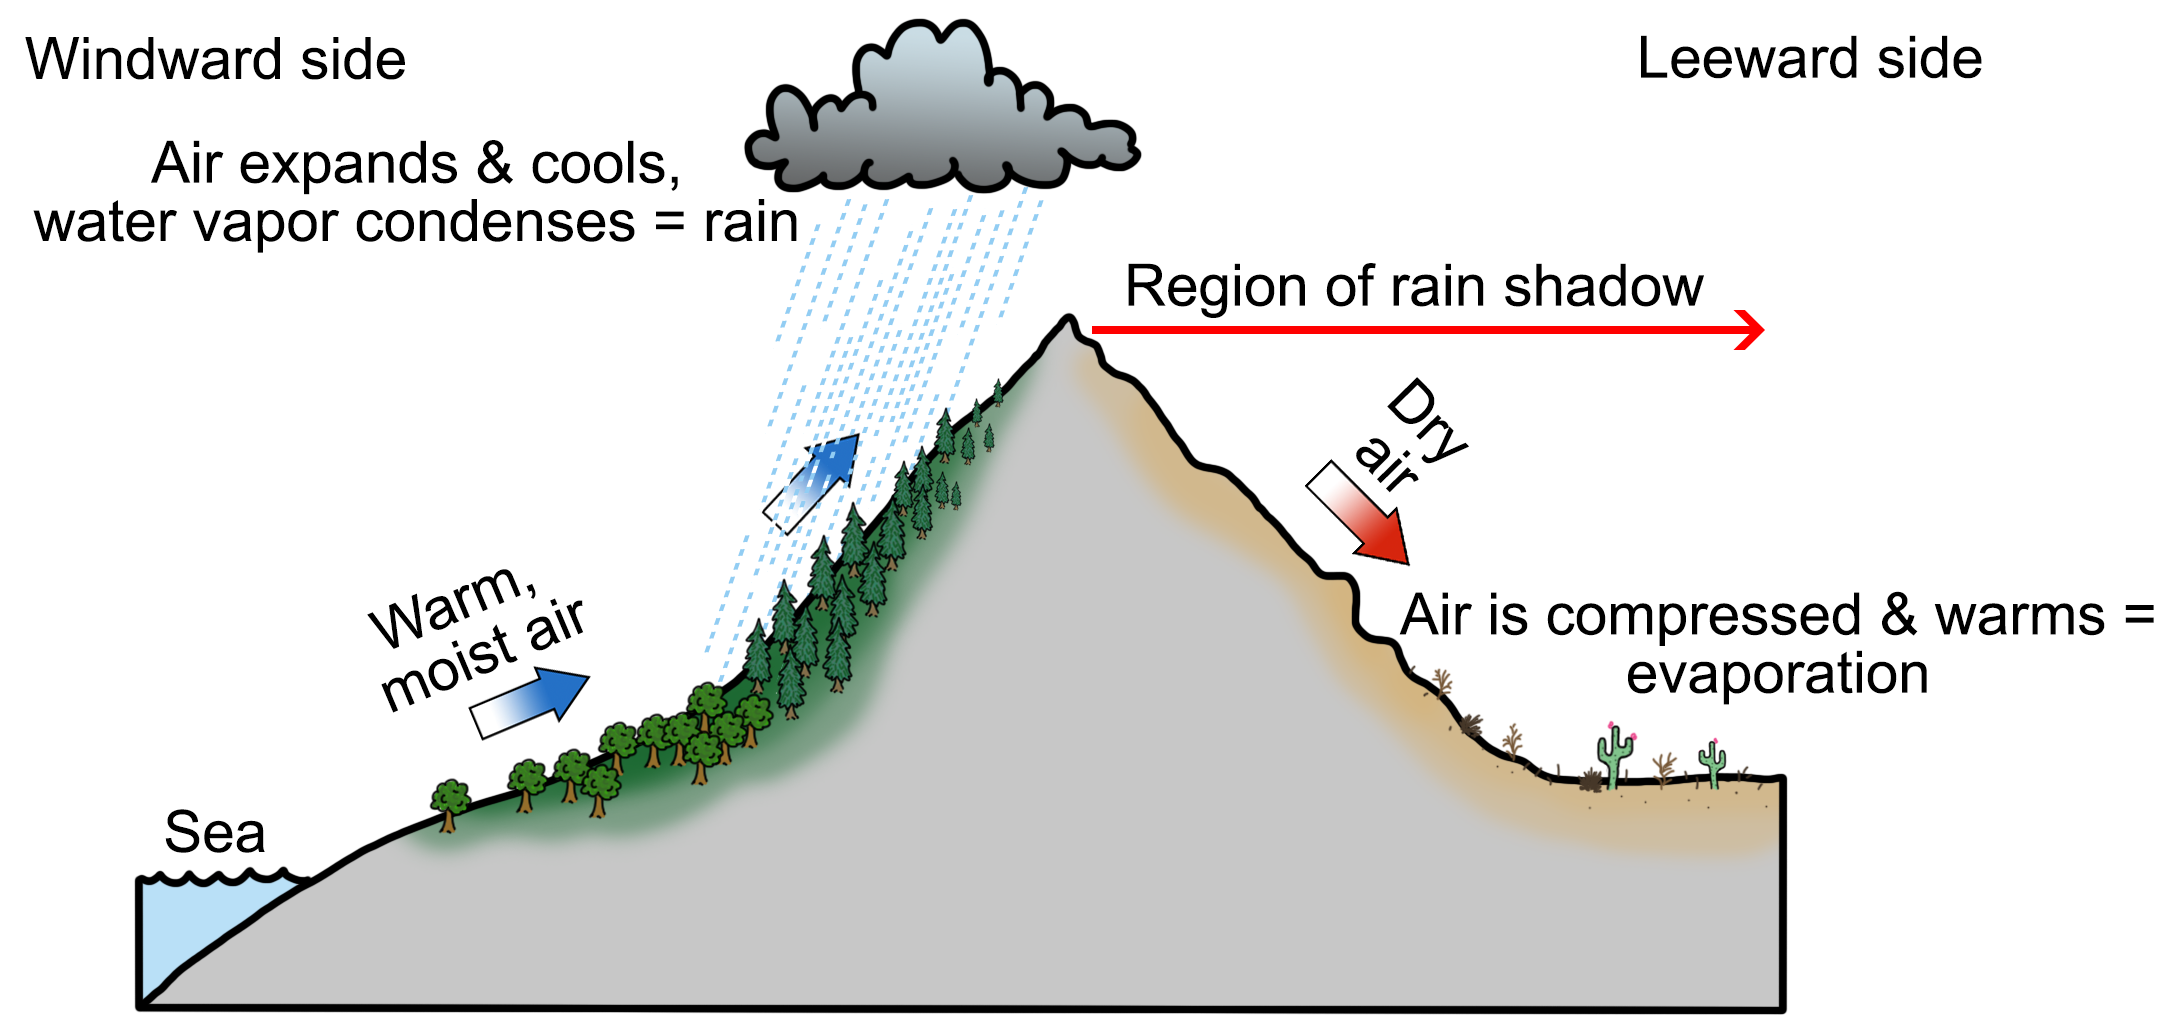
The rain shadow effect occurs when moisture-laden air rises up the windward side of a mountain, only to release this moisture as precipitation due to cooling and condensation. Once the air reaches the leeward side, it warms due to compression, promoting evaporation and a lack of precipitation. Diagram by Wade Greenberg-Brand, originally published in the Teacher Friendly Guide to Earth Science series, modified for Earth@Home.
Variations in precipitation
On most of the Hawaiian Islands, the maximum rainfall occurs at 610–910 meters (2000–3000 feet) above sea level. Areas of high topography are dry, as the trade wind inversion prevents clouds from rising high enough for orographic precipitation to occur there. The high summits and leeward slopes receive most of their annual precipitation during winter storms, when high-altitude, low pressure systems develop in the subtropics. These kona (Hawaiian for leeward) storms bring extended periods of rain; snow even falls on the summits of Mauna Kea and Mauna Loa on Hawai'i Island and Haleakalā on Maui.
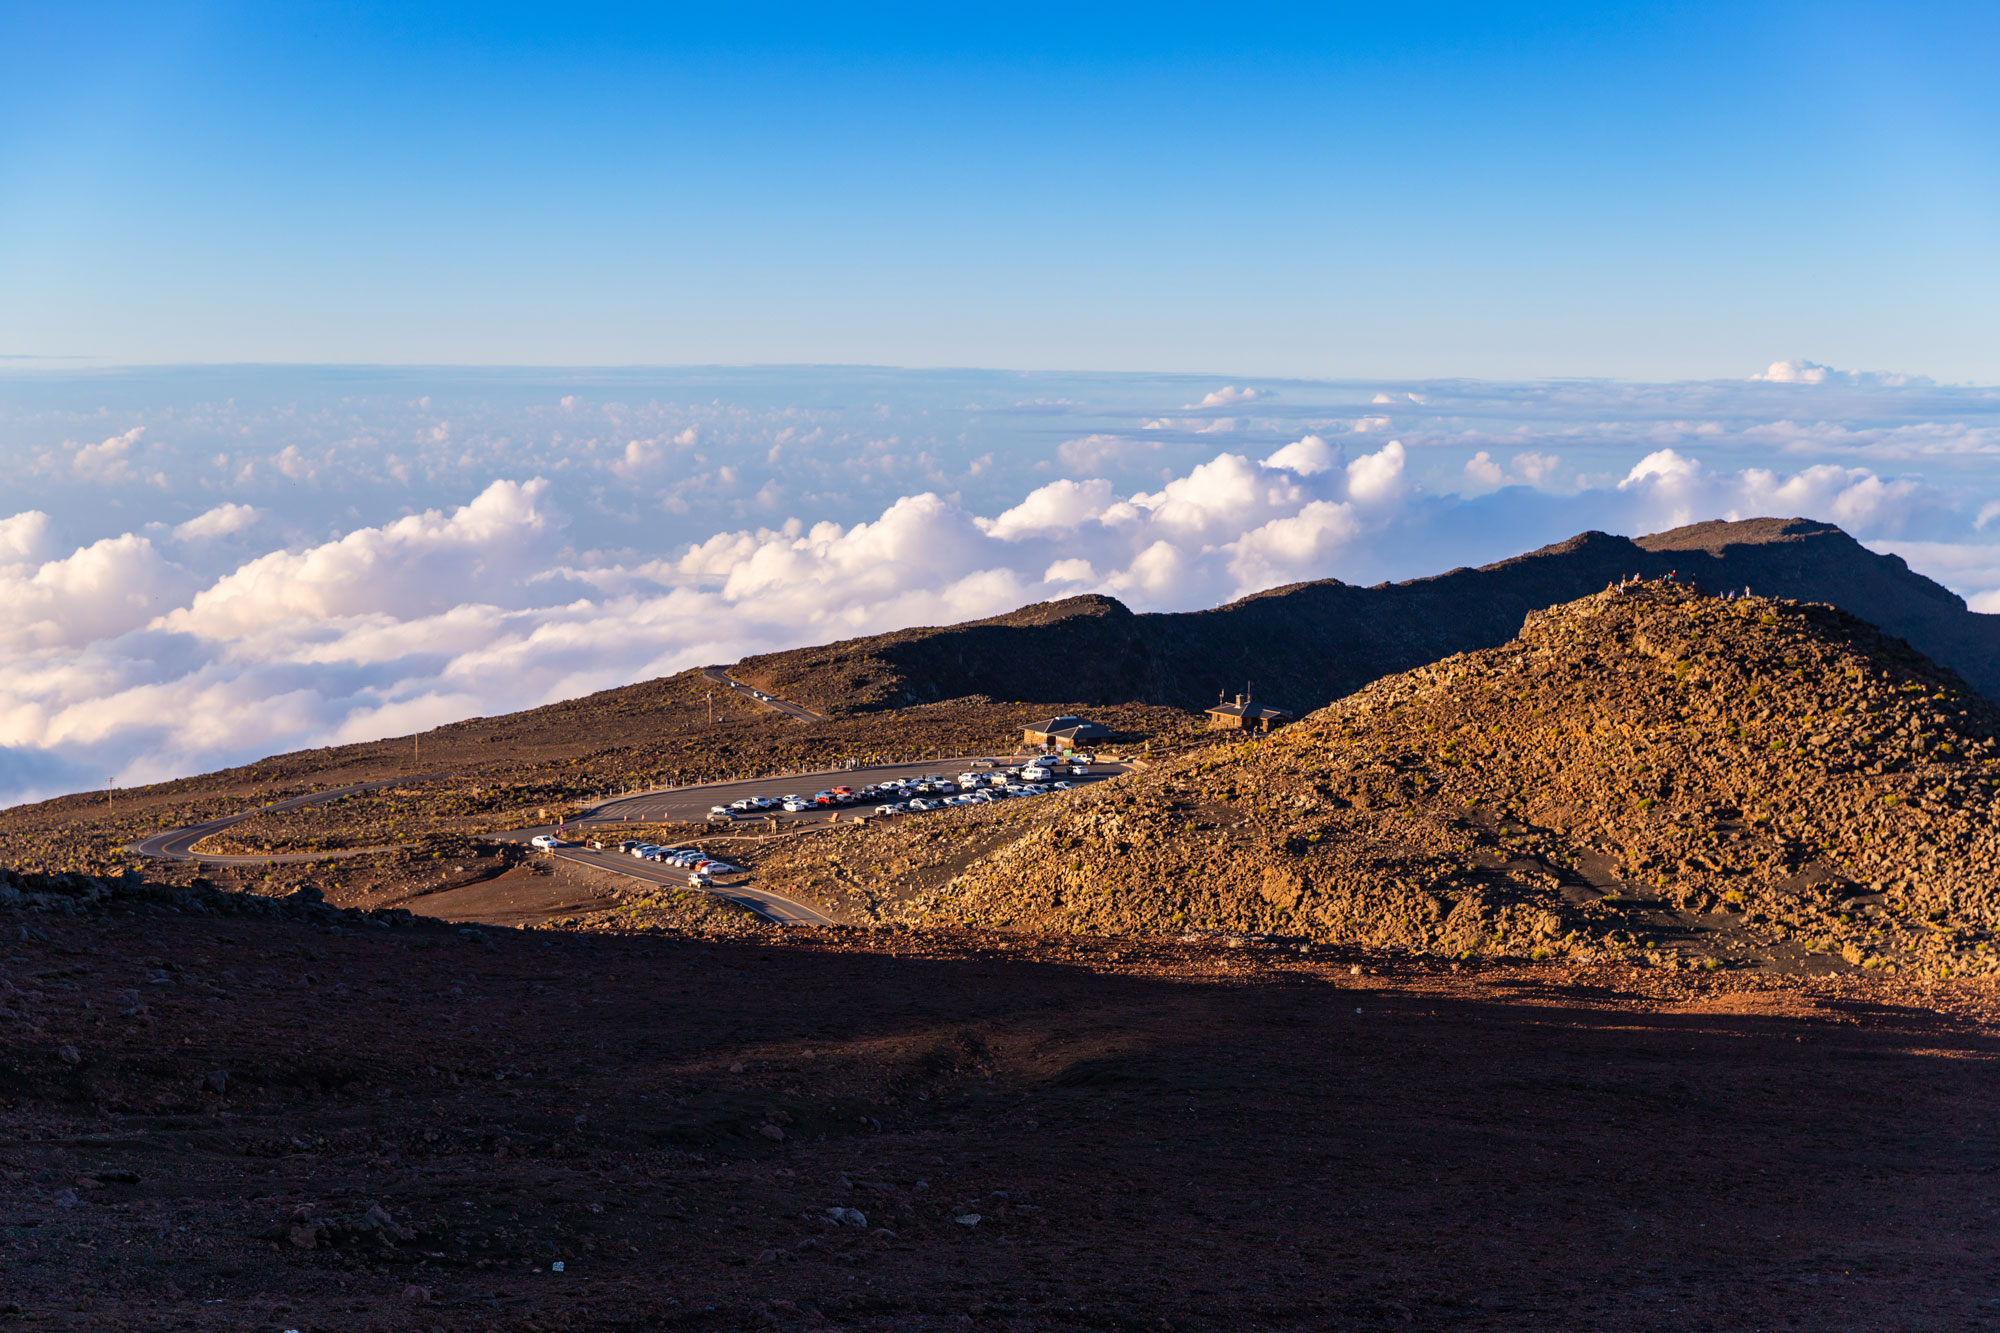
Clouds below the summit of Mt. Haleakalā, Maui. Photo by dronepicr (flickr, Creative Commons Attribution 2.0 Generic license, image resized).
Two locations in Hawai'i—Mt. Wai'ale'ale on Kaua'i (1570 meters or 5150 feet above sea level) and Big Bog on Haleakalā, Maui (1650 meters or 5400 feet above sea level)—average 1029 centimeters (405 inches) of rainfall per year. Not only do these locations vie with each other for the title of wettest spot in the U.S., they are two of the wettest spots on Earth.
Many areas on the islands' leeward coasts receive less than 50 centimeters (20 inches) of annual rainfall. The village of Puakō on Hawai'i's kona coast averages 23 centimeters (9 inches) per year and is the driest inhabited spot in the islands. The summit of Mauna Kea receives only 20 centimeters (8 inches) of precipitation per year; it is the driest place in the state, with the same rainfall as Phoenix, Arizona.
The truly remarkable aspect of this large variation in rainfall is the short distance that separates rainy and dry areas in Hawai'i. The wettest (Big Bog) and driest (Mauna Kea) places in Hawai'i are only 121 kilometers (75 miles) apart. In the continental U.S., Olympic National Park in Washington is the rainiest spot; it receives about 380 centimeters (150 inches) per year. Death Valley, California, is the driest spot, receiving about 6.4 centimeters (2.5 inches) of precipitation per year. These two locations are 1450 kilometers (900 miles) apart, yet the difference in rainfall is not nearly as large as that measured in Hawai'i.
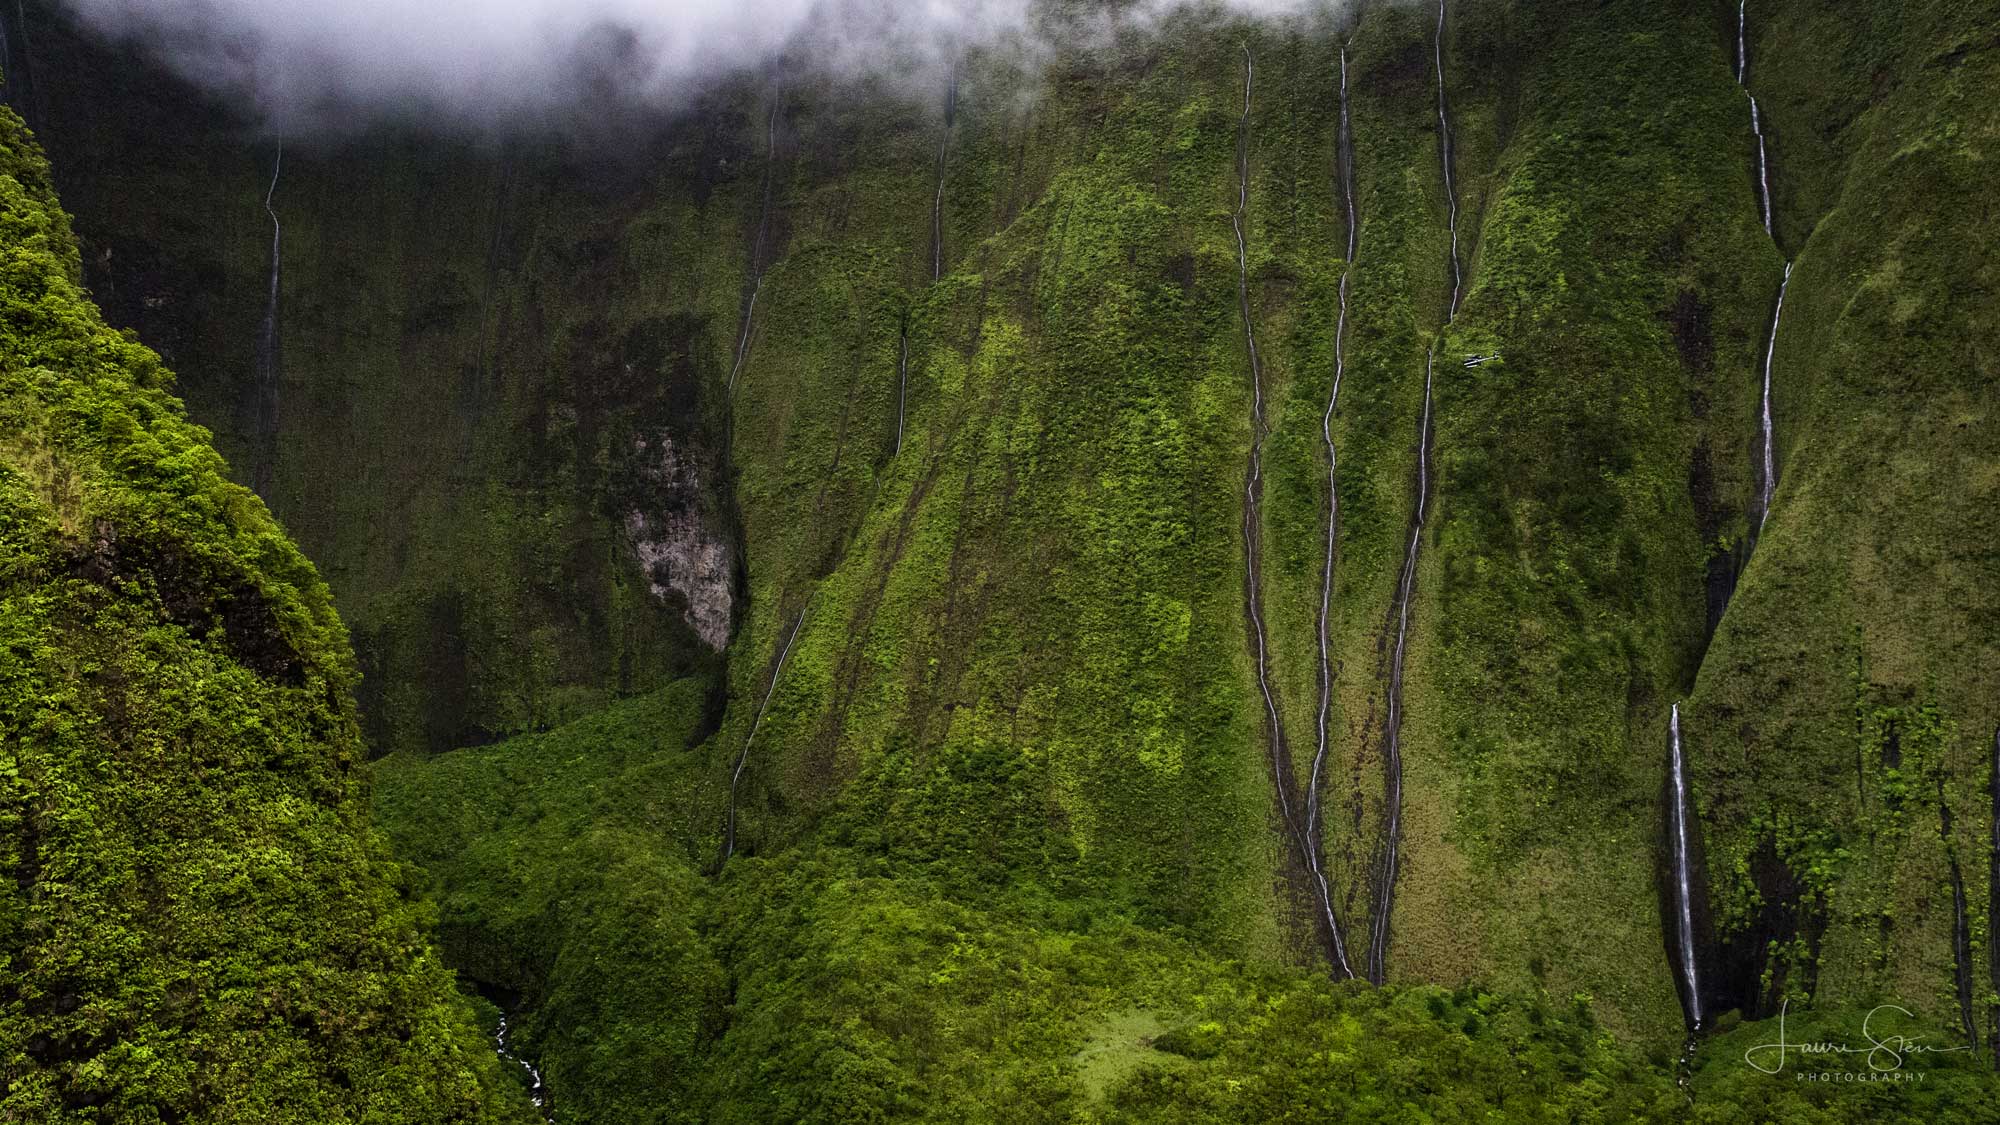
Water flowing down a slope, Mt. Wai'ale'ale, Kaua'i. Photo by Lauri Sten (flickr, Creative Commons Attribution-NonCommercial 2.0 Generic license, image resized).
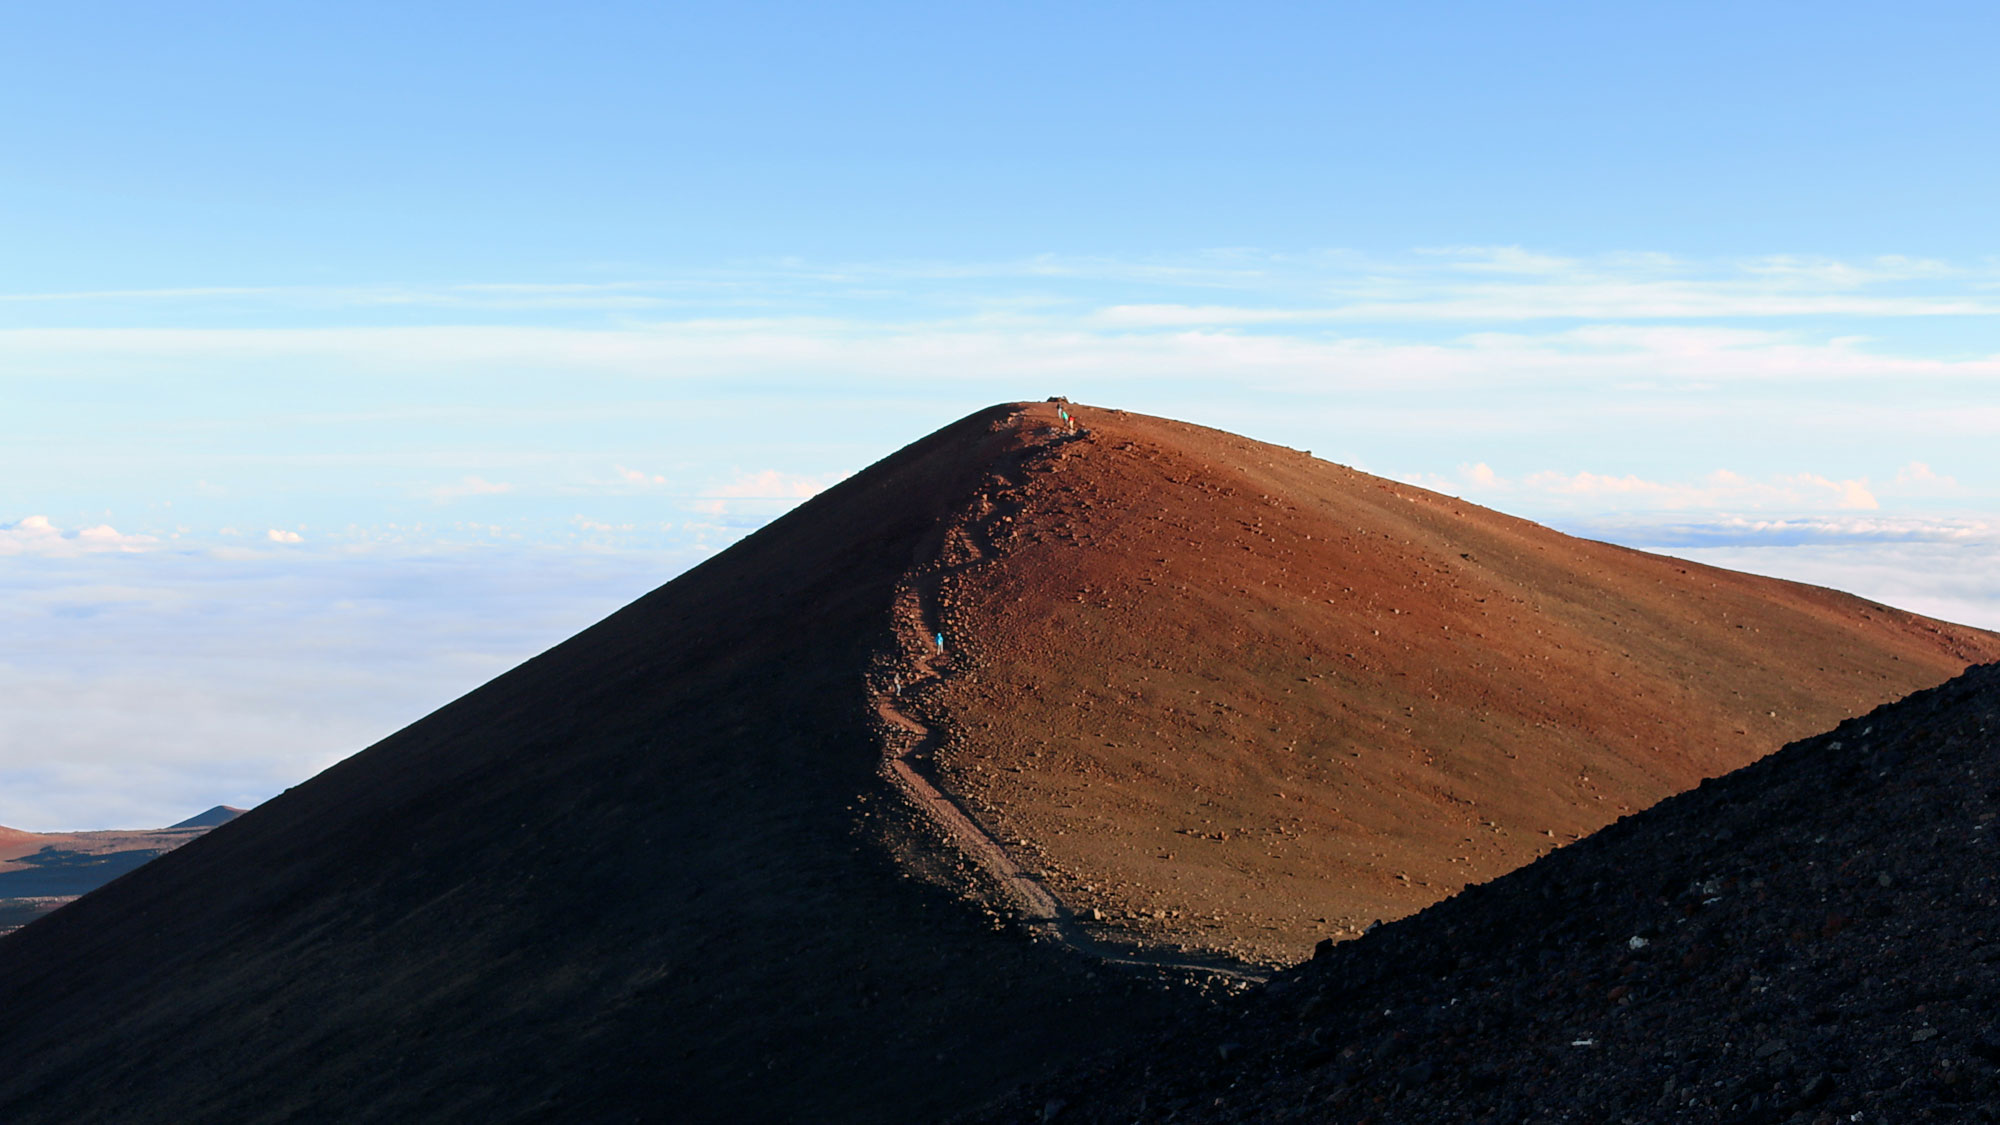
The summit trail on Mauna Kea, Hawai'i Island. Photo by Robert Linsdell (Wikimedia Commons, Creative Commons Attribution 2.0 Generic license, image resized).
Past Climate of Hawai'i
The Hawaiian Islands began to form 11 million years ago (in the Miocene), although most are younger than 7.5 million years. These islands formed from volcanoes erupting from the seafloor over what geologists call a hot spot. Hawai'i has a poorly preserved paleoclimate record, probably because the landscape has been so active, with continuous volcanic eruptions and new lava flows covering the landscape as well as intense erosion occurring on the wetter, windward sides of the islands. Because of the islands’ latitudinal position, geological records found in the nearby deep sea, and the nature and depth of the soils formed on the long-exposed lava, we know that Hawai'i’s climate has always been tropical to subtropical.
Hawai'i’s steep climate gradients provide a unique opportunity to study the effects of climate change. When global temperatures rise or fall, Hawai'i’s ecosystems migrate up or down the mountainsides. This phenomenon can be observed for past climates through the analyses of fossil pollen grains. During glacial epochs, the summits of Mauna Kea, Mauna Loa, and Haleakalā were covered by ice caps. Clear evidence of glaciation is seen on the slopes of Mauna Kea today, where terminal moraines mark the maximum extent of ice 18,000 years ago. Additionally, ancient sand dunes—now lithified to calcareous sandstone—mark the position of sea level highstands during interglacial periods.
The proximity of different climate regimes gives Hawai'i a highly diverse set of ecosystems. As colonizing organisms moved into the numerous different ecological niches on the islands, they underwent an adaptive radiation of species, resulting in one of the most highly endemic and unique groups of organisms on the planet.
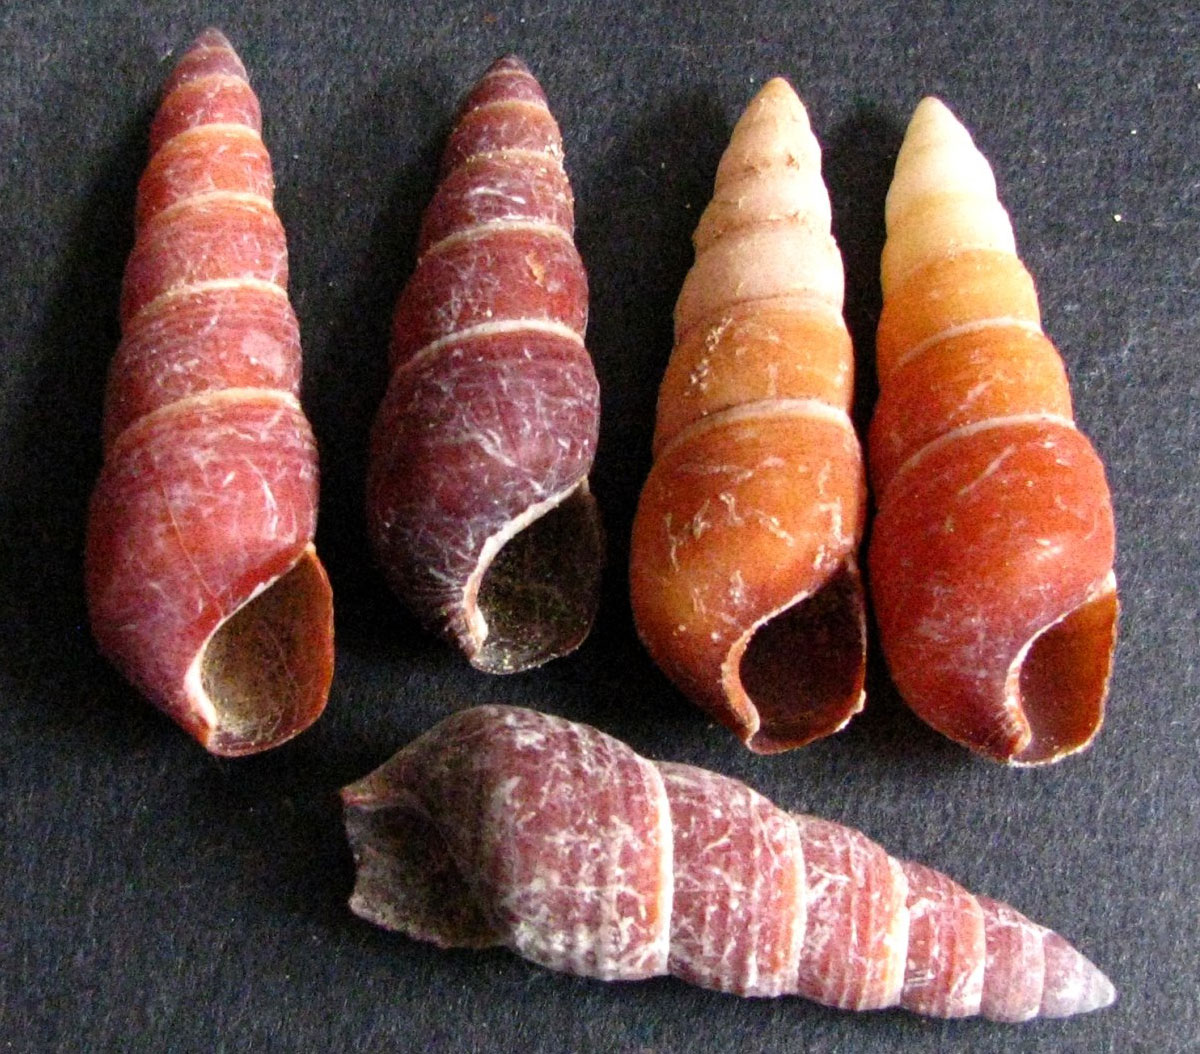
Shells of Carelia cochlea, a land snail found only on Kaua'i. This species probably went extinct in the 1800s. Photo by David Eickhoff (flickr, Creative Commons Attribution 2.0 Generic license, image cropped).
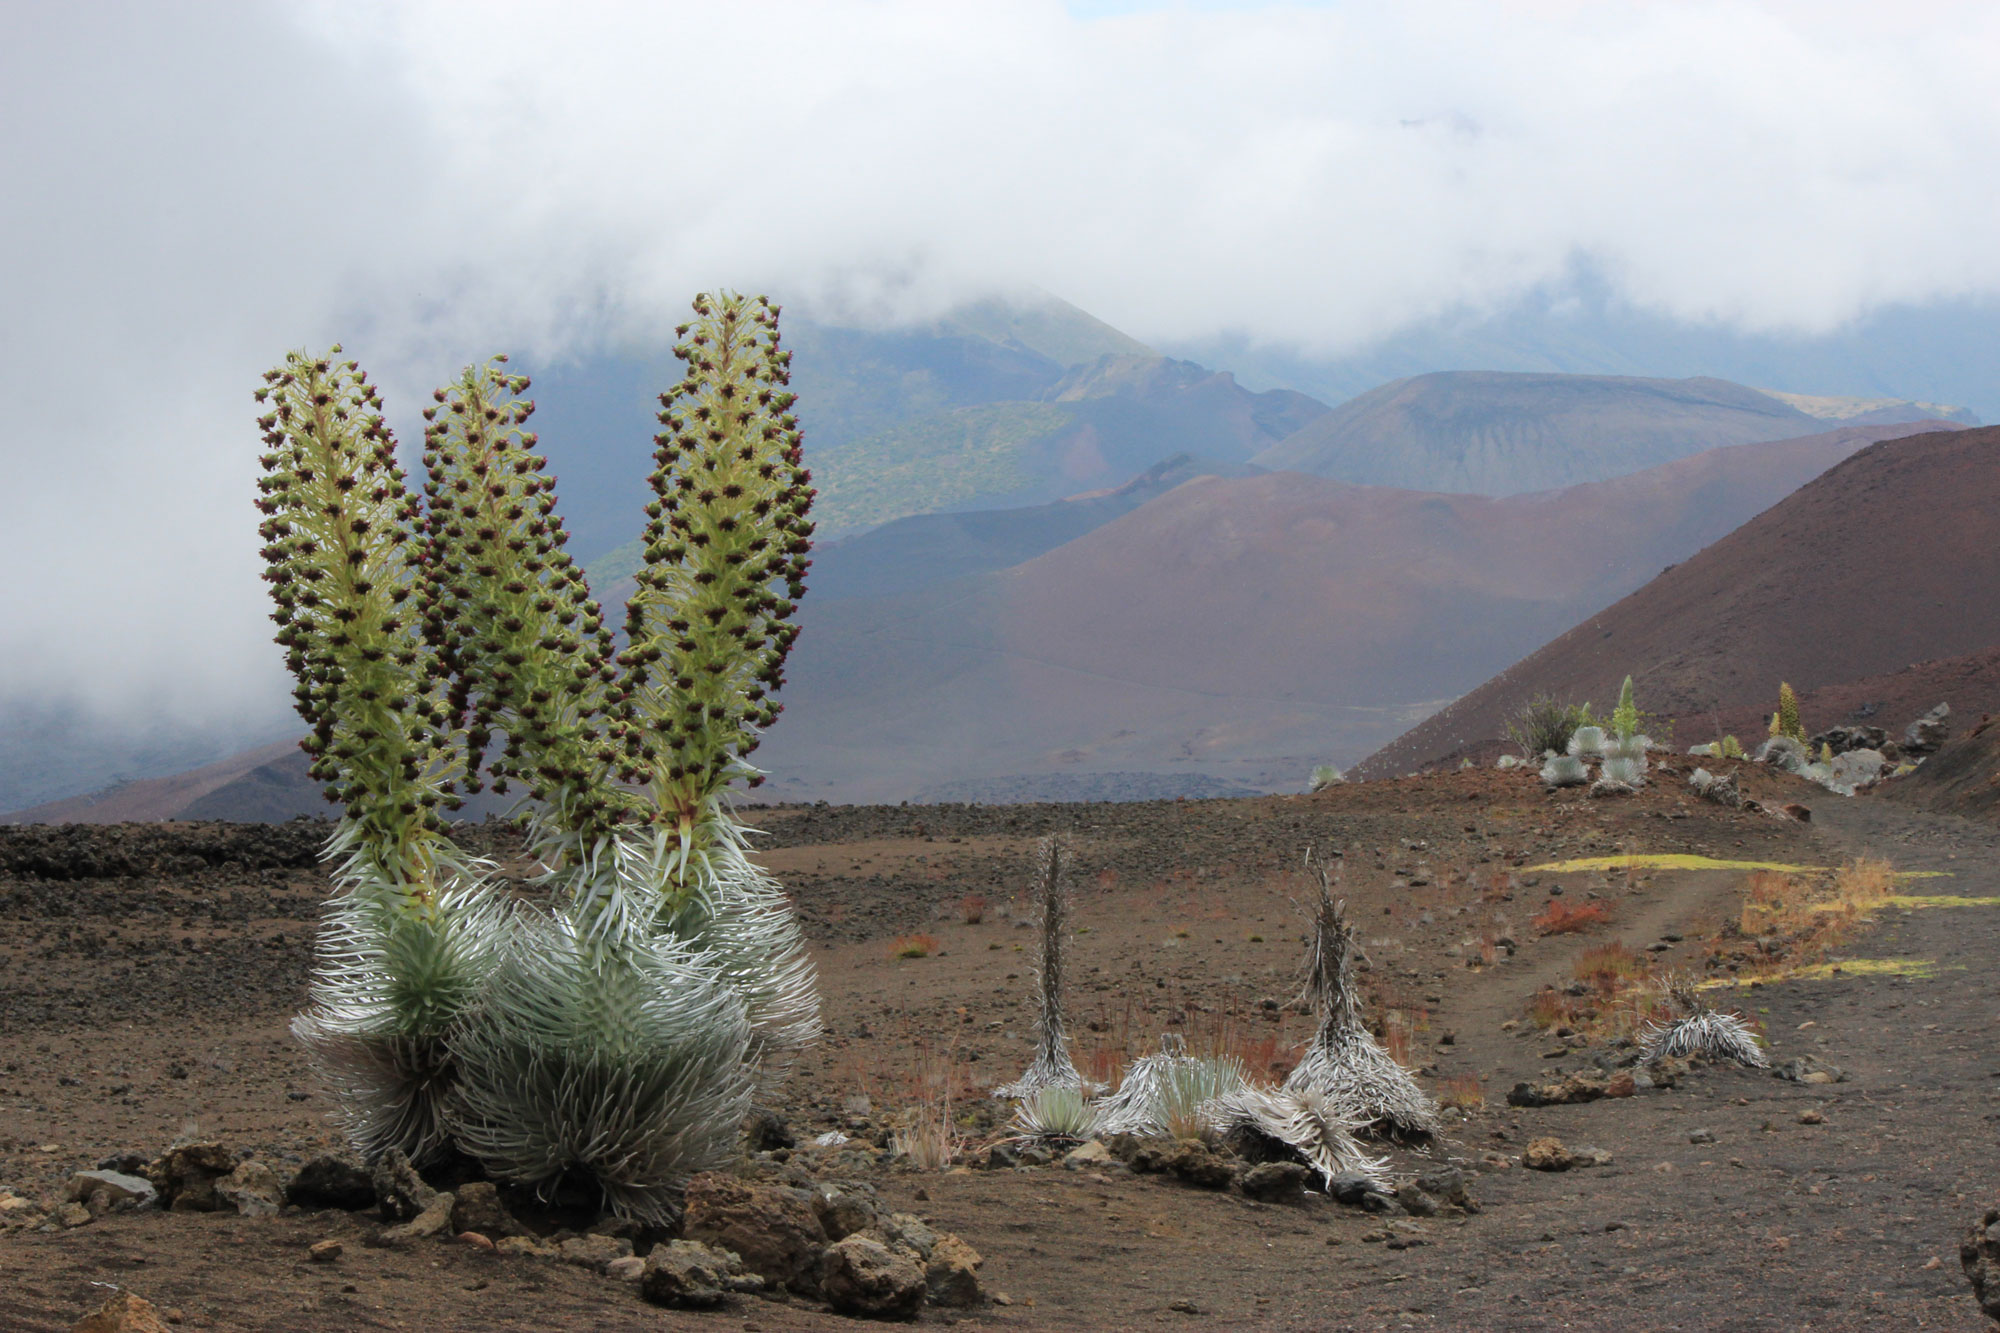
'Ahinahina or silverswords (Argyroxiphium) at Haleakala National Park, Maui. Scientists think that the silverswords descended from a California tarweed that reached the Hawaiian Islands over 5 million years ago. Photo by A. Rulison, NPS (National Park Service, public domain).
Future climate of Hawai'i
The climatic features of Hawai'i draw tourists from around the world and influence the development of human communities in the islands. Not surprisingly, most development occurs on the sunny leeward sides of the islands, but, unfortunately, most water resources are found on the windward sides.
Hawai'i and climate research
Climatic diversity and steep climate gradients make Hawai'i a unique natural laboratory for basic scientific research and applied agricultural research. Climate scientists have long identified the summits of Hawaiian volcanoes as ideal sites for atmospheric study.
The high-altitude, cloud-free summits of Mauna Kea and Mauna Loa on Hawai'i Island are ideal sites for astronomical and atmospheric research, respectively. In 1956, NOAA established the Mauna Loa Observatory (MLO) at an elevation of 3500 meters (11,500 feet) on the north flank of Mauna Loa. MLO is well above the trade wind inversion, and it is located more than 3200 kilometers (2000 miles) from any continental landmass. Instrumentation at MLO therefore samples very clean air in the upper atmosphere, and MLO is the oldest and most important baseline station for analysis of atmospheric composition.
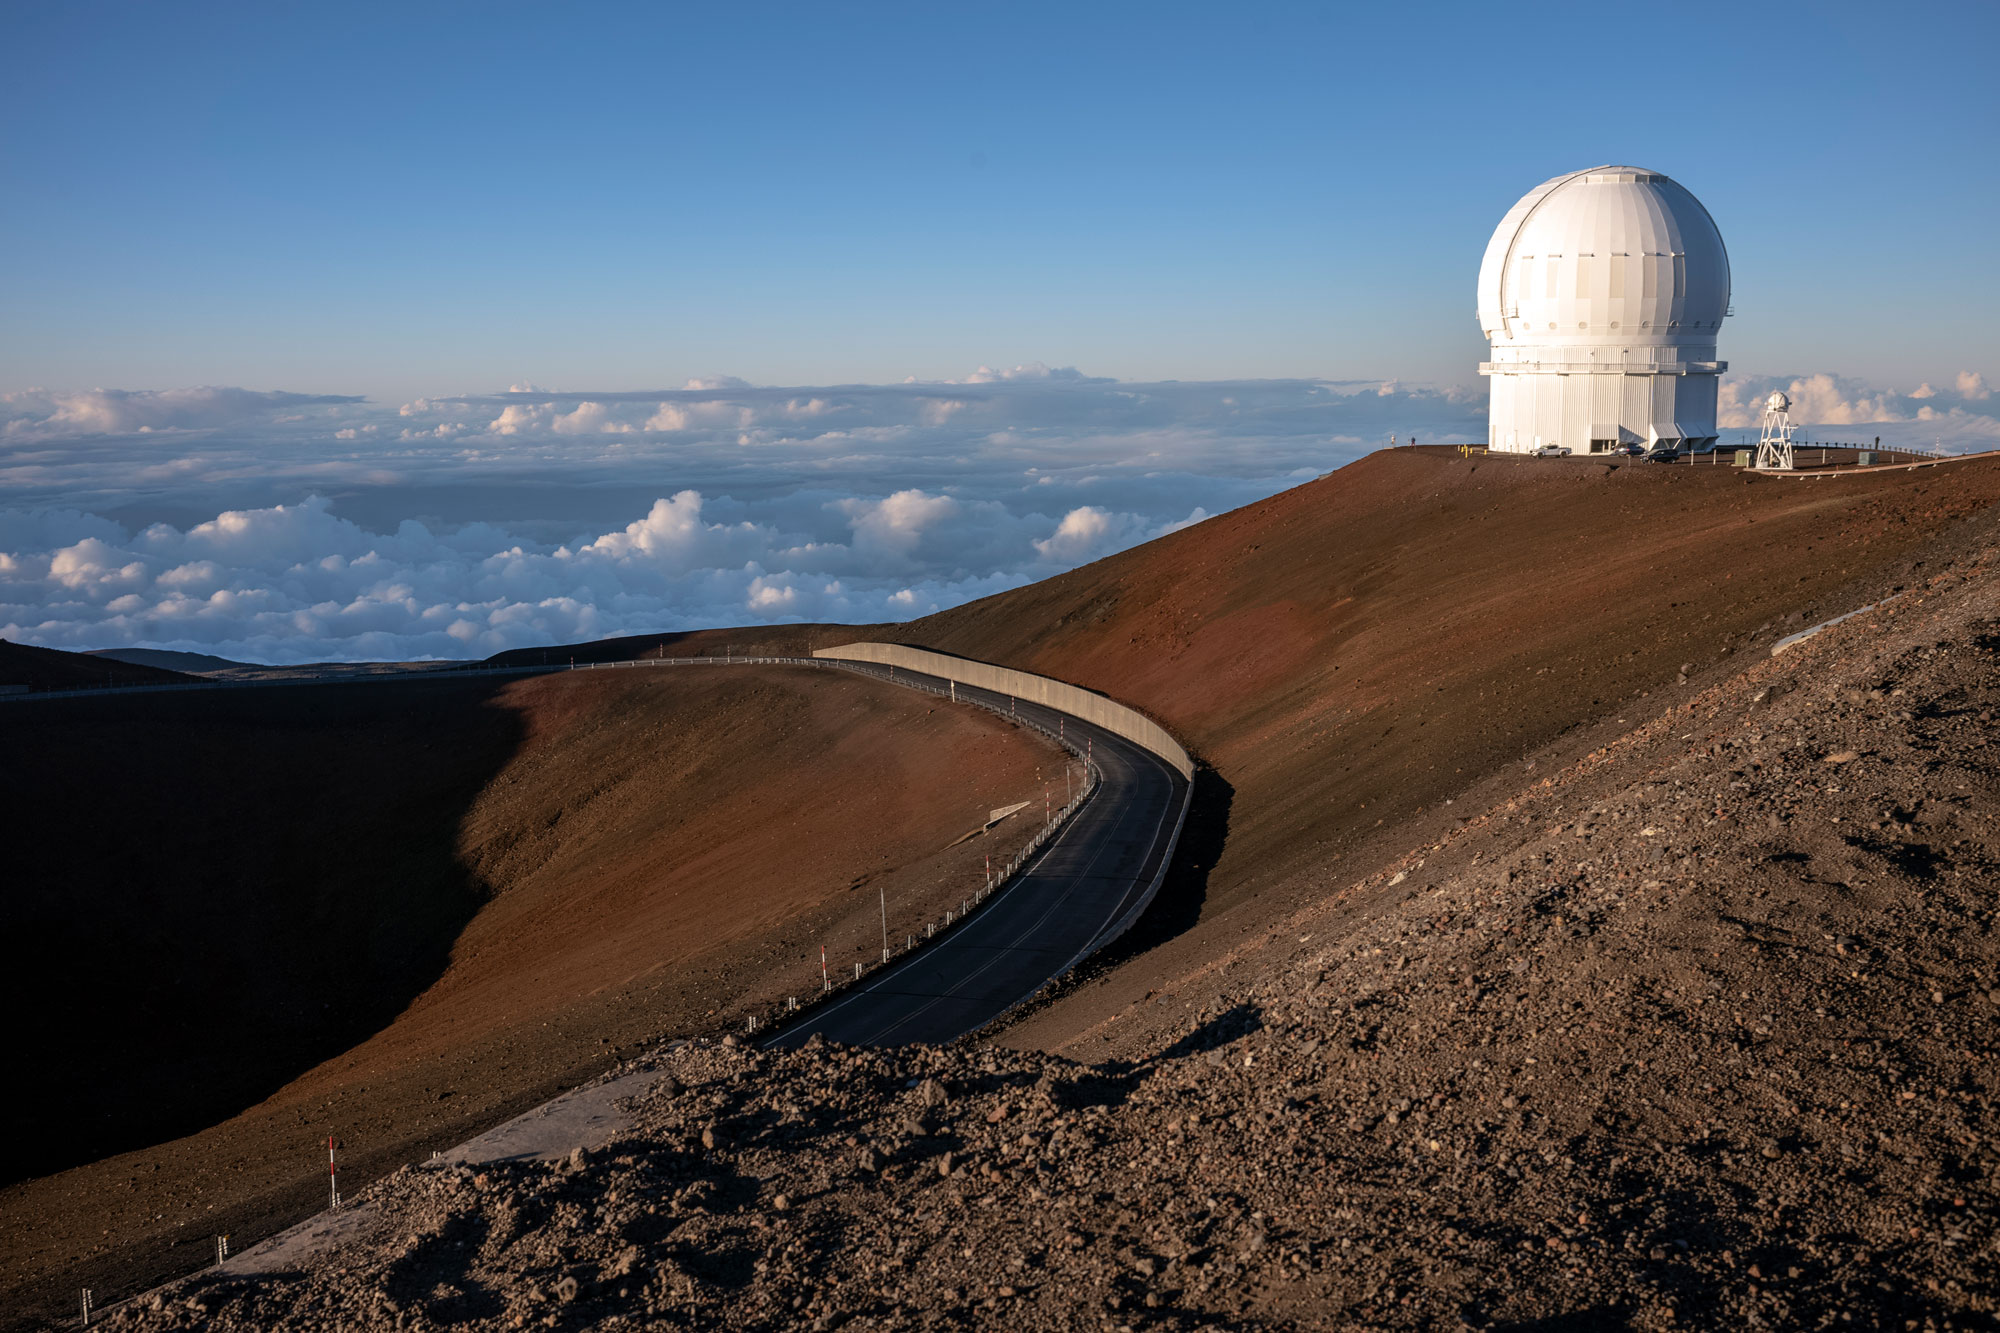
Mauna Loa Observatory, Hawai'i Island. Photo by Christopher Michel (flickr, Creative Commons Attribution 2.0 Generic license, image resized).
Impacts of climate change
Hawai'i stands to be significantly impacted by climate change, with serious potential effects on both its ecosystems and economy. Rising temperatures could disrupt the pattern of trade winds, changing rainfall patterns across the islands and creating periods of flooding or drought. Higher temperatures will also place more stress on native plants and animals, enabling the proliferation of invasive species that are better able to withstand temperature extremes. Warming oceans and increased ocean acidity could trigger massive coral die-offs and affect ocean circulation. Finally, sea level rise could inundate much of Hawai'i's coastline. The worst case scenario of a 2-meter (6-foot) sea level rise would bring Hawai'i's coast 1.6 kilometers (1 mile) inland in some places, submerging or eroding important economic locations like Waikiki Beach and parts of Honolulu.
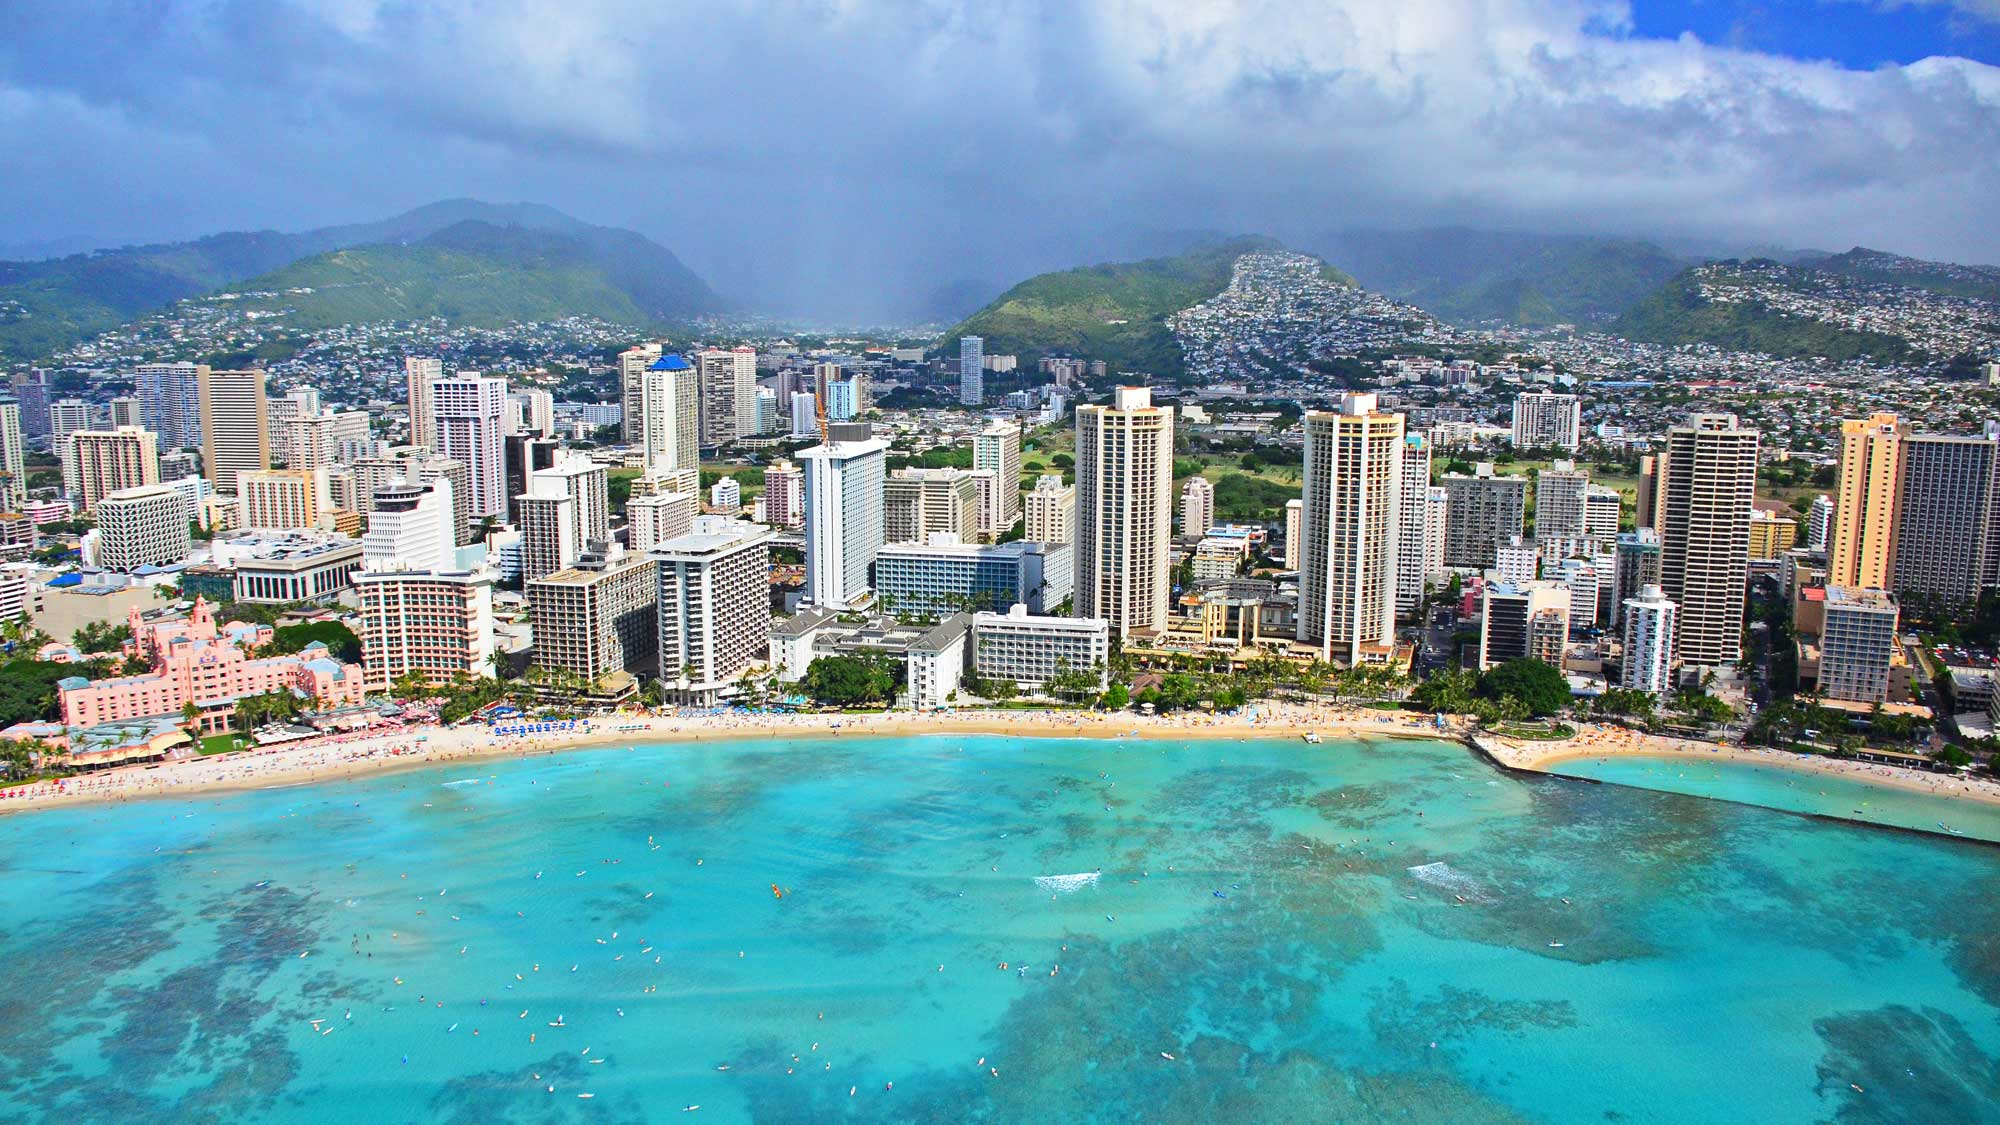
Waikiki, Honolulu, O'ahu. Photo by Edmund Garman (flickr, Creative Commons Attribution 2.0 Generic license, image resized).
Resources
Resources from the Paleontological Research Institution
Books
Zabel, I.H.H., D. Haas, and R.M. Ross. 2017. The Teacher-Friendly Guide to Climate Change. Paleontological Research Institution Special Publication 53, Ithaca, NY, 294 pp. Find updated, digital versions of the chapters of this book on Earth@Home Climate.
Allmon, W. D., T. A. Smrecak, and R. M. Ross. 2010. Climate change—past, present & future: a very short guide. Paleontological Research Institution Special Publication 38, Ithaca, NY, 200 pp.
Websites
Earth@Home Climate: https://climate.earthathome.org/
Earth@Home: Quick guides & FAQ: Climate and Energy: https://earthathome.org/quick-faqs/#climate
Earth@Home: Here on Earth: Introduction to Climate: https://earthathome.org/hoe/climate/