

Page Snapshot: Introduction to Earth hazards in the South-Central United States.
Contents
Topics covered on this page: Earthquakes; Landslides; Sinkholes; Radon; Floods; Sea level rise, coastal erosion, and subsidence; Weather hazards; Climate change; Resources.
Credits: Most of the text on this page comes from "Earth Hazards of the South Central US" by Sue Ellen Lyons and Robert M. Ross, chapter 10 in The Teacher-Friendly Guide to the Earth Science of the South Central US, edited by Mark D. Lucas, Robert M. Ross, and Andrielle N. Swaby (published in 2015 by the Paleontological Research Institution). The book was adapted for the web by Elizabeth J. Hermsen and Jonathan R. Hendricks in 2021–2022. Changes include formatting and revisions to the text and images. Credits for individual images are given in figure captions.
Updates: Page last updated June 22, 2022.
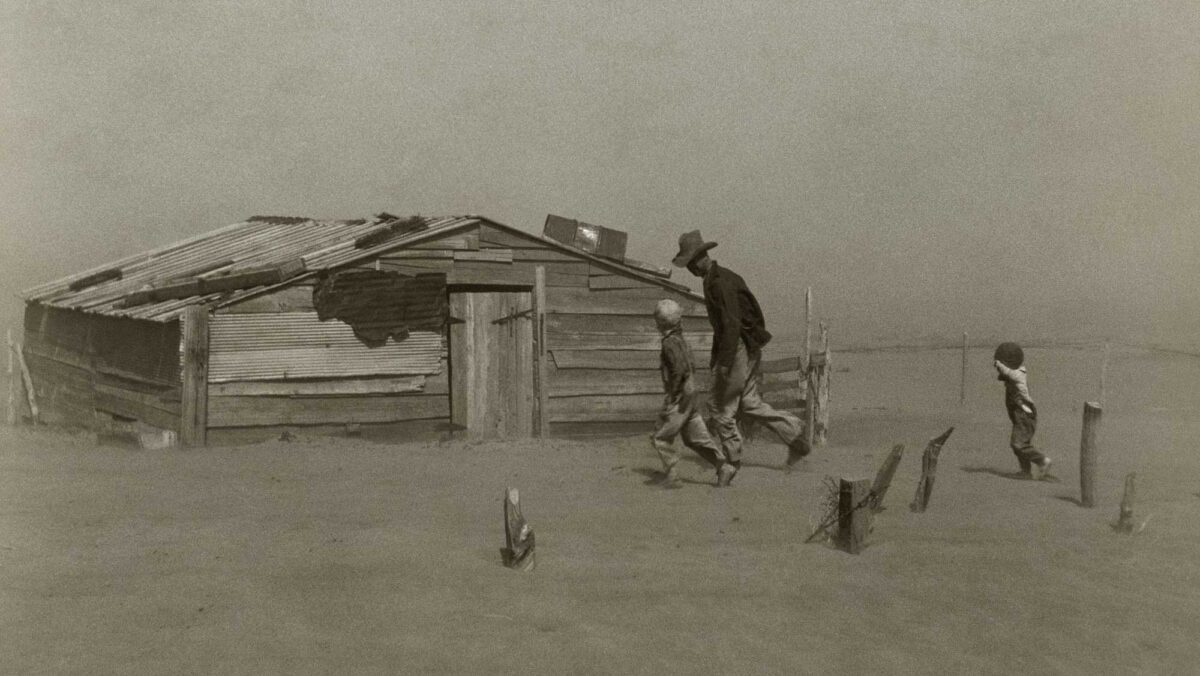
Image above: Iconic photograph by Arthur Rothstein of a father and his sons walking in a dust storm striking Cimarron County, Oklahoma in April 1936 (Wikimedia Commons; public domain).
Introduction
Natural hazards are events or processes that have significant impacts on human beings and the environment. Extreme weather conditions or geologic activity can cause substantial short-term or long-term changes to our environment. These changes can influence many aspects of the world around us, including crops, homes, infrastructure, and the atmosphere. The 4.6-billion- year-old Earth has experienced many naturally generated hazards, while other events are byproducts of human activities, created during mineral and energy extraction or in construction practices that modify the landscape.
The South-Central U.S. is subject to a variety of earth hazards. Most famously, the area happens to have just the right combination of conditions for tornados that cross the region and hurricanes that impact the Gulf Coastal Plain. Modifications of the Mississippi River and its mouth, as well as the Gulf coastline, have exacerbated the impacts of storms and floods. Limestone, gypsum, and salt deposits are responsible for significant areas of karst topography and sinkholes. Like many parts of the country, landslides from expansive soils and exposure to radioactivity from radon are present, depending upon the nature of the local bedrock. Perhaps most surprisingly, despite being far from a plate boundary, certain areas of the South Central are at risk from large earthquakes due to occasional movement along large ancient faults, and from smaller earthquakes associated with injection of wastewater into the Earth that promotes movement along smaller faults.
Earthquakes
Earthquakes have occurred in each of the South-Central states and the table below shows the magnitudes of some of the most notable earthquakes in the region.
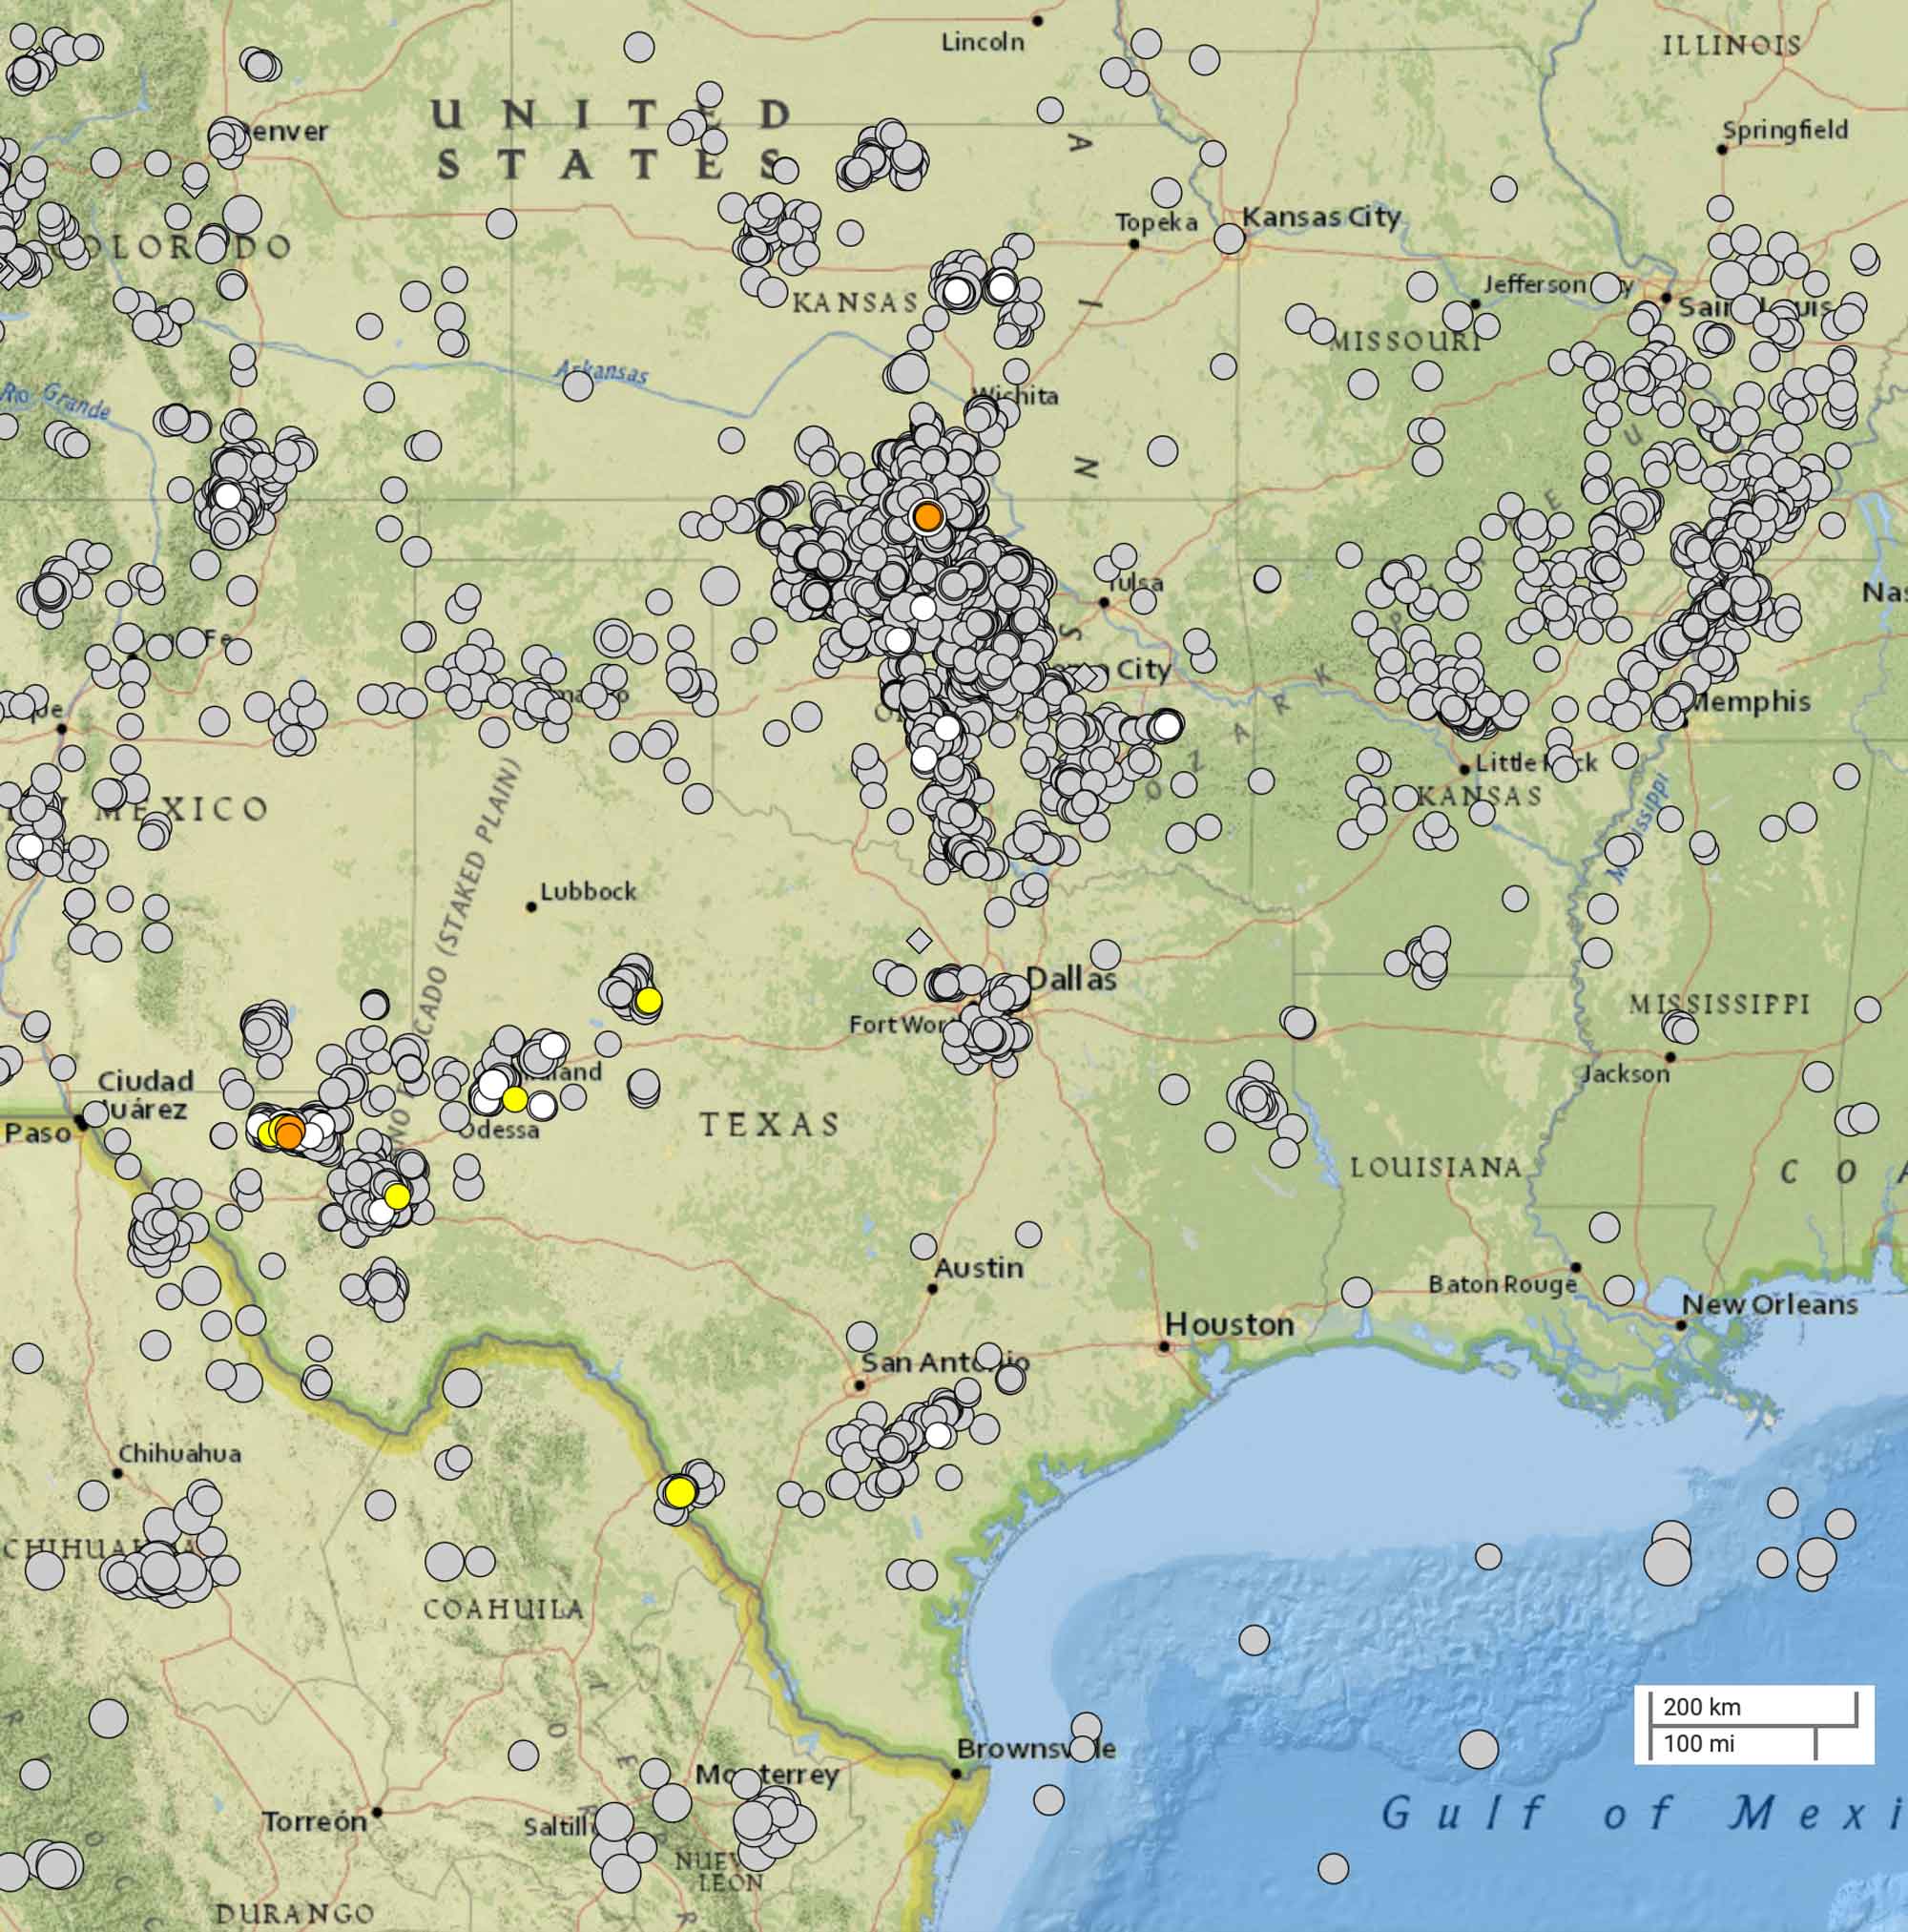
Major seismic zones of the South-Central United States, showing epicenters of all earthquakes of 2.5 or greater magnitude from the period of January 1, 1980 to February 22, 2022. Map created for the Earth@Home project using the USGS Earthquake Catalog (public domain).
Notable earthquakes of the South-Central United States.
| Date | Location | Magnitude (Mw) |
|---|---|---|
| Dec. 16, 1811 | Northeast Arkansas | 7.5 |
| Feb. 7, 1812 | New Madrid, Missouri | 7.4 |
| Jan. 23, 1812 | New Madrid, Missouri | 7.3 |
| Dec. 16, 1811 | Northeast Arkansas | 7.0 |
| Oct. 31, 1895 | Charleston, Missouri | 6.6 |
| Jan. 5, 1843 | Northeast Arkansas | 6.3 |
| Aug. 16, 1931 | Valentine, Texas | 6.0 |
| Nov. 6, 2011 | Shawnee, Oklahoma | 5.6 |
| Apr. 9, 1952 | El Reno, Oklahoma | 5.5 |
| Apr. 24, 1867 | Manhattan, Kansas | 5.1 |
| Oct. 19, 1930 | Napoleonville, Louisiana | 4.2 |
The greatest hazard potential is in the area of the New Madrid seismic zone (NMSZ), a 240-kilometer (150-mile) set of subsurface faults thought to have formed during the breakup of the supercontinent Rodinia in the late Precambrian (about 750 million years ago).
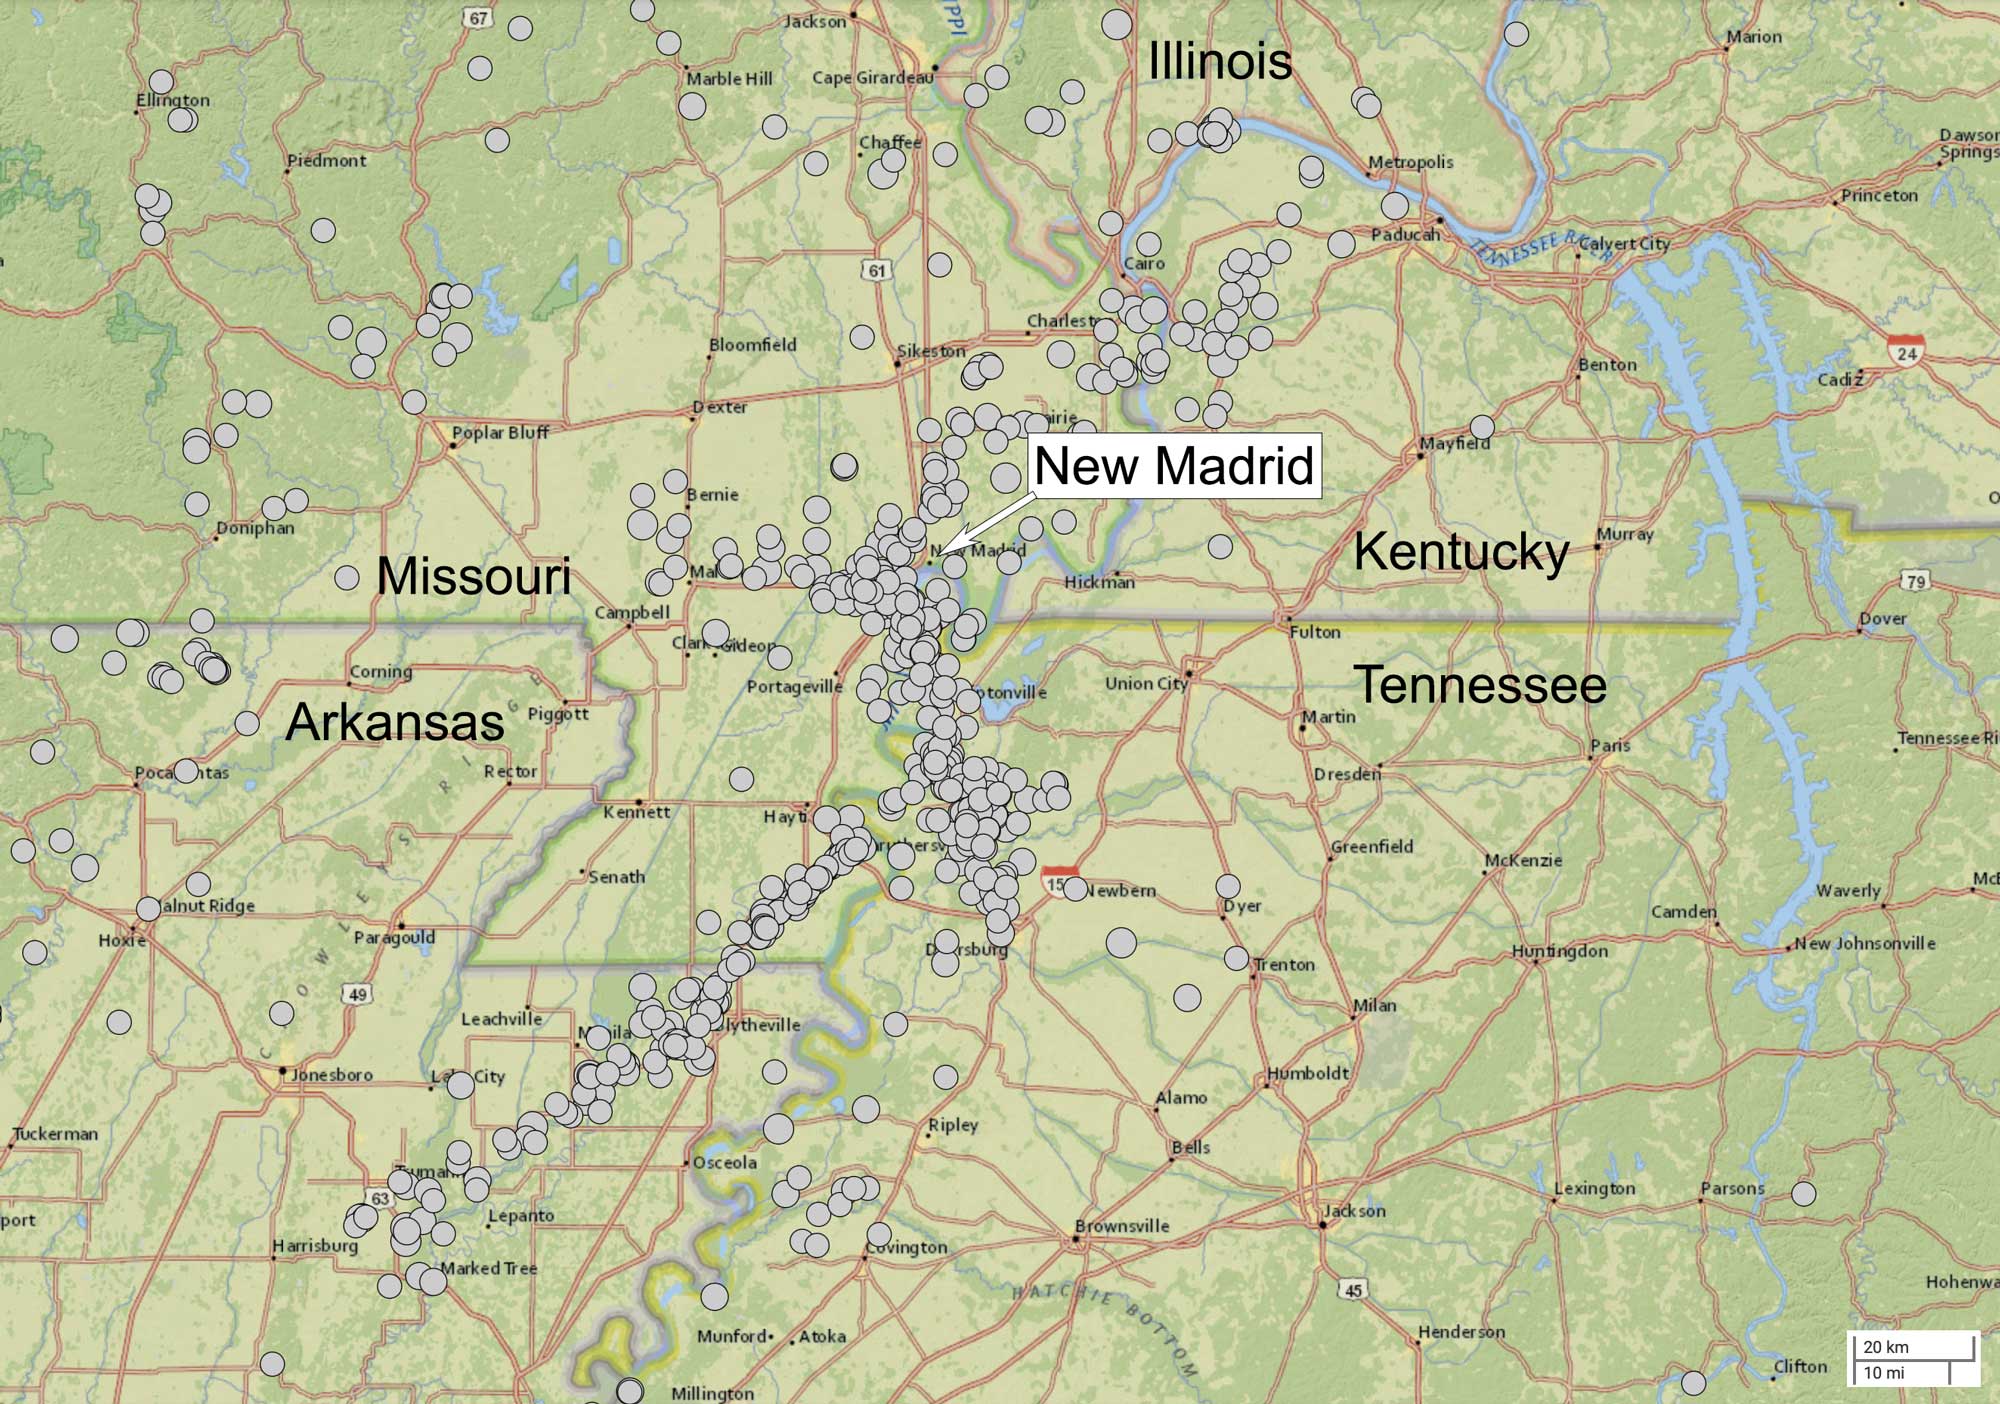
The epicenters of over 600 earthquakes of magnitude 2.5 or above recorded from the New Madrid seismic zone between the period of January 1, 1950 to February 22, 2022. Map created for the Earth@Home project using the USGS Earthquake Catalog (public domain).
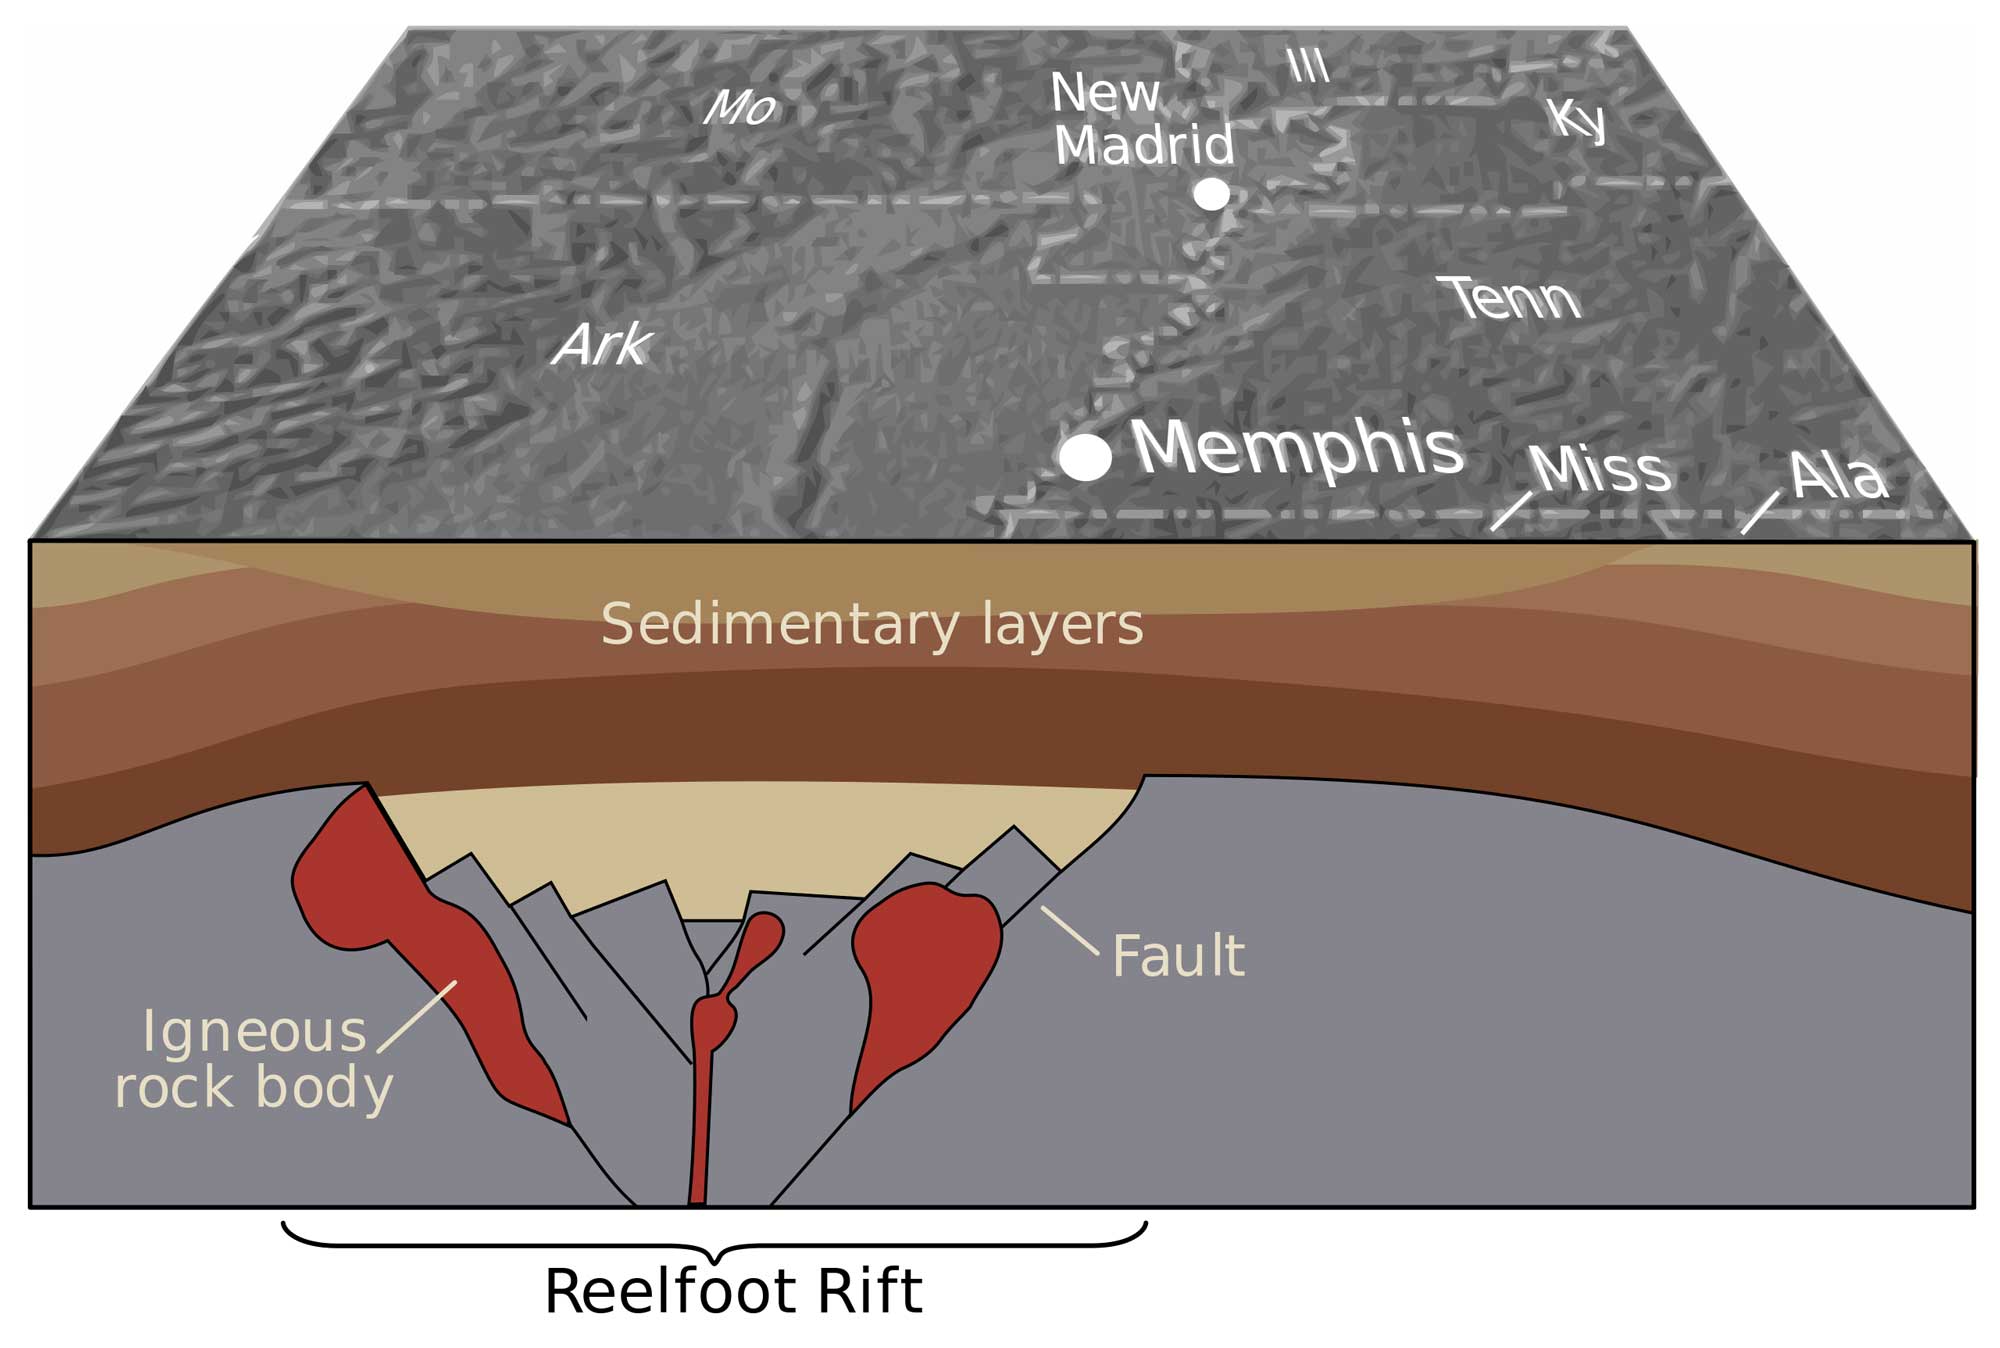
Cross section of the ancient Reelfoot Rift below the area around New Madrid, Missouri. Image by the USGS (Wikimedia Commons; public domain).
Although this rift did not split the continent, it remains an underground weak point. The bedrock that makes up most of the central U.S. is colder, drier, and less fractured than rocks on the East or West Coast. As a result, the earthquakes here can release the same amount of energy as other earthquakes, but the shaking affects a much larger area because the seismic waves travel through denser, more solid bedrock.
Four of the largest earthquakes in North American history—the New Madrid Sequence—occurred in the NMSZ on three days over a period of three months: December 16, 1811, January 23, 1812, and February 7, 1812. The quakes, with estimated magnitudes between 7.0 and 8.0, occurred along the Mississippi River in southeastern Missouri and northern Arkansas, and shook the Mississippi Valley and much of the eastern United States. The tremors destroyed buildings and warped the ground, causing landslides along the Mississippi River bluffs and ground subsidence brought on by soil liquefaction across the Mississippi River flood plain. Shaking was felt as far away as New Orleans and Boston, where it is said to have caused church bells to ring, and the waters of the Mississippi River appeared to flow backwards for several days due to local uplift and waves flowing upstream. Hundreds of aftershocks followed for a period of a several years, and were felt regularly until 1817.
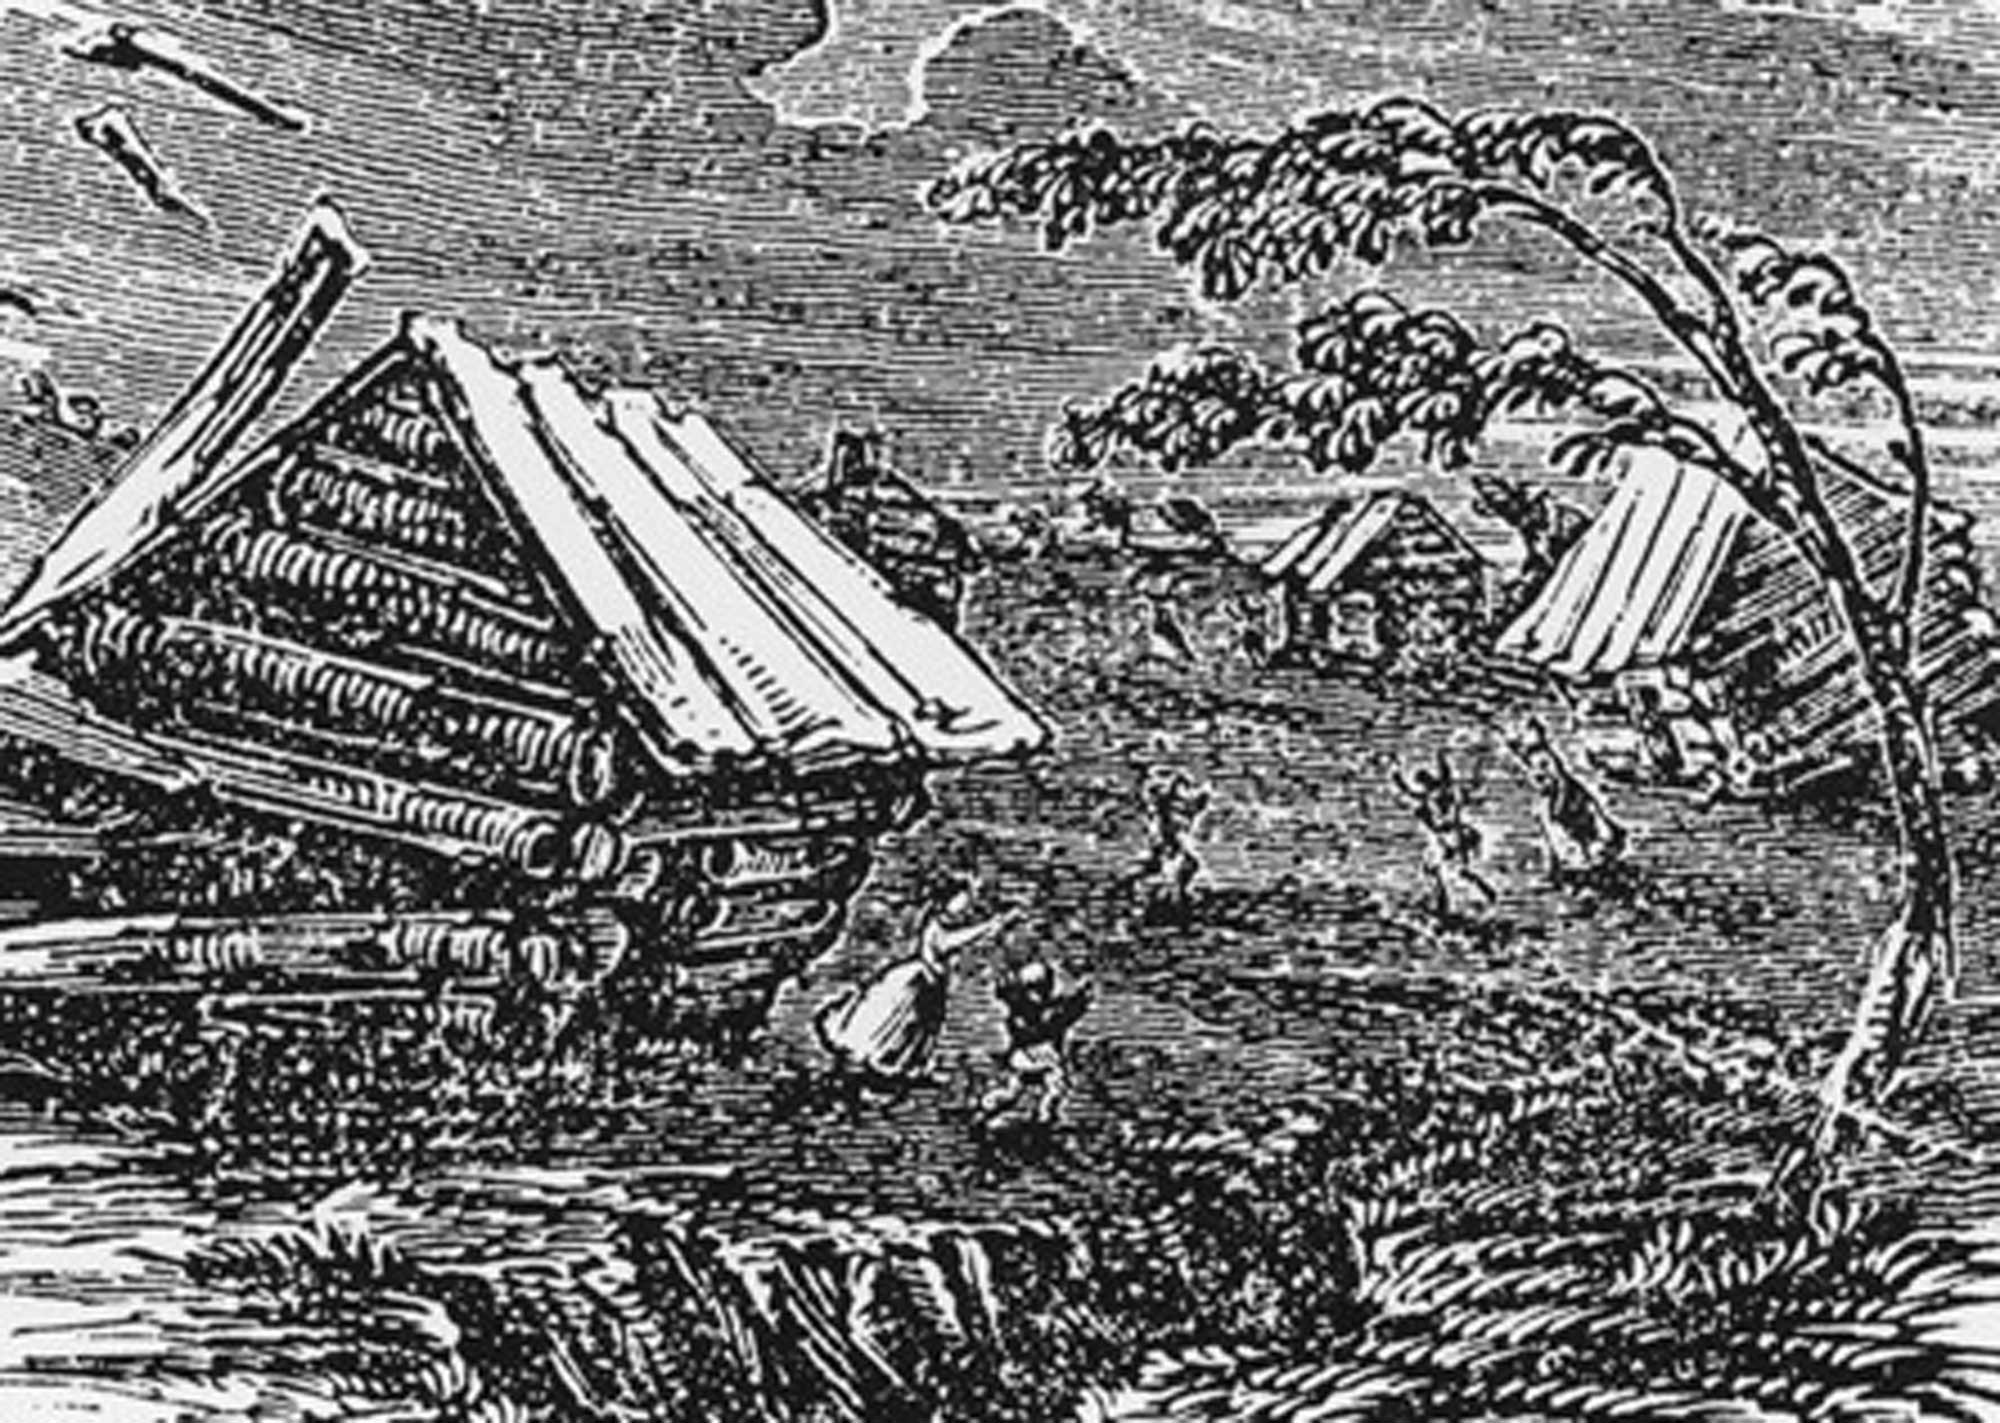
Historical depiction of the effects of the New Madrid earthquake. Artist unknown; illustration is from a 1851 book by Henry Howe (Wikimedia Commons; public domain).
The next largest quake to have occurred along the NMSZ was a 6.6-magnitude quake that occurred on October 31, 1895. The quake, centered in Charleston, Missouri, damaged almost every building in the city. Even today, areas in the NMSZ continue to experience earthquake activity, which is closely monitored by seismologists. There are ancient, seismically inactive subsurface faults in many other parts of the country, and it is unclear why seismic activity remains so high along the faults in the NMSZ, which are now far from North America’s plate margins. Most of the dozens of annual earthquakes that occur in the NMSZ are very small—too small to notice except with sensitive equipment.
If a major earthquake were to occur there, it could be expected to produce landslides, fissures, soil liquefaction, and bridge and road failures. Interstate 55 in Arkansas could become impassable; flooding of farmland could contaminate rivers and streams with mud, sand and agricultural chemicals; and the failure of levees and riverbanks could make the Mississippi River and its tributaries difficult to navigate for many weeks.
Another area that presents modest seismic risk is the Nemaha Uplift in northern Oklahoma and eastern Kansas.
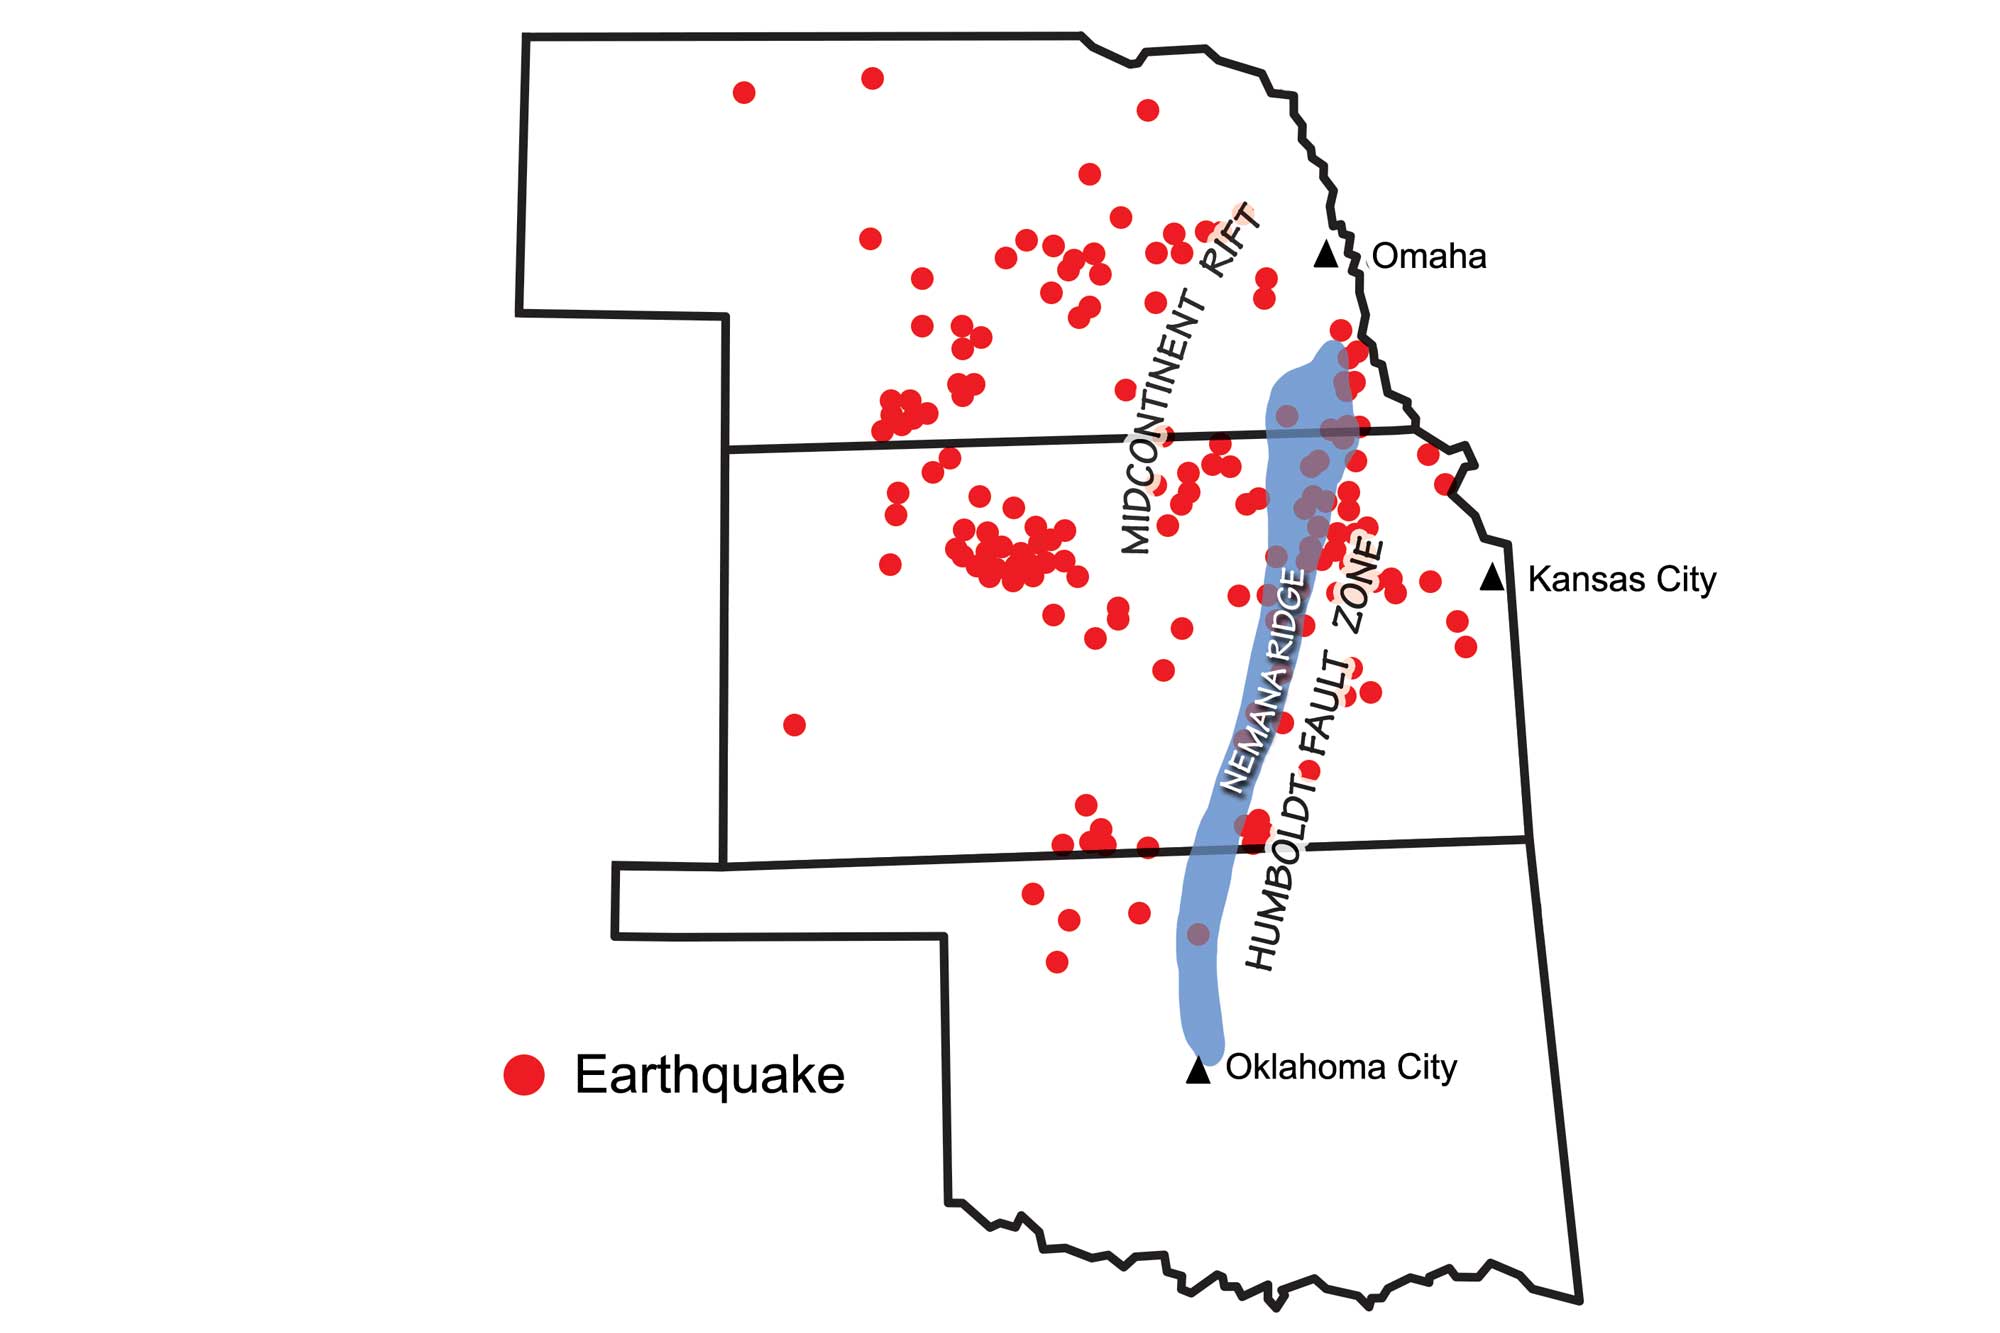
Earthquakes recorded between 1977 and 1989, with Richter magnitudes from 0.8 to 4.0, relative to the position of the Nemaha Uplift and Humboldt fault zone. Image modified from original by Wade Greenberg-Brand, in turn adapted from images by the Kansas Geological Survey.
The seismic activity around the Nemaha Uplift is associated with faulting known as the Humboldt fault zone, which, like the NMSZ, lies along a Precambrian basement and ancient rift system.
Recently, Oklahoma has experienced an unusual amount of earthquake activity, with numerous earthquakes of magnitude 3 or 4 and a few above magnitude 5.
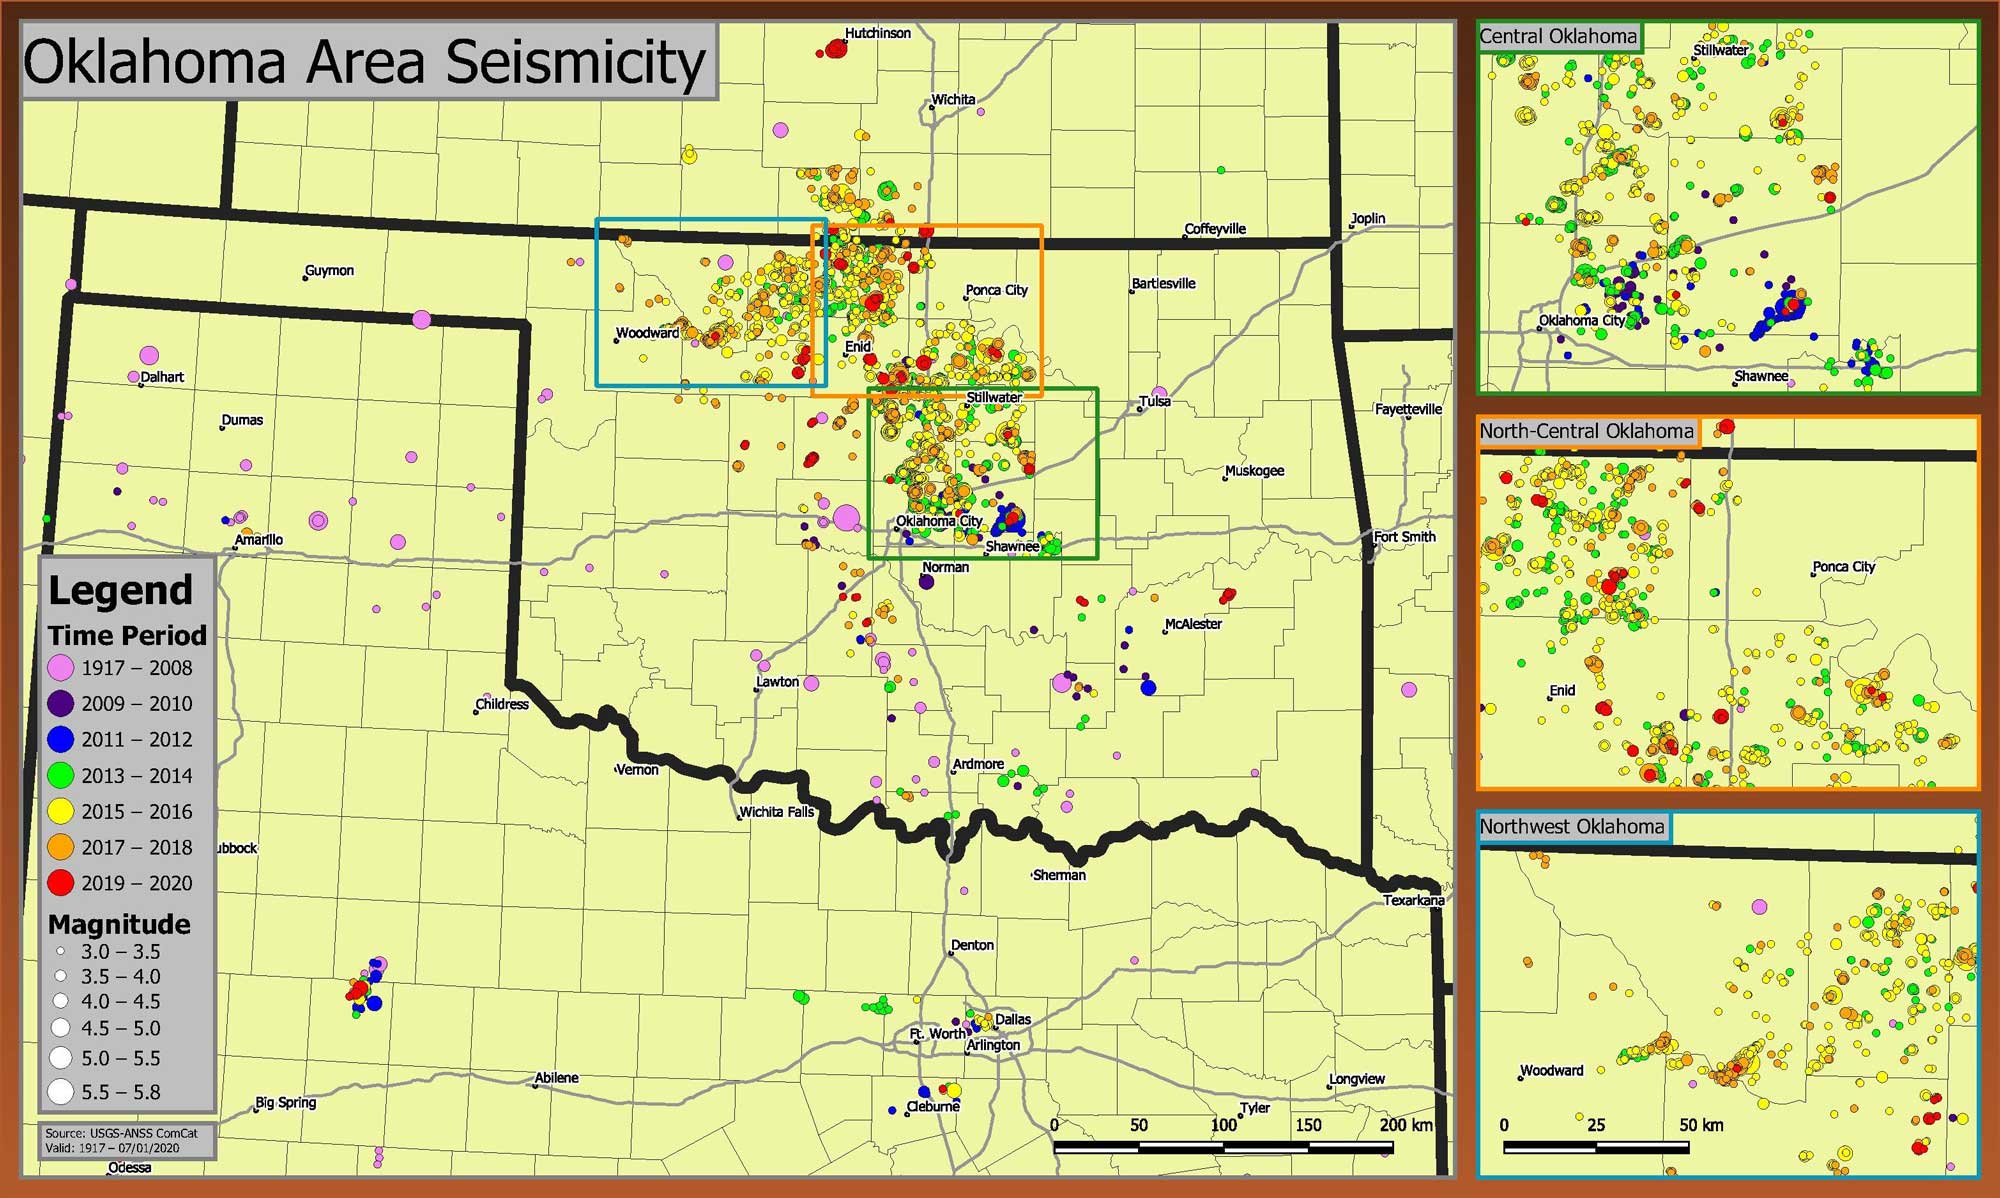
Seismic activity in Oklahoma from 1917 to 2020. Greatly increased seismic activity in recent years has been linked to injection wells. Image by "Master of Time" (Wikimedia Commons; Creative Commons Attribution-Share Alike 4.0 International license).
Only 89 earthquakes occurred in the state between 1970 and 2009, but since then the incidence has increased dramatically, rising from 48 earthquakes in 2010 to 611 in 2014 alone. The seismic activity in these instances has been linked to the high-pressure injection of wastewater from oil and gas extraction operations into the ground. The pressure of the water increases the likelihood that a rupture might occur along an otherwise locked fault. Concerns exist that additional activity along offshoot faults from the Nemaha Uplift near Oklahoma City might be even more serious. Similar instances of induced seismic activity have occurred elsewhere in the South Central, perhaps most famously with cases associated with injection wells near Dallas-Fort Worth. These wells have been used to dispose of wastewater from the extraction of natural gas in the Barnett Shale.
Networks of seismograph stations have improved geologists’ ability to detect and accurately locate earthquake hazards, and specific fault zones are being studied throughout the South Central.
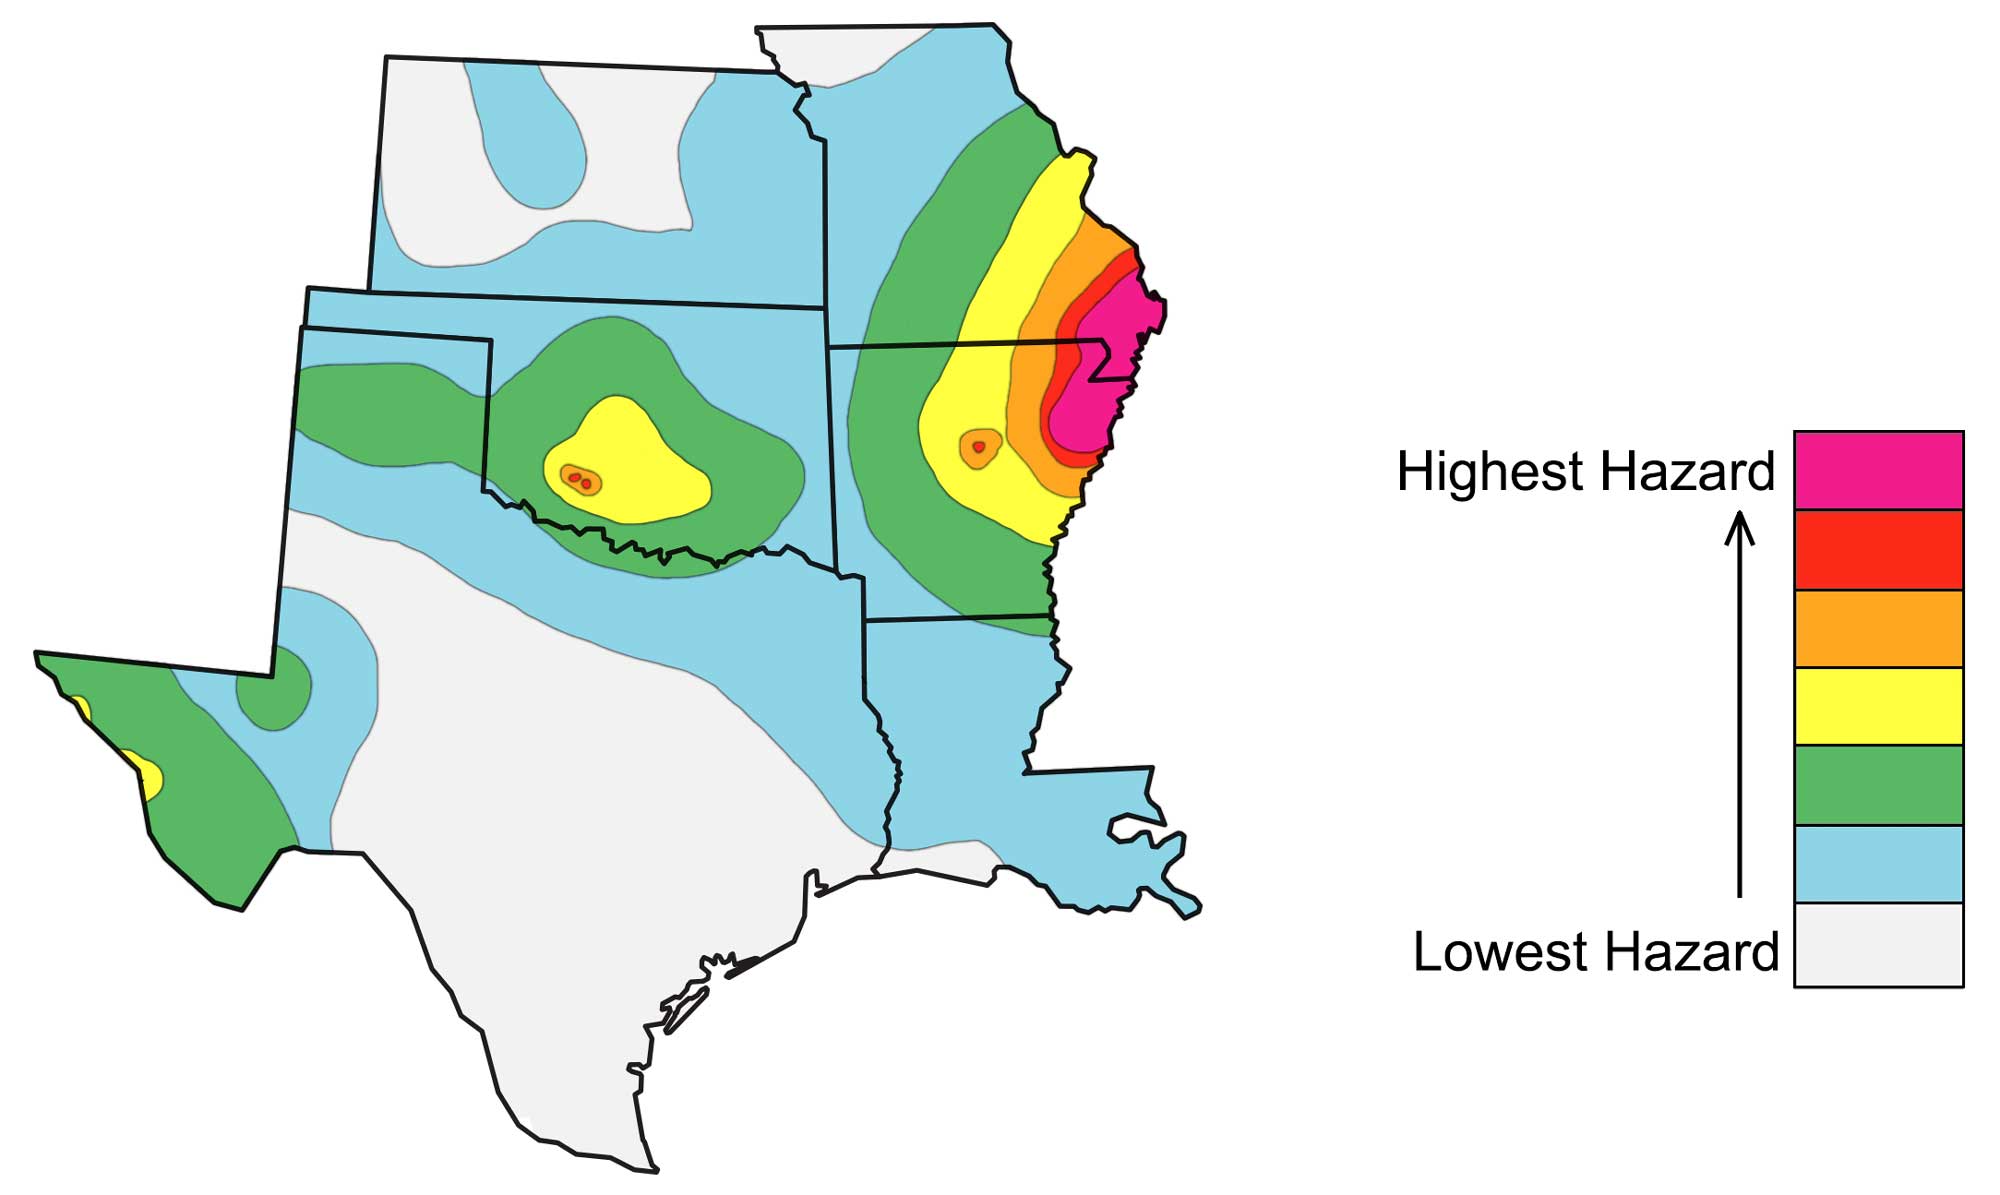
Seismic hazard map of the South Central US, based on data in 2014. Image adapted from original by the USGS (public domain).
This information on earthquake risk can lead to better designs for high-risk infrastructure like dams, high-rise buildings, and power plants—and it can also be used to inform the public of potential hazards to lives and property.
Landslides
Landslides and slumps are common problems in parts of the South Central that have a wetter climate and/or the presence of steep slopes, such as west Texas, the Central Lowland, and the Interior Highlands, but they can also occur in areas with low relief.
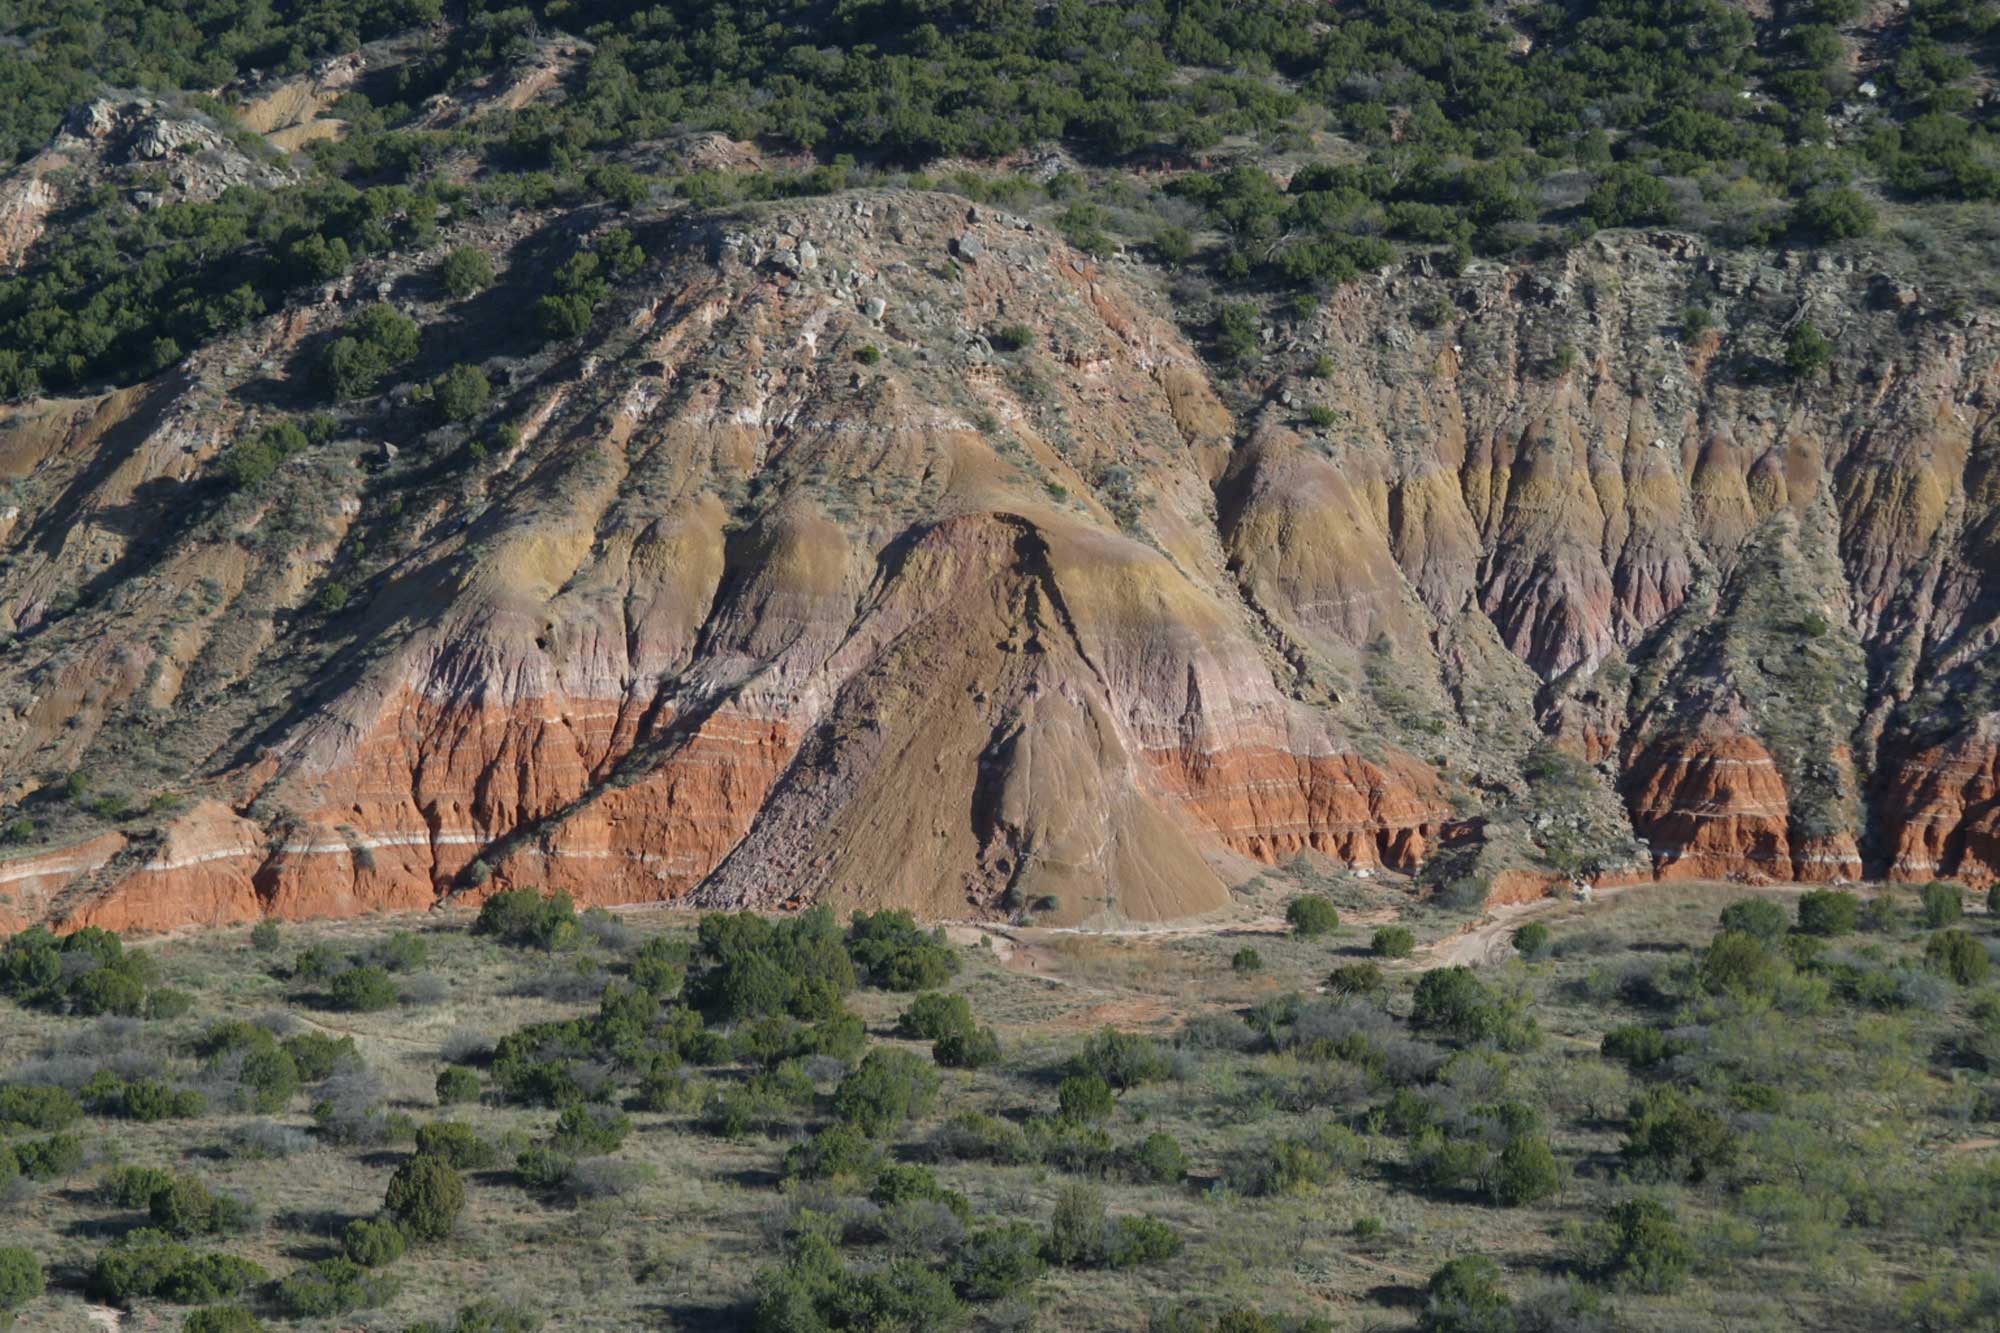
A landslide on the steep walls of Palo Duro Canyon in West Texas. Photograph by "Leaflet" (Wikimedia Commons; Creative Commons Attribution-Share Alike 3.0 Unported license).
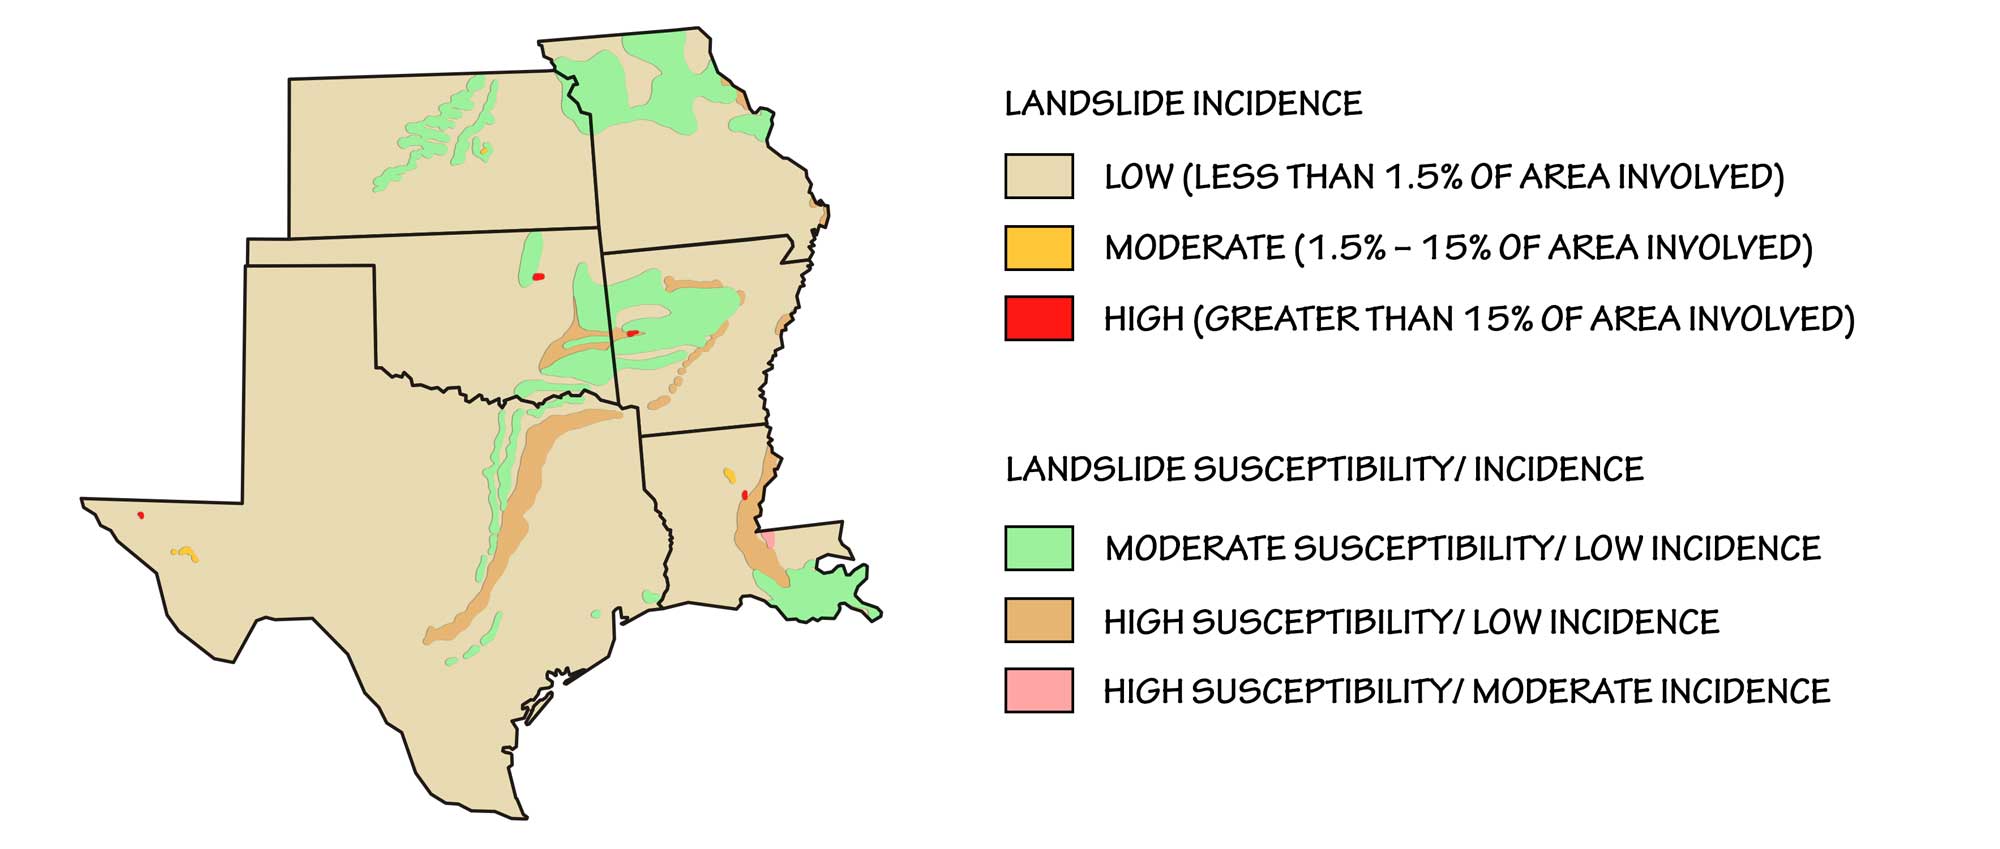
Landslide incidence and risk in the South-Central United States. Image adapted from original by the USGS (public domain).
Heavy rain, snowmelt, groundwater percolation, and water level changes along coastlines, earthen dams, and the banks of water bodies are conditions under which landslides can occur. These flood-related conditions are associated with precipitation, runoff, and saturation of the ground. Hazards occur from mudflows themselves, but also from backwater flooding, dam failure, and debris that rushes downstream and causes further erosion.
In northern Arkansas, there is a risk of potential landslides associated with earthquakes in the New Madrid seismic zone. Steep slopes in this area increase the likelihood that landslides will occur when the ground shakes or when water rapidly infiltrates the soil during an earthquake, though, as mentioned earlier, steep slopes are not always necessary for a landslide to occur. In low-lying areas of the Coastal Plain, saturated soils and heavy rains can combine to cause soil liquefaction, which can result in laterally moving mudslides. This can be triggered by storm runoff or by rapid earth movement during an earthquake.
Soils that weather from shale, volcanic ash, or bentonite are rich in clay, which may contain minerals that can absorb water and swell up to 1.5 to 2 times their original volume. That amount of expansion can exert enough force to cause damage, such as cracked foundations, floors, and basement walls. An estimated nine billion dollars of damage to infrastructure built on expansive clays occurs each year in the United States.
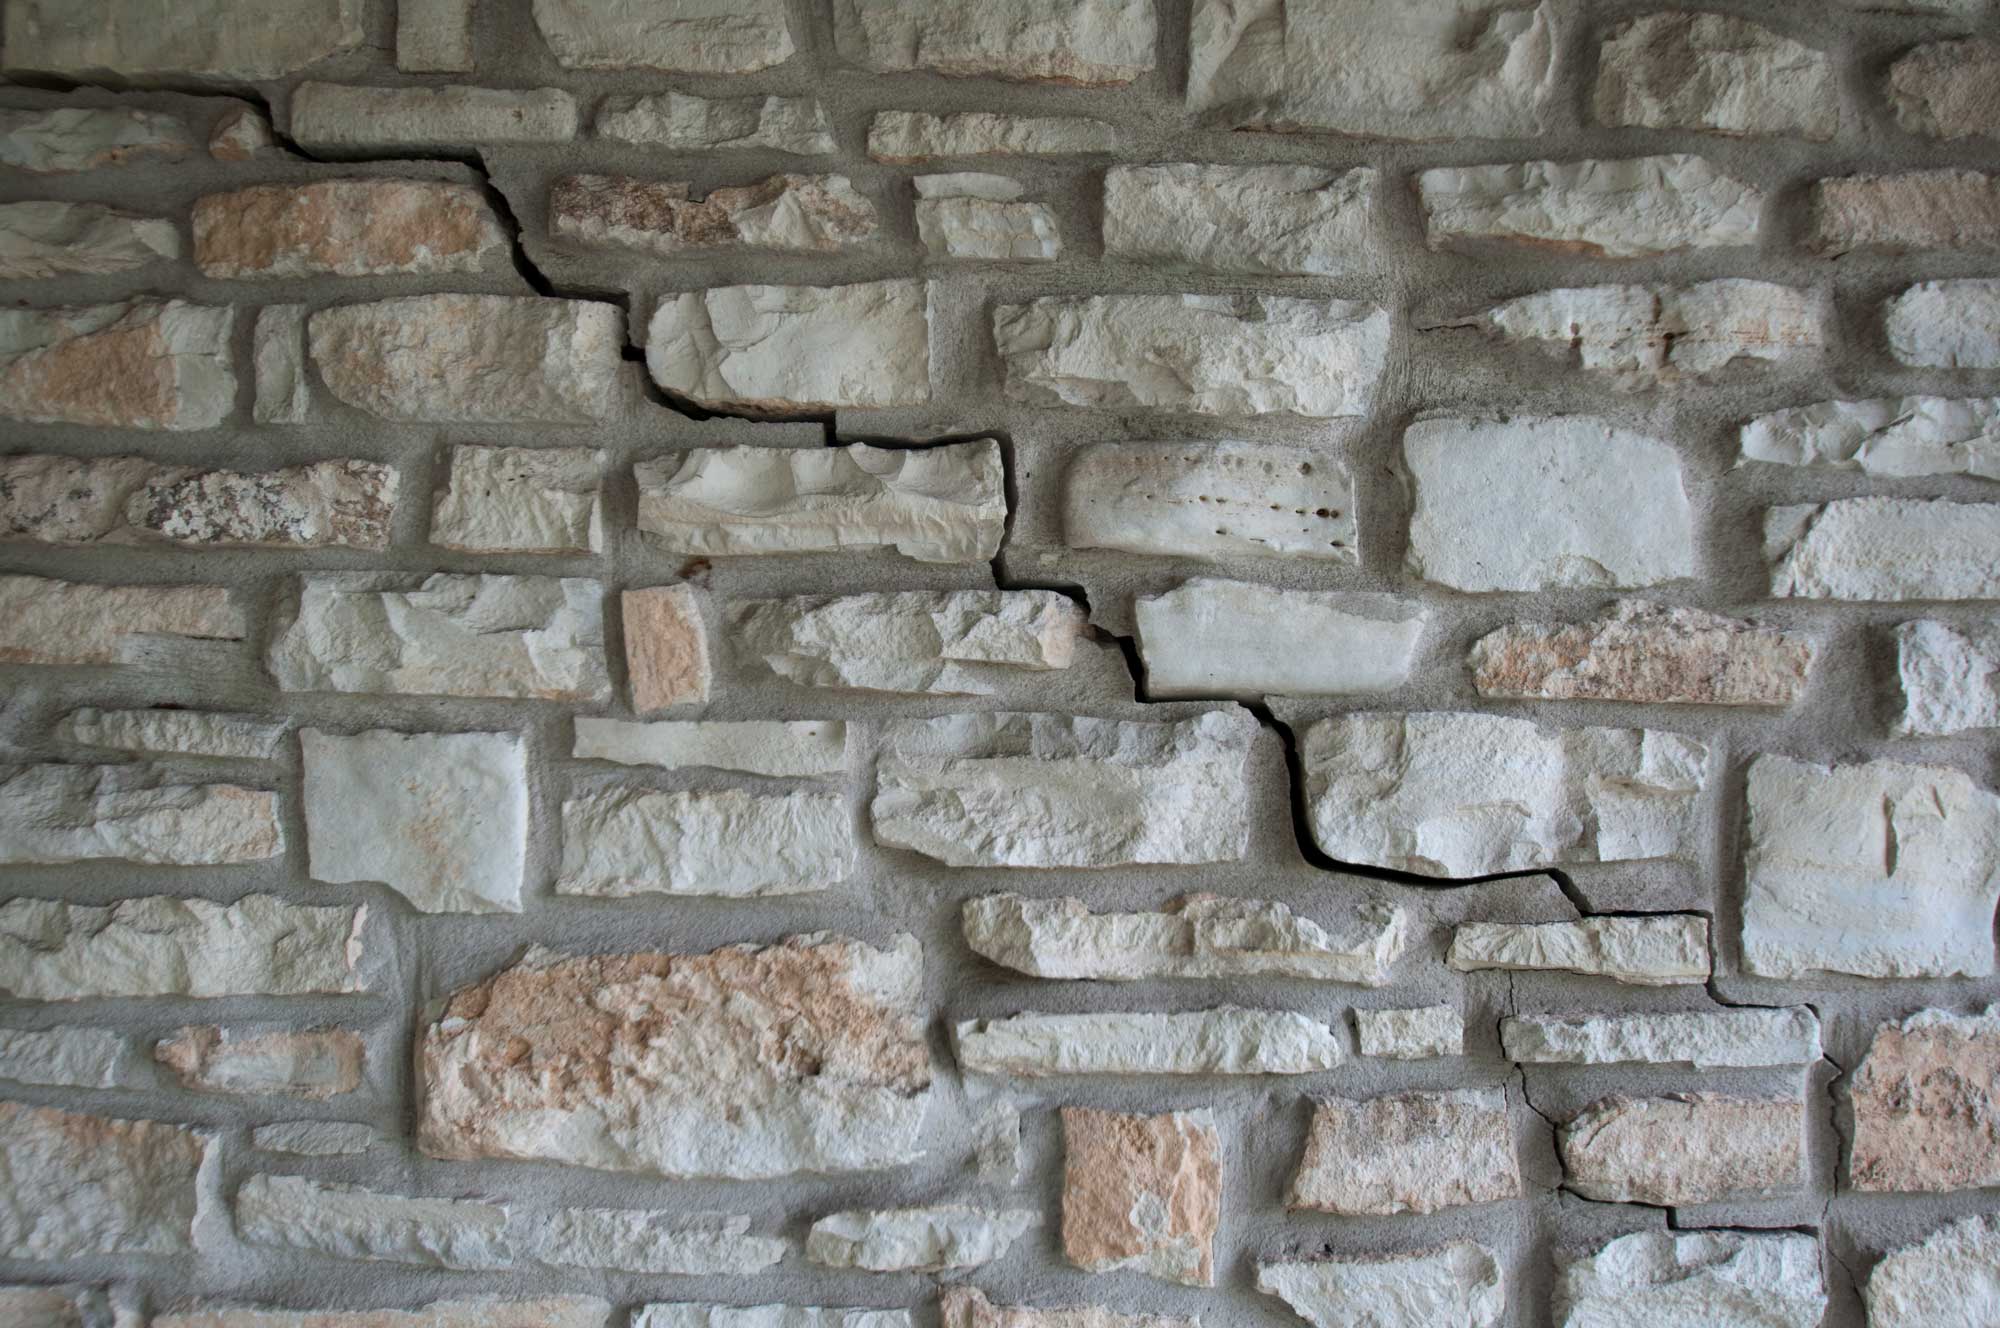
Expansive soils caused cracks to form in the wall of this house in Austin, Texas. Photograph by Ryan Joy (Flickr; Creative Commons BY-NC-SA 2.0 Generic license).
Soil creep is a slow kind of landslide that occurs when certain types of clay in the soil on a hillside absorb water, expanding and causing the soil to swell. As the clay dries and contracts, the particles settle slightly in the downhill direction. This process can cause fences and telephone poles to lean downhill, while trees adjust by bending uphill.
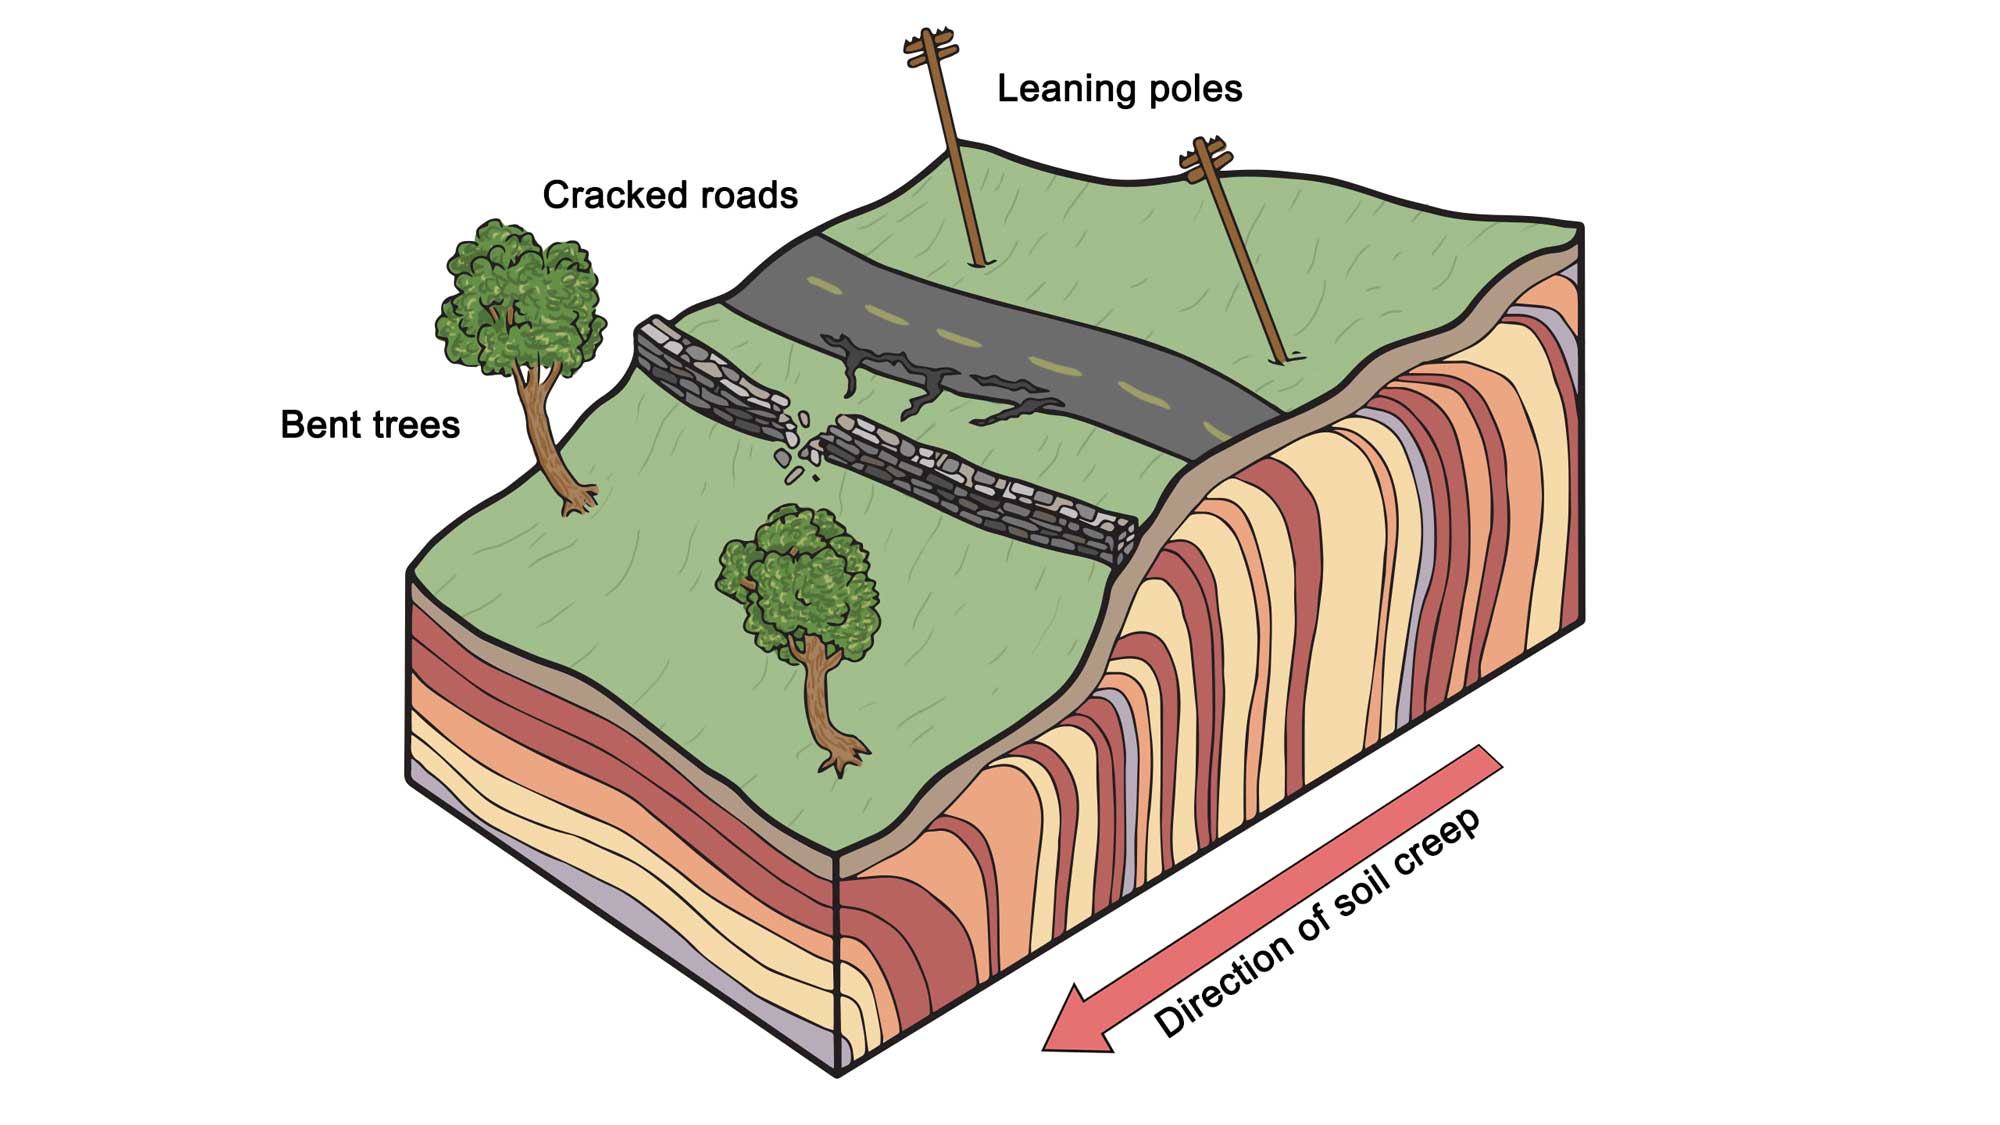
Some of the effects of soil creep on surface topography and structures. Note that subsurface colored layers are meant to depict movement, not stratigraphic layering of soil. Modifed from original by Wade Greenberg-Grand for the Earth@Home project.
While soils can swell by absorbing water, they will also shrink when they dry out, resulting in subsidence that damages landforms and infrastructure. Fissures may develop in the soil, allowing for the deep penetration of water when floods or runoff occurs. This produces a cycle of shrinkage and swelling that puts repeated stress on rock layers and human structures. While expansive soils can be found all over the US, every state in the South Central has bedrock units or soil layers that are possible sources, with Louisiana’s coastal plain and Oklahoma’s Cretaceous shales being the most susceptible.
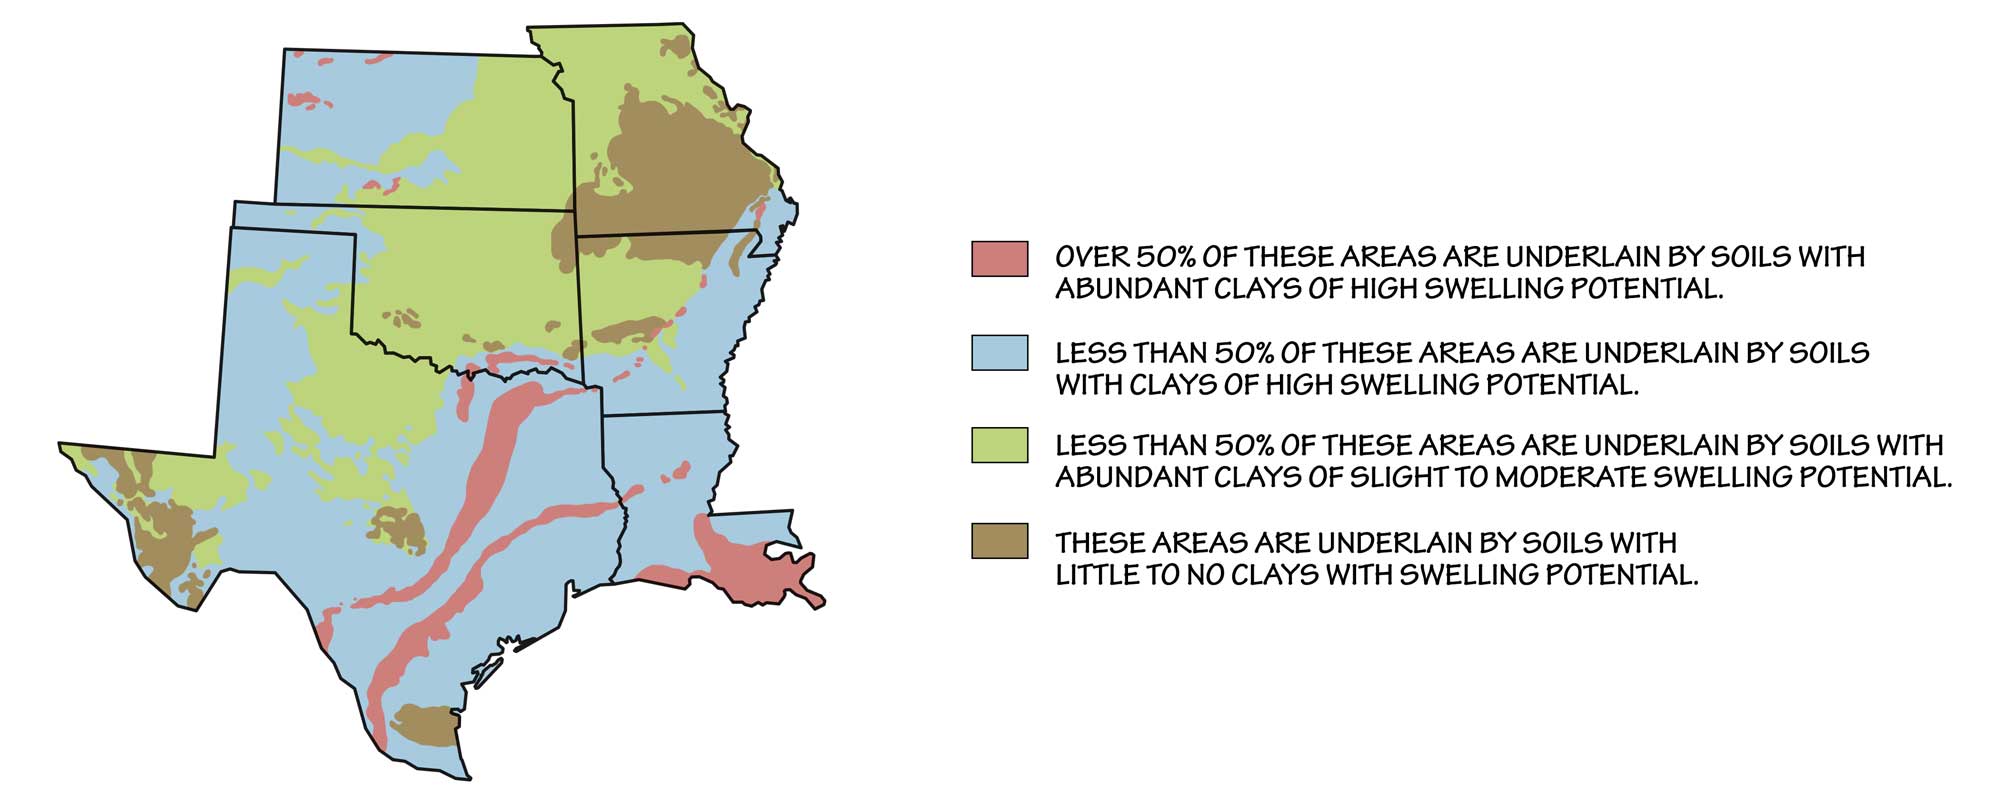
Approximate distribution of expansive soils in the South Central US. This map is based on the distribution of types of bedrock, which are the origin of soils produced in place. (Where substantial fractions of the soil have been transported by wind, water, or ice, the map will not be as accurate.) Image modified from original by the USGS (public domain).
Significant or repeated changes in moisture, which can occur in concert with other geologic hazards such as earthquakes, floods, or landslides, greatly increase the hazard potential of expansive soils. The key to reducing this hazard is to keep the water content of the soil constant. There are also chemical stabilizers, including lime, potassium, and ionic agents, that can reduce the potential for soil volume changes by increasing the clay’s structural stability.
Karst and sinkholes
Much of the South Central is underlain by karst and carbonates. Central and southern Missouri, including the Ozark Mountains and their extensions into northern Arkansas and northeastern Oklahoma, are famous for caves and karst in Ordovician and Carboniferous limestone and dolomite. Missouri is home to over 6000 limestone caverns, many of which are prominent tourist attractions.
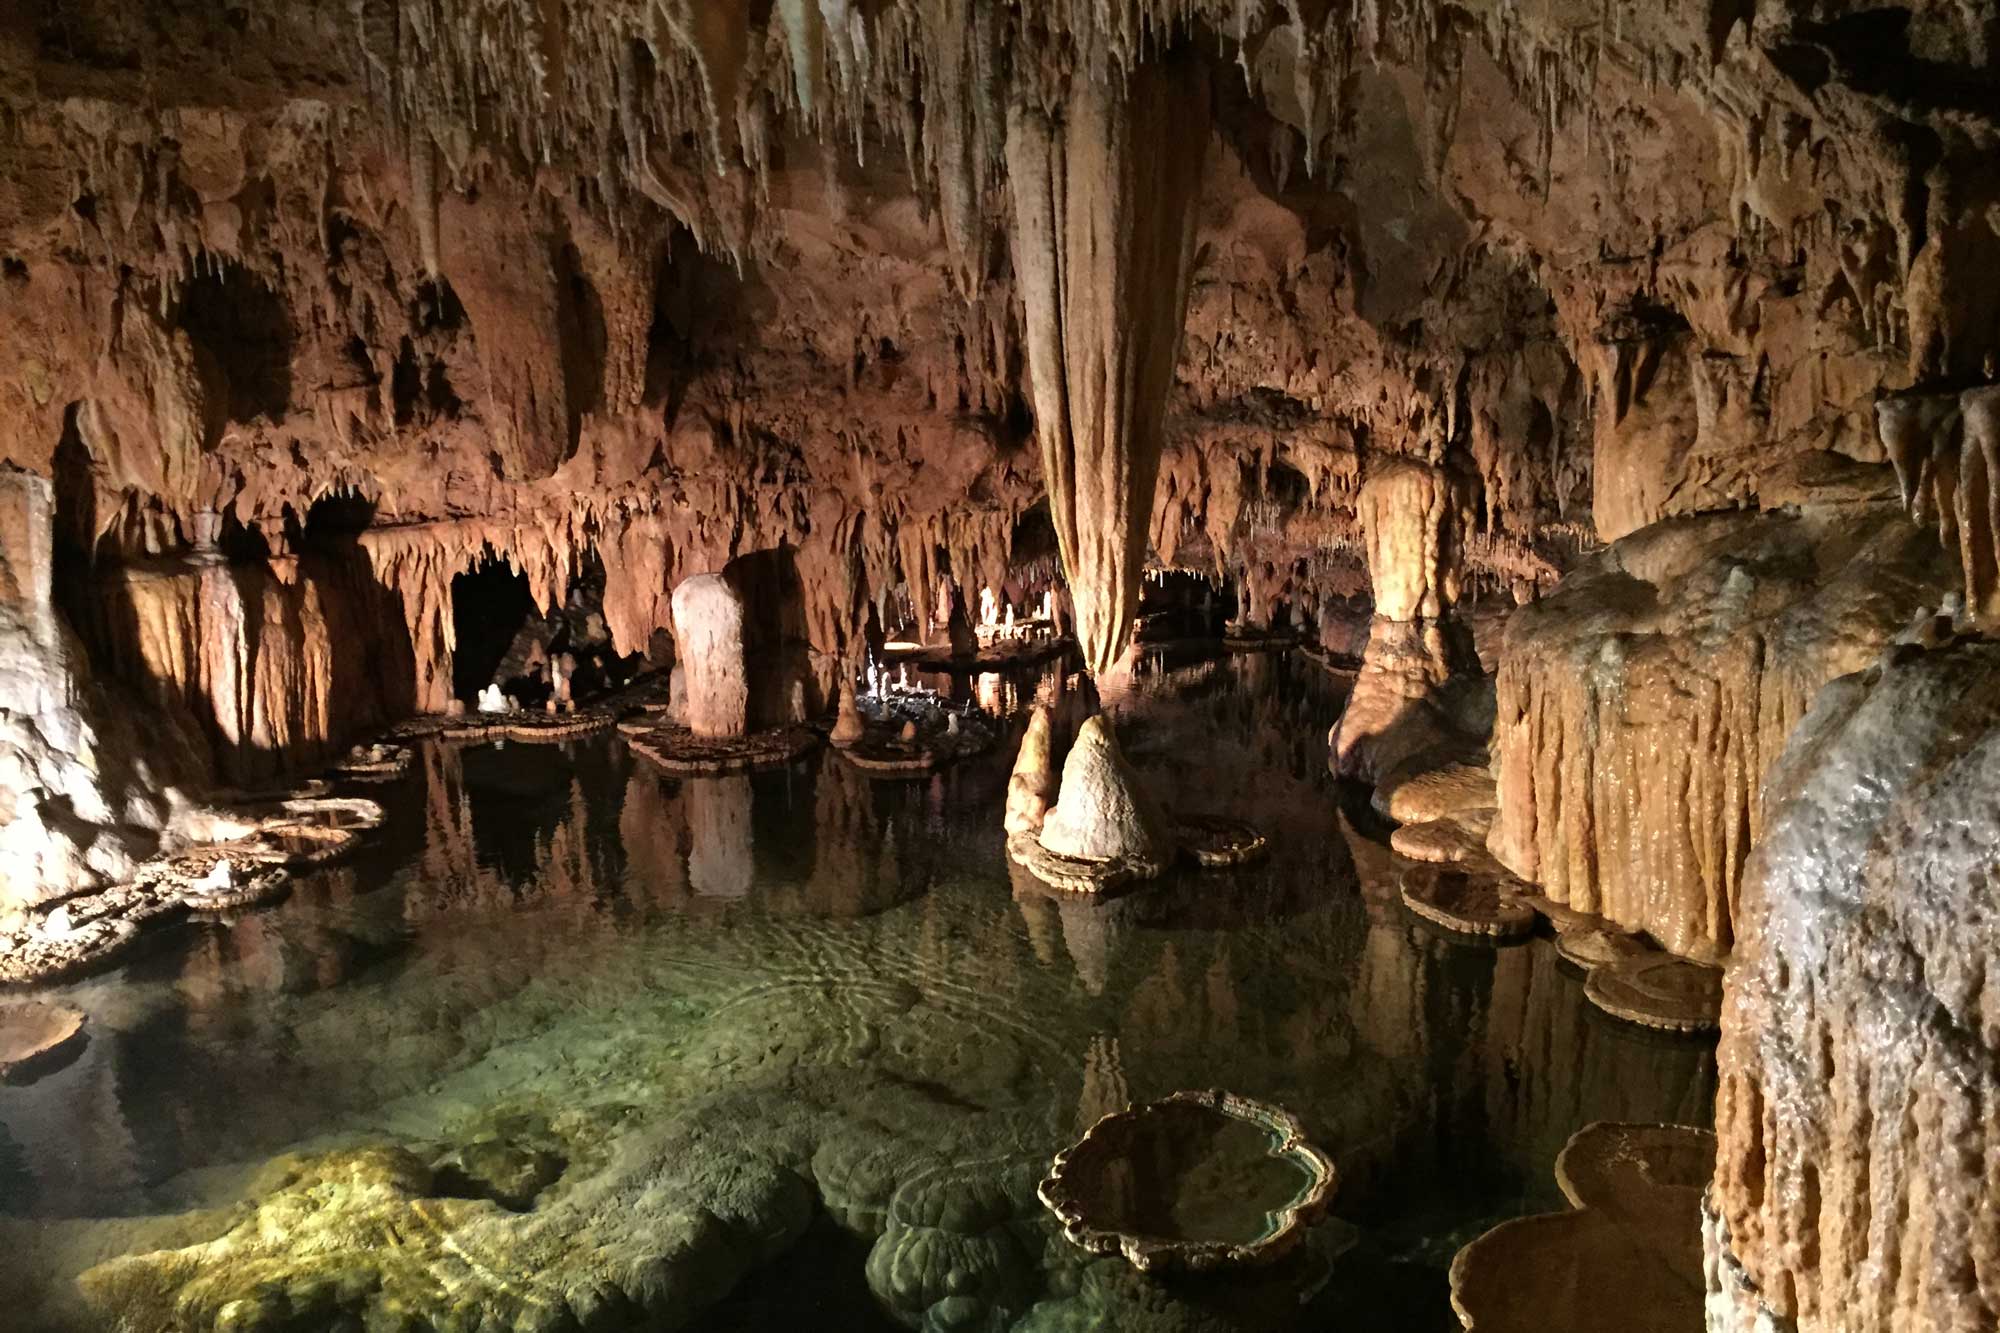
A cavern inside of Onondaga Cave State Park, Missouri. Photograph by Jonathan R. Hendricks.
In Missouri, karst is also associated with exceptionally large springs such as Big Spring, Greer Spring, and Maramec Spring.
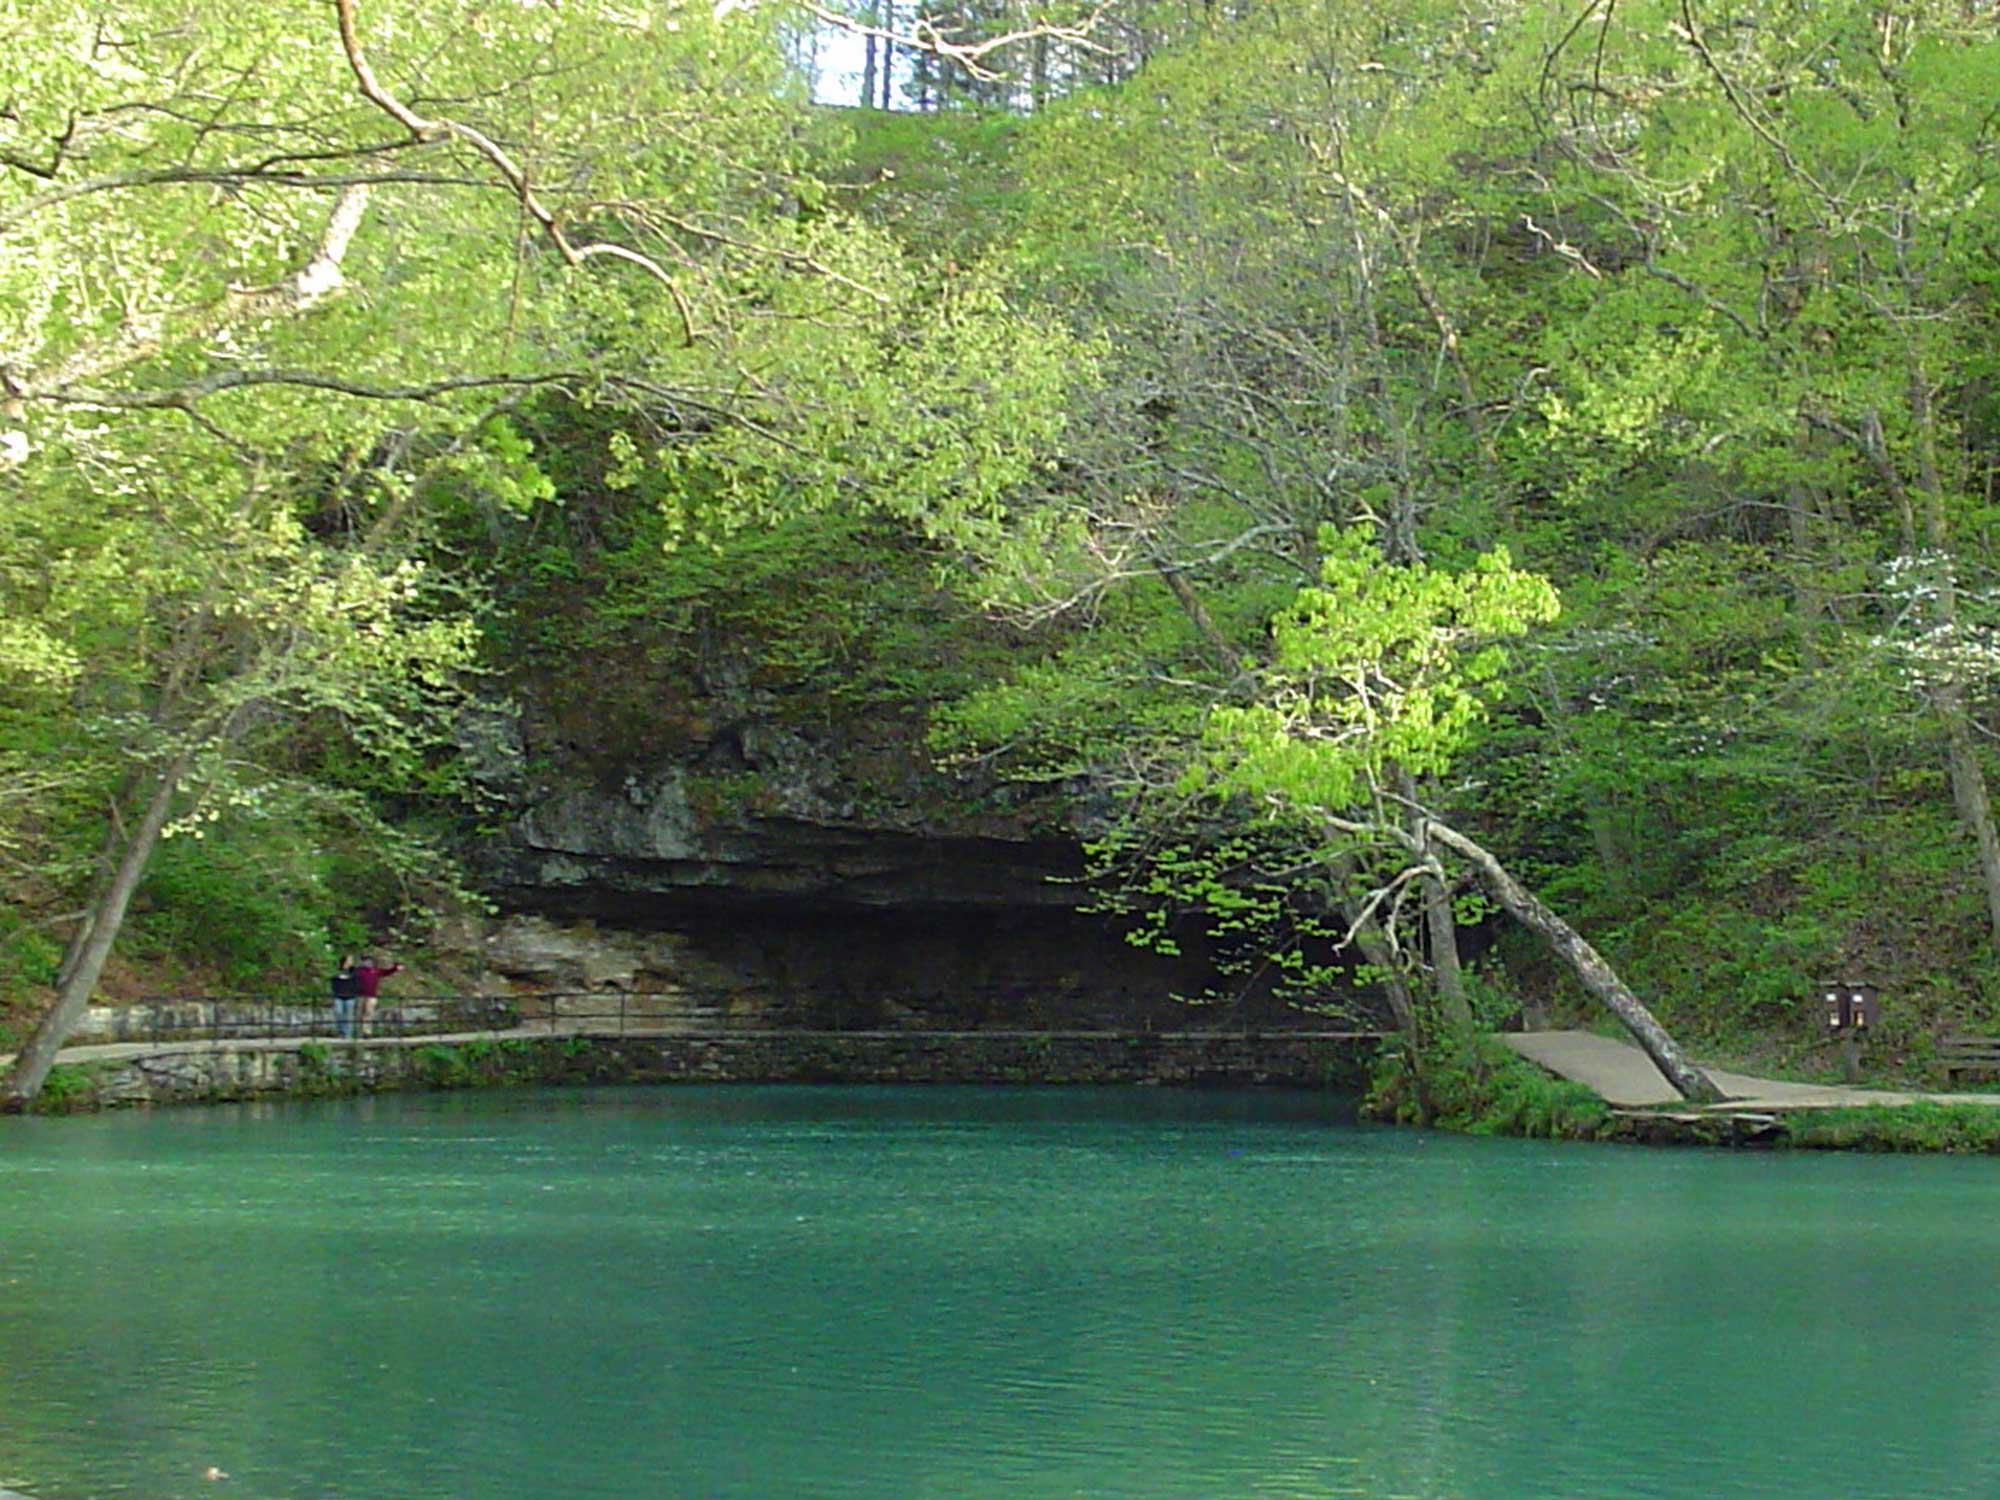
Maramec Spring, located in the east-central Ozarks, has an average daily discharge of 360 million liters (100 million gallons) of water. The spring’s opening is underwater, at the base of the dolomite overhang. Photograph by "Kbh3rd" (Wikimedia Commons; public domain).
Other karst formations are found in the Arbuckle Mountains of south central Oklahoma and the Limestone Hills in southwestern Oklahoma. Soluble gypsum and salt deposits near the surface in western Oklahoma and the Texas panhandle can also cause karst and dissolution problems.
Because karst terrain is very porous and fractures easily, groundwater pollution can be a serious problem. Contaminants that might otherwise be filtered through the sedimentary rock are quickly transported into aquifers by runoff. The hazards of pollution are increased by rampant industrial, agricultural, and residential development over karst features. This is occurring rapidly in northwest Arkansas and in Missouri, where 59% of the state sits atop thick layers of carbonate rock.
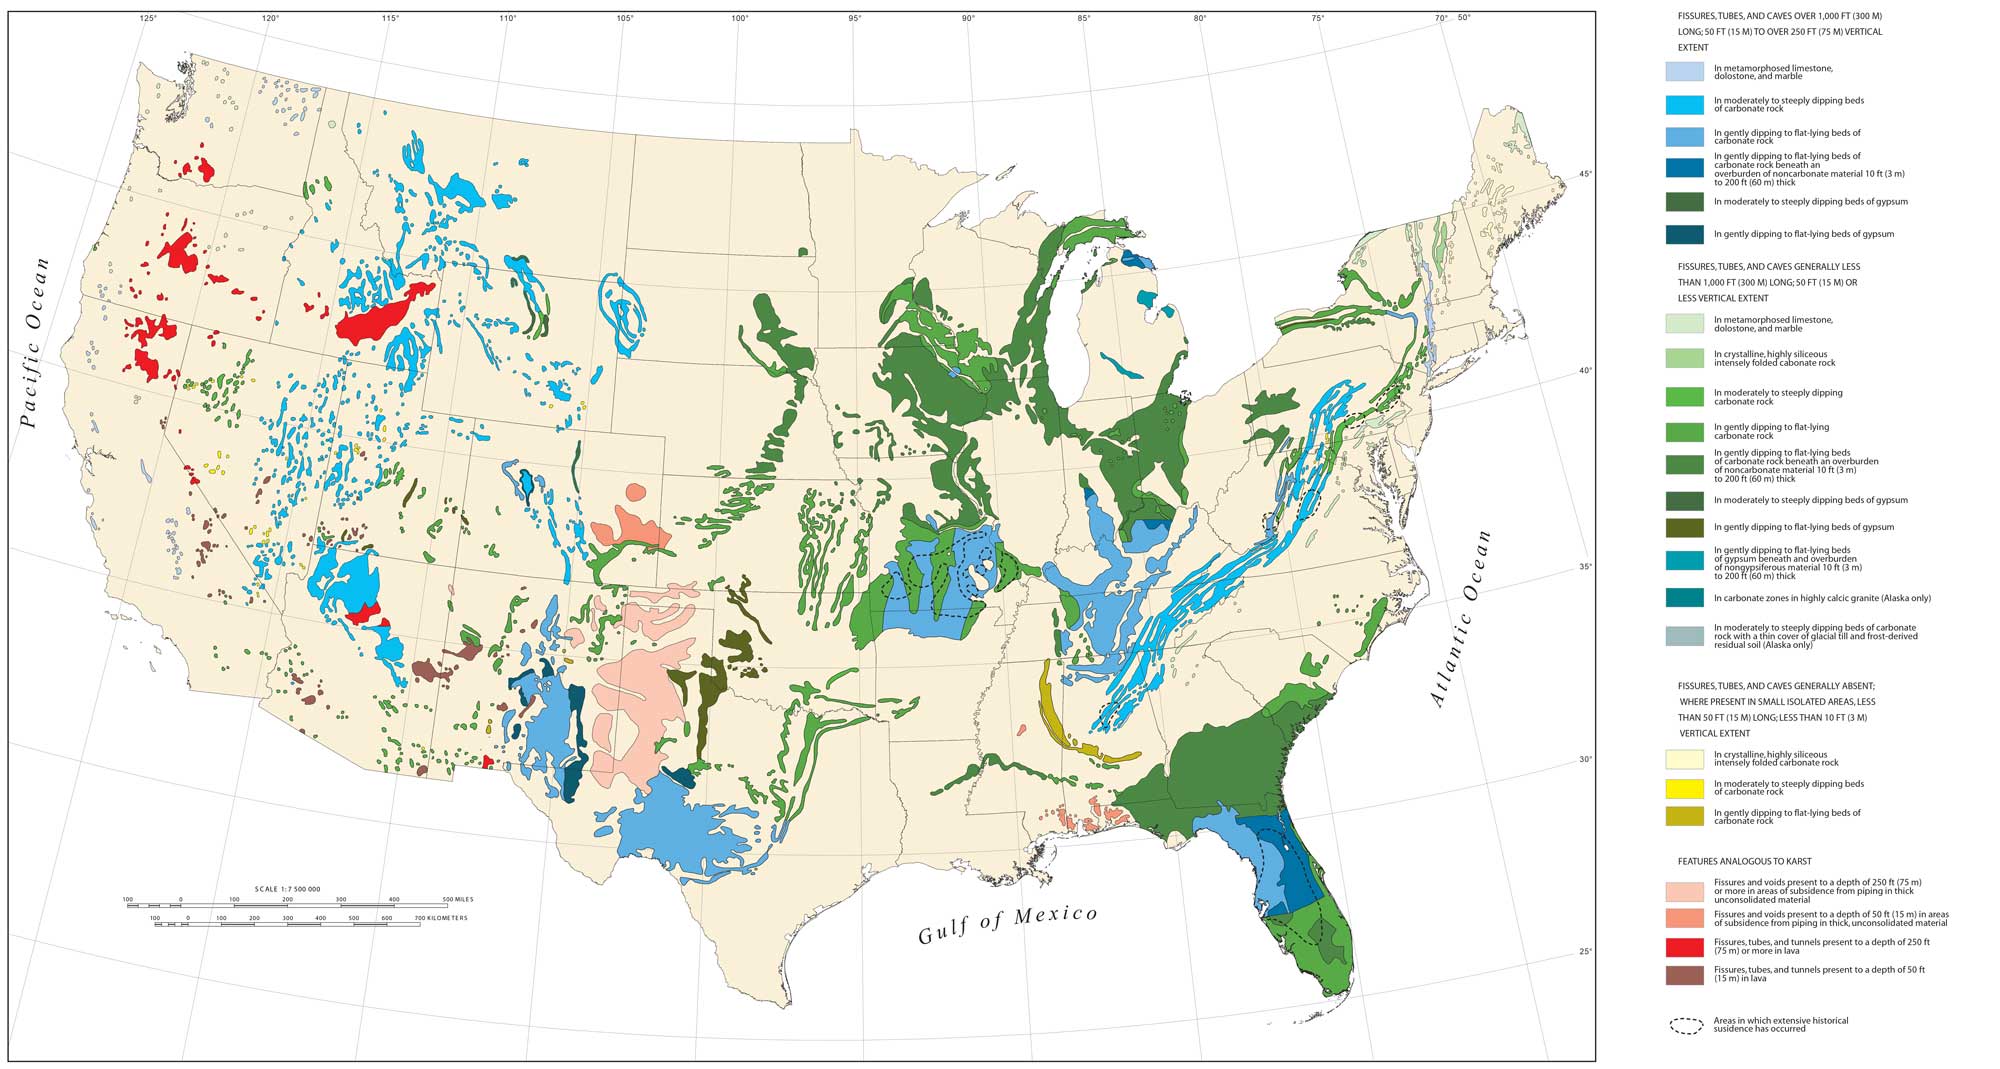
Areas of karst in the continental United States that are associated with carbonate and evaporate rocks. Image by Tobin and Weary (USGS; public domain).
The Coastal Plain of eastern Texas and Louisiana is dotted with many Jurassic subsurface salt domes that can collapse if salt is removed. For example, the Bayou Corne sinkhole in Assumption Parish, Louisiana, is a site where an underground salt dome collapsed in 2012 (learn more here).
"Sinkhole in Louisiana Swallows Trees - Caught on Tape 2013" by The New York Times (YouTube).
Before its collapse, the Bayou Corne sinkhole was preceded by months of seismic activity and the release of methane bubbles. It originally spanned one hectare (2.5 acres) but has since grown to over 10 hectares (26 acres). It is still growing, swallowing surrounding cypress swamp and endangering the nearby community, from which many of the residents have been evacuated. Scientists believe the sinkhole was created by the salt dome cavern being excavated too close to the massive salt deposit’s outer face, making it incapable of maintaining pressure.
A similar event occurred in Daisetta, Texas, a town also located on the edge of a major salt dome. In May 2008, a 330-meter-wide (1080-foot-wide) sinkhole caused by partial collapse of the dome swallowed a parking lot, construction equipment, and a small stand of trees over the course of a single day before filling with water.
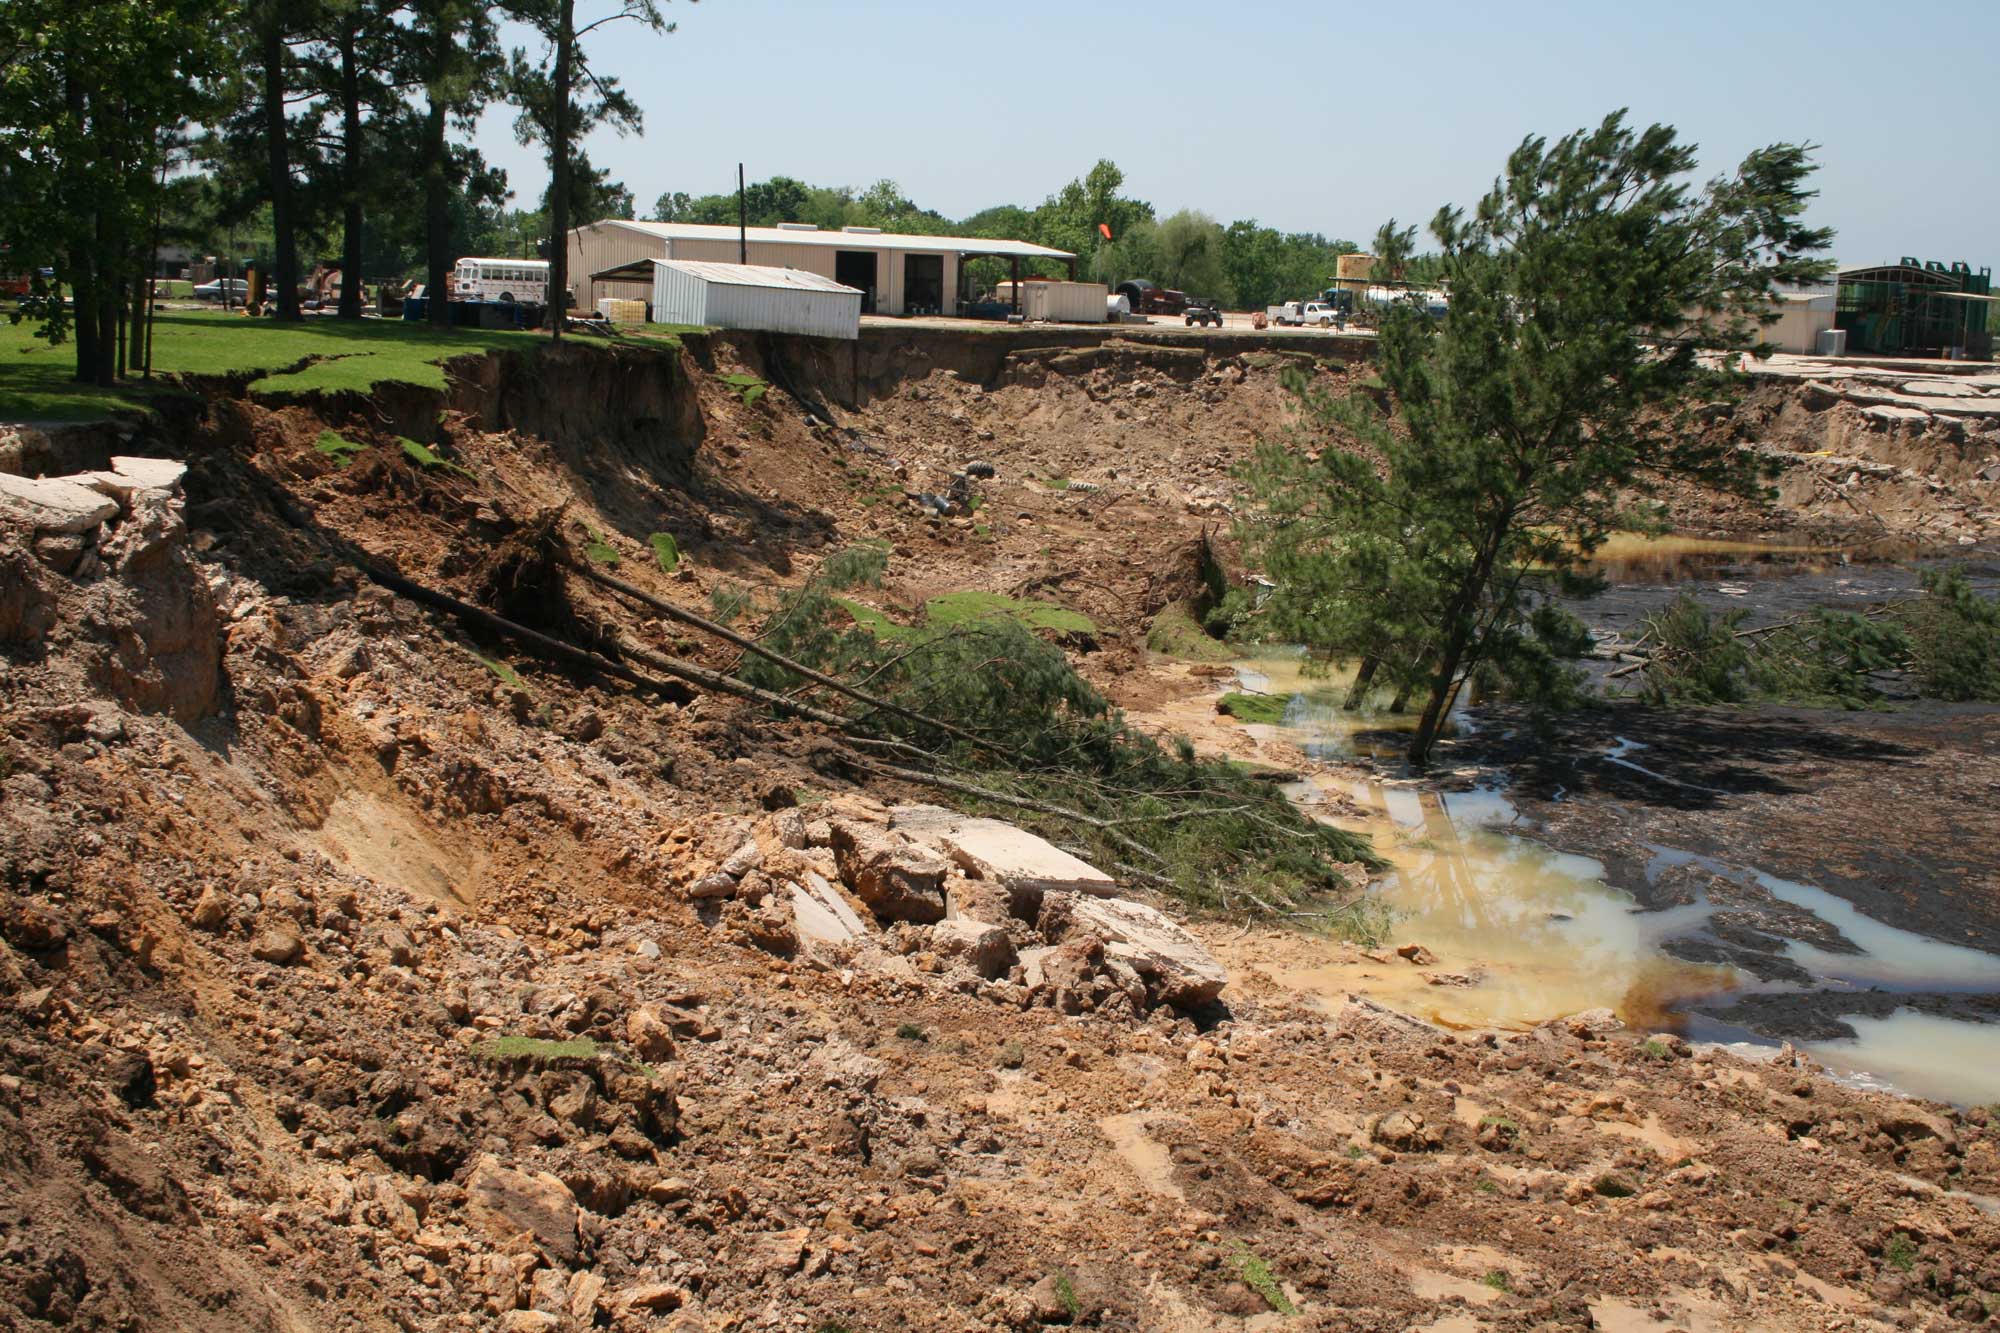
The 2008 sinkhole in Daisetta, Texas. Photograph by Randall Orndorff (USGS; public domain).
"Huge Sinkhole in Texas" by KHCW (YouTube).
These types of situations present a growing hazard that will be studied by geoscientists for years to come.
Salt karst can also be a hazard through its association with pathways for fluids, such as the flow of natural gas, which is sometimes stored in salt caverns. For example, in 2001, the Yaggy storage field—consisting of dozens of caverns in the Permian-age salt deposits near Hutchinson, Kansas— leaked 4 million cubic meters (143 million cubic feet) of natural gas, leading to multiple large-scale explosions within and around the city. In this case, the leak was associated with drilling errors as well as with faults and fractures in rocks overlying the salt formation.
Radon
In the South-Central US, the highest radon concentrations are generally associated with black, organic-rich Pennsylvanian shales in northeastern Kansas and the northwest corner of Missouri, and black Cretaceous shales in north-central Kansas. Radon risk in western Kansas is associated with Neogene sandstones containing volcanic ash layers.
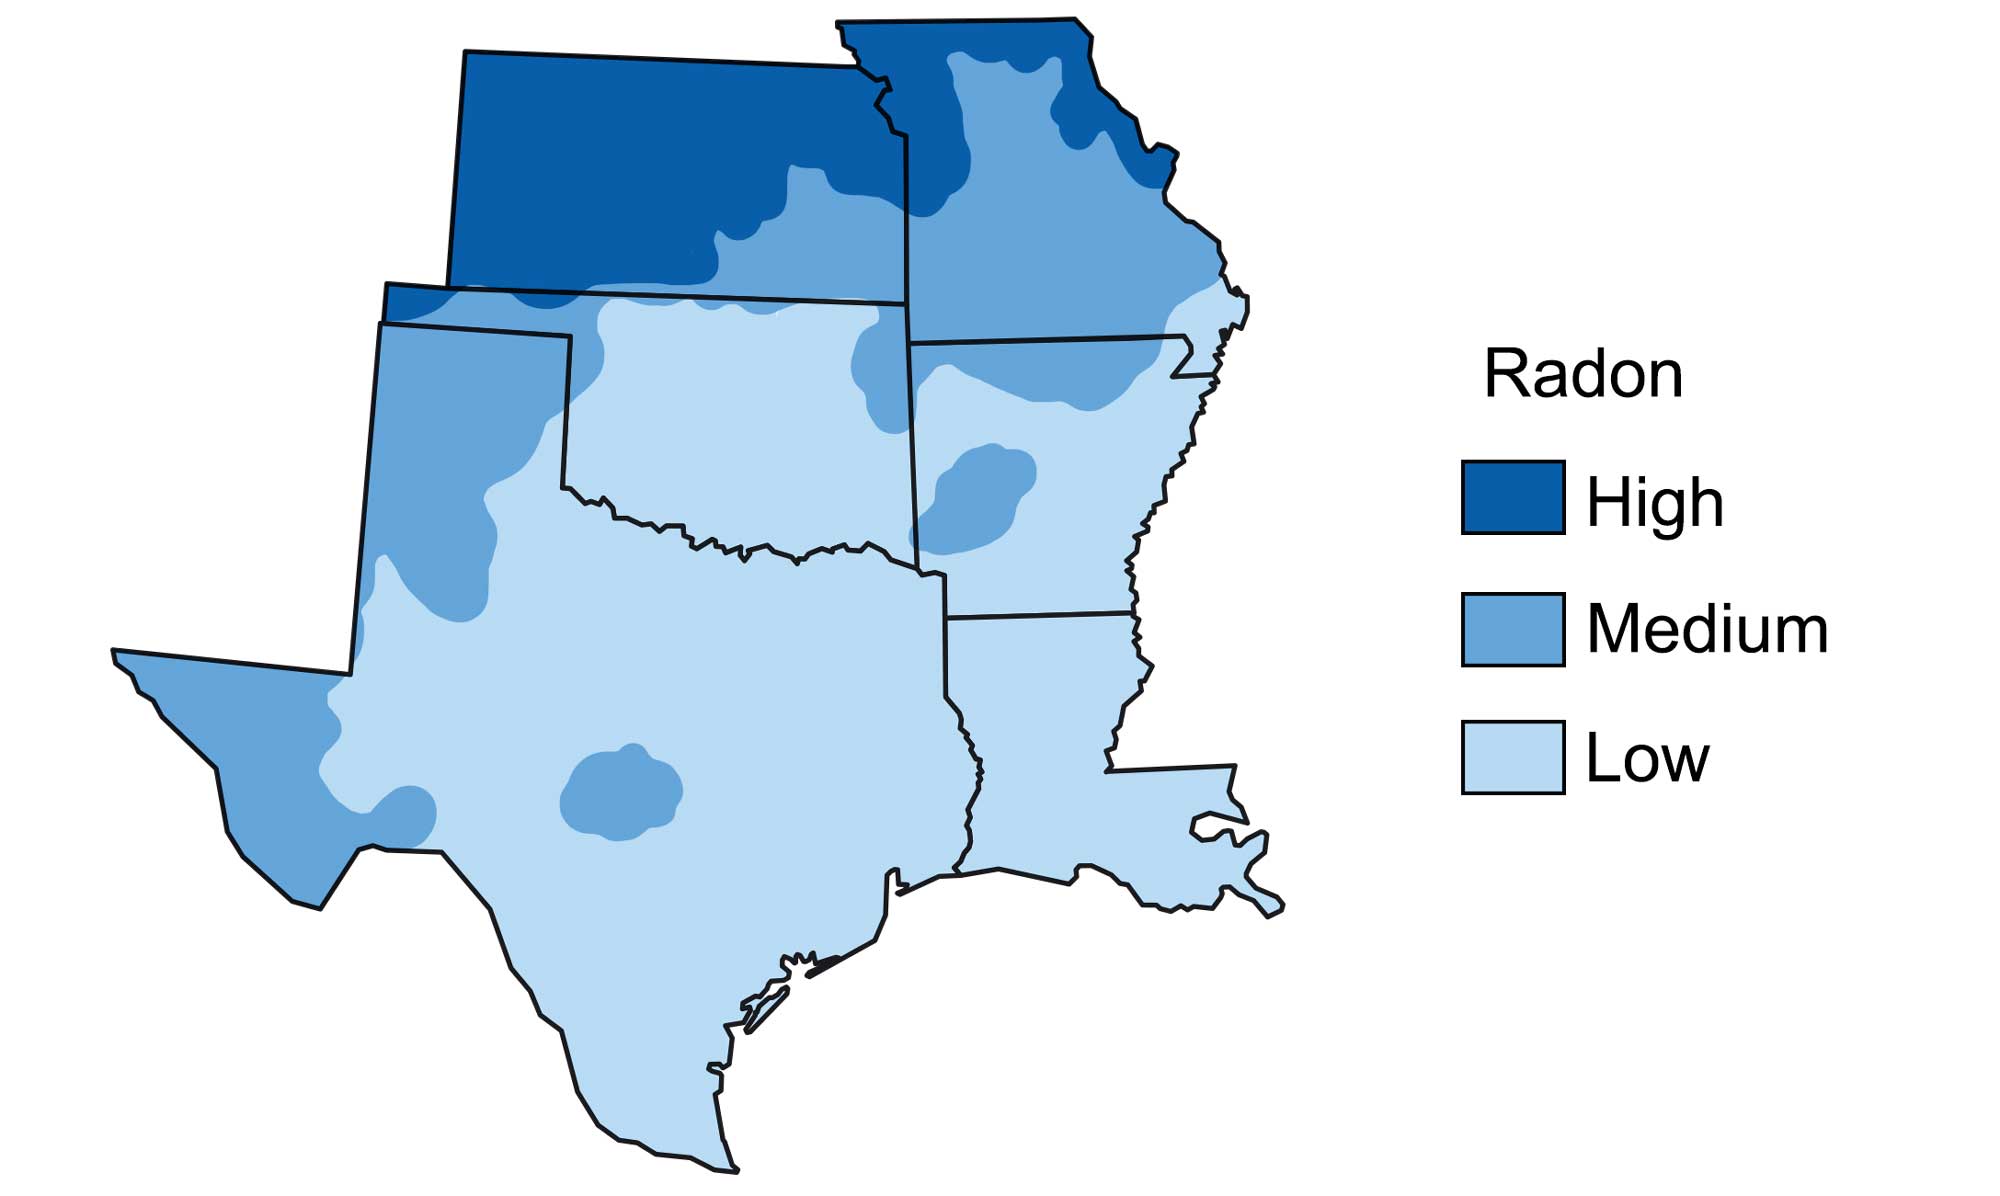
Radon risk levels at the surface in the South Central United States. Modified from image by Wade Greenberg-Brand, in turn adapted from image by EPA (public domain).
Volcanic ash can be high in uranium that eventually decays to radon. Water moving through the ash into the surrounding sandy layers carried with it uranium-rich dissolved silica that precipitated between the grains of the sandstone.
Floods
In the South-Central US, the greatest human impact from flooding is related to events along the banks of major rivers. Historically, there have been a number of record-setting floods along the Mississippi River (in 1927, 1937, 1945, and 1993), which runs along the eastern edge of the South Central. Many South-Central floods have also involved major tributaries of the Mississippi, such as the Missouri River, which intersects the Mississippi near St. Louis, and the Kansas River, which intersects the Missouri near Kansas City. The Great Mississippi and Missouri Rivers Flood of 1993 was preceded by a wet fall and a winter with heavy snowfall, followed by a series of precipitation events in roughly the same locations through the spring and summer of 1993.
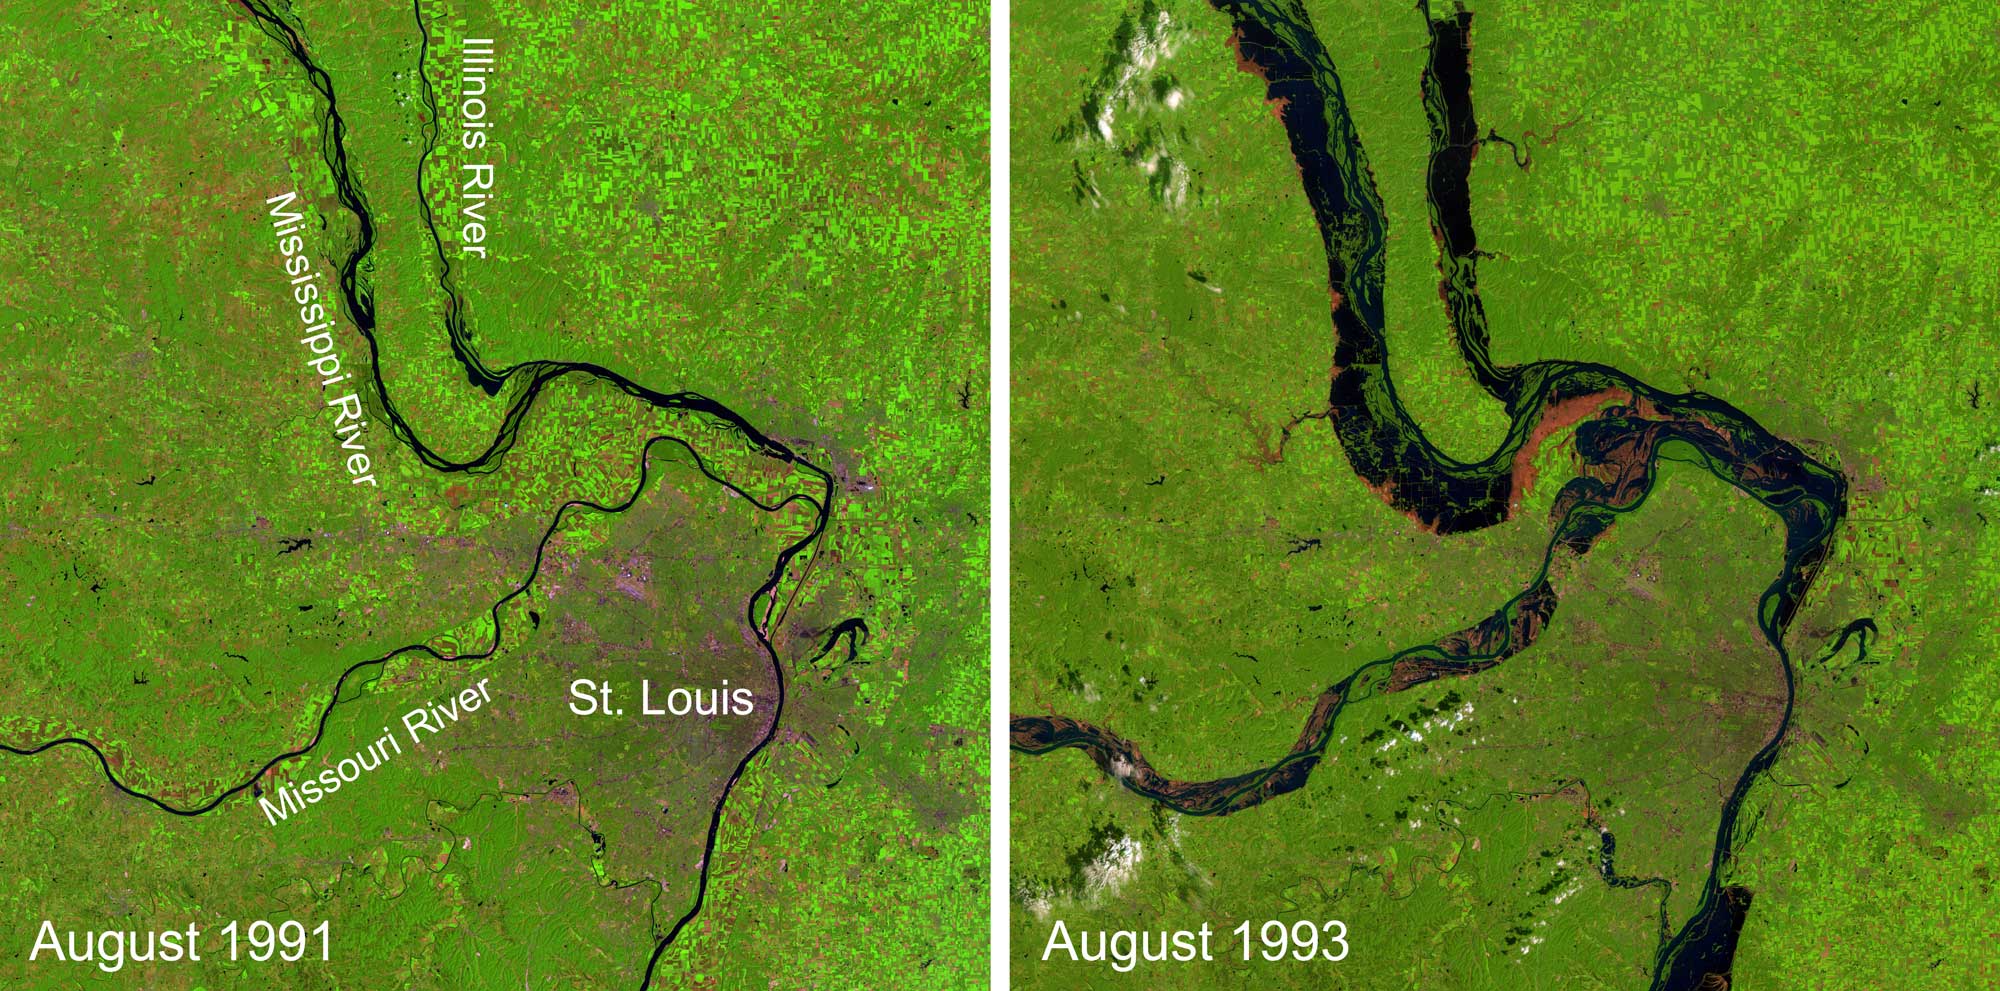
Confluence of the Mississippi and Missouri rivers, near St. Louis. Left: 1991, during non-flooding. Right: 1993, during the Great Mississippi and Missouri Rivers Flood. Image by Jonathan R. Hendricks; satellite maps by NASA Earth Observatory; public domain.
Many locations near St. Louis were flooded for over half a year. Dozens of individuals lost their lives and costs are estimated to have been in the $15–20 billion range. However, even with the massive damage sustained from this flooding event, the impact could have been even worse were it not for a series of levees and reservoirs built in response to a large flood of the Kansas River in 1951—an event called “one of the worst [disasters] this country has ever suffered from water,” by President Truman.
Flash floods—rapid flooding of low-lying areas—are often associated with heavy rain, which can quickly waterlog soil and lead to mudslides on steep terrain, resulting in damage to roads and property. In areas of lower elevation, flash floods can be produced when slow-moving or multiple thunderstorms occur over the same area. When storms move more quickly through an area, flash flooding is less likely. Flash floods can also occur in conjunction with a dam break or levee failure. A special case of flooding due to a failed levee occurred in fall 2005, when Hurricane Katrina forced water over and through the levee holding seawater back from New Orleans, part of which is built below sea level (see the “Storms” segment later in this chapter for more information). In this case, flooding came not from precipitation, but from a “storm surge,” where seawater was transported high onto shore through a combination of low atmospheric pressure and powerful winds.
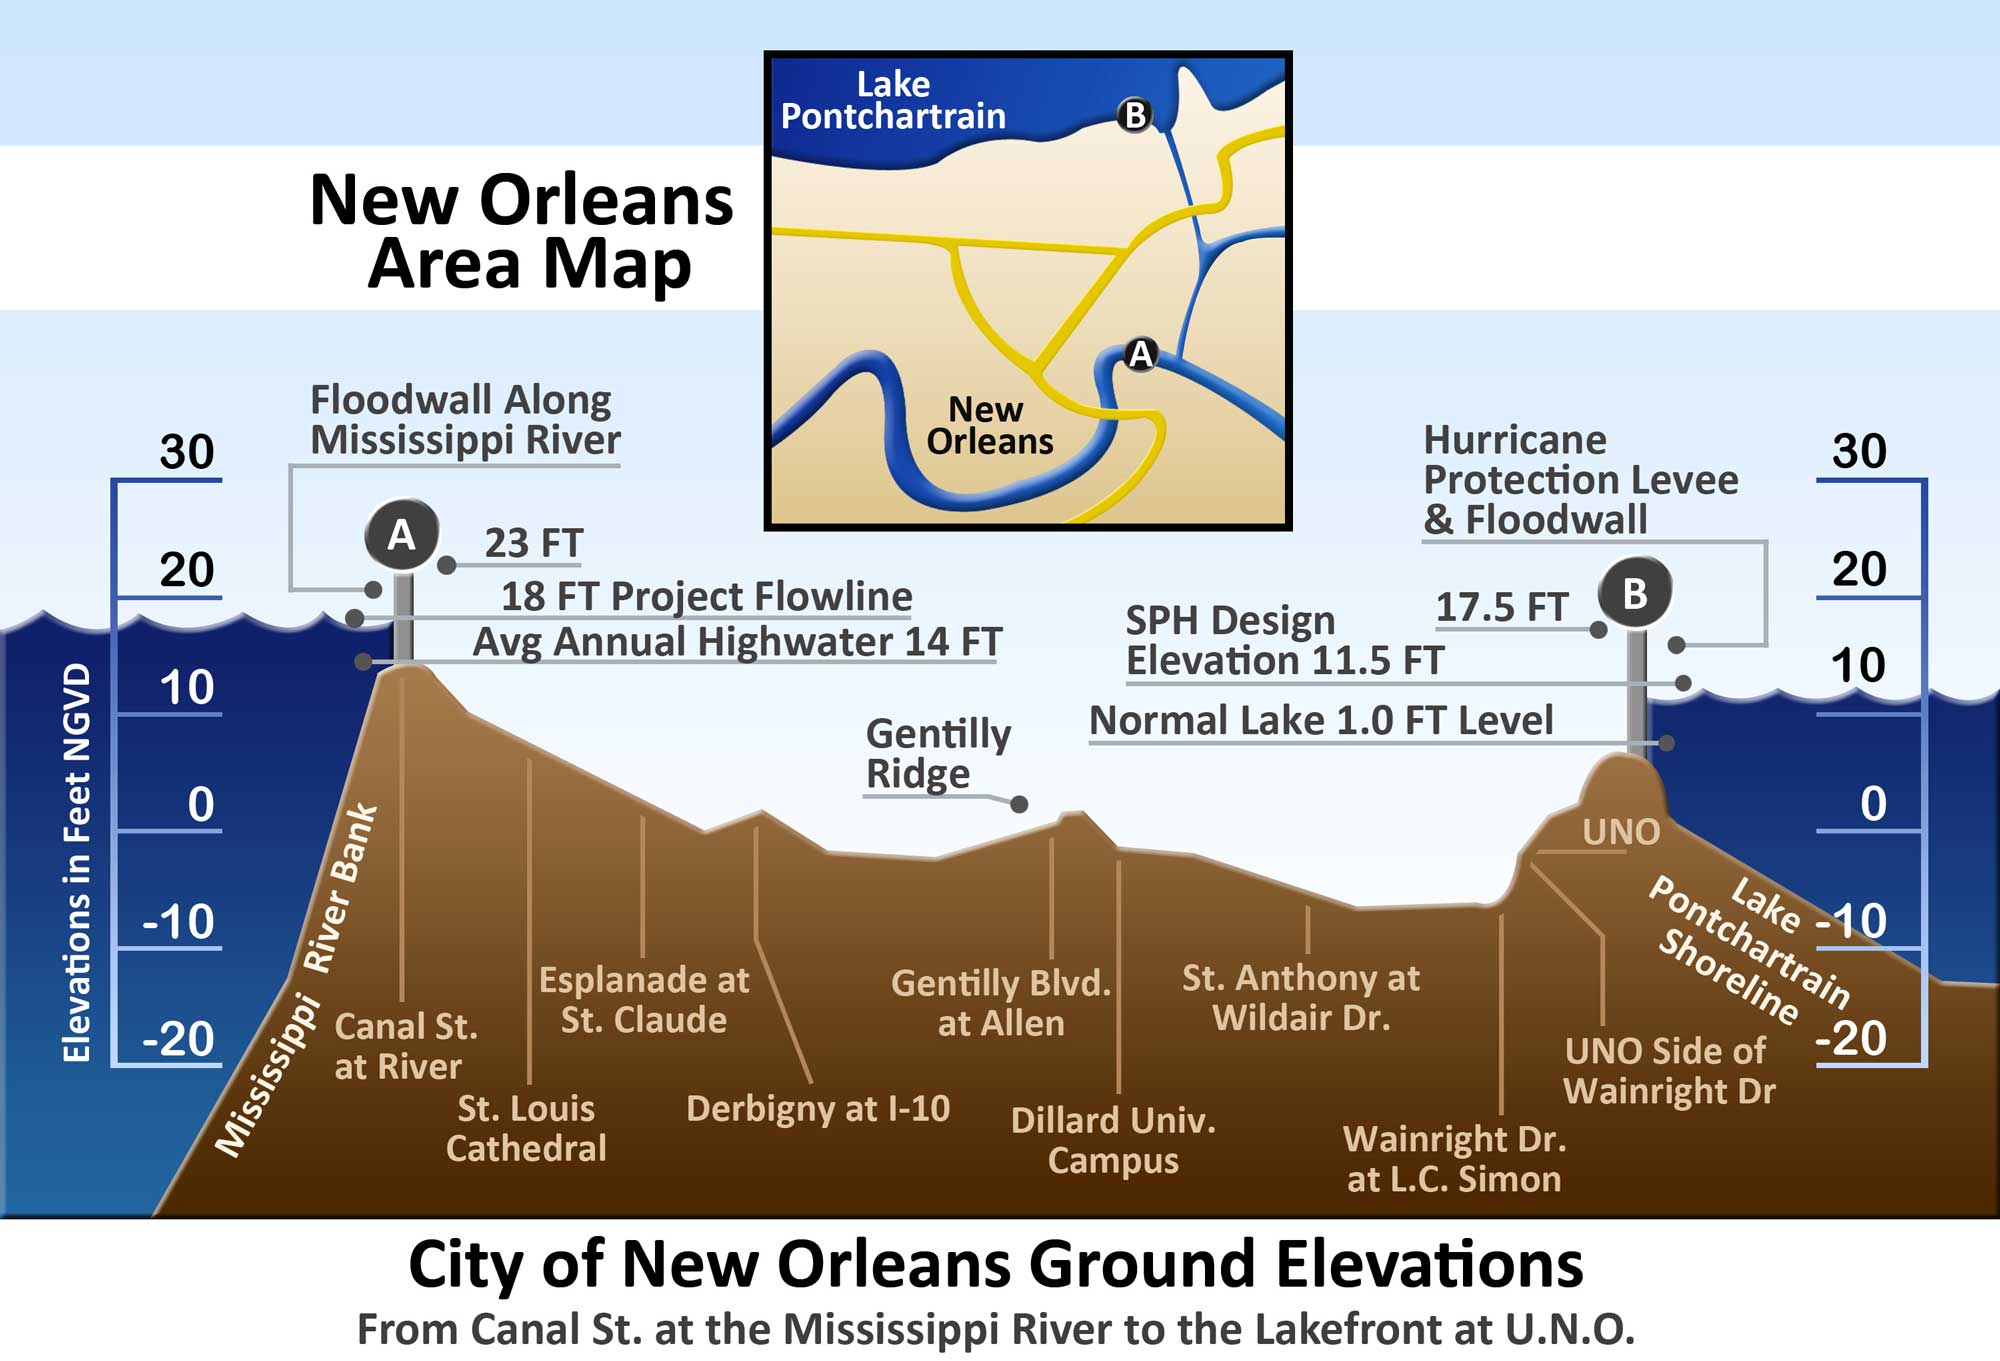
Cross section of New Orleans, Louisiana, demonstrating that the bowl-shaped land of the city is surrounded by bodies of water that are at a higher elevation than the underlying land itself. Image by "Alexdi" (Wikimedia Commons; Creative Commons Attribution-Share Alike 3.0 Unported license).
Sea level rise, coastal erosion, and subsidence
Coastal erosion has been occurring along Louisiana’s Gulf Coast since its formation as an alluvial plain deposit of the Mississippi River. It is a natural process in which currents and waves remove sediment in some areas and deposit it in others, but the natural accretion and replenishment processes have been disrupted by levees along the Mississippi River, as well as by dams along the river’s length. Simply put, the river carries about half the amount of sediment that it did when it built the Coastal Plain. Because the primary substrate (“bedrock”) is soft alluvium rather than rock, erosion rates tend to be higher than deposition rates.
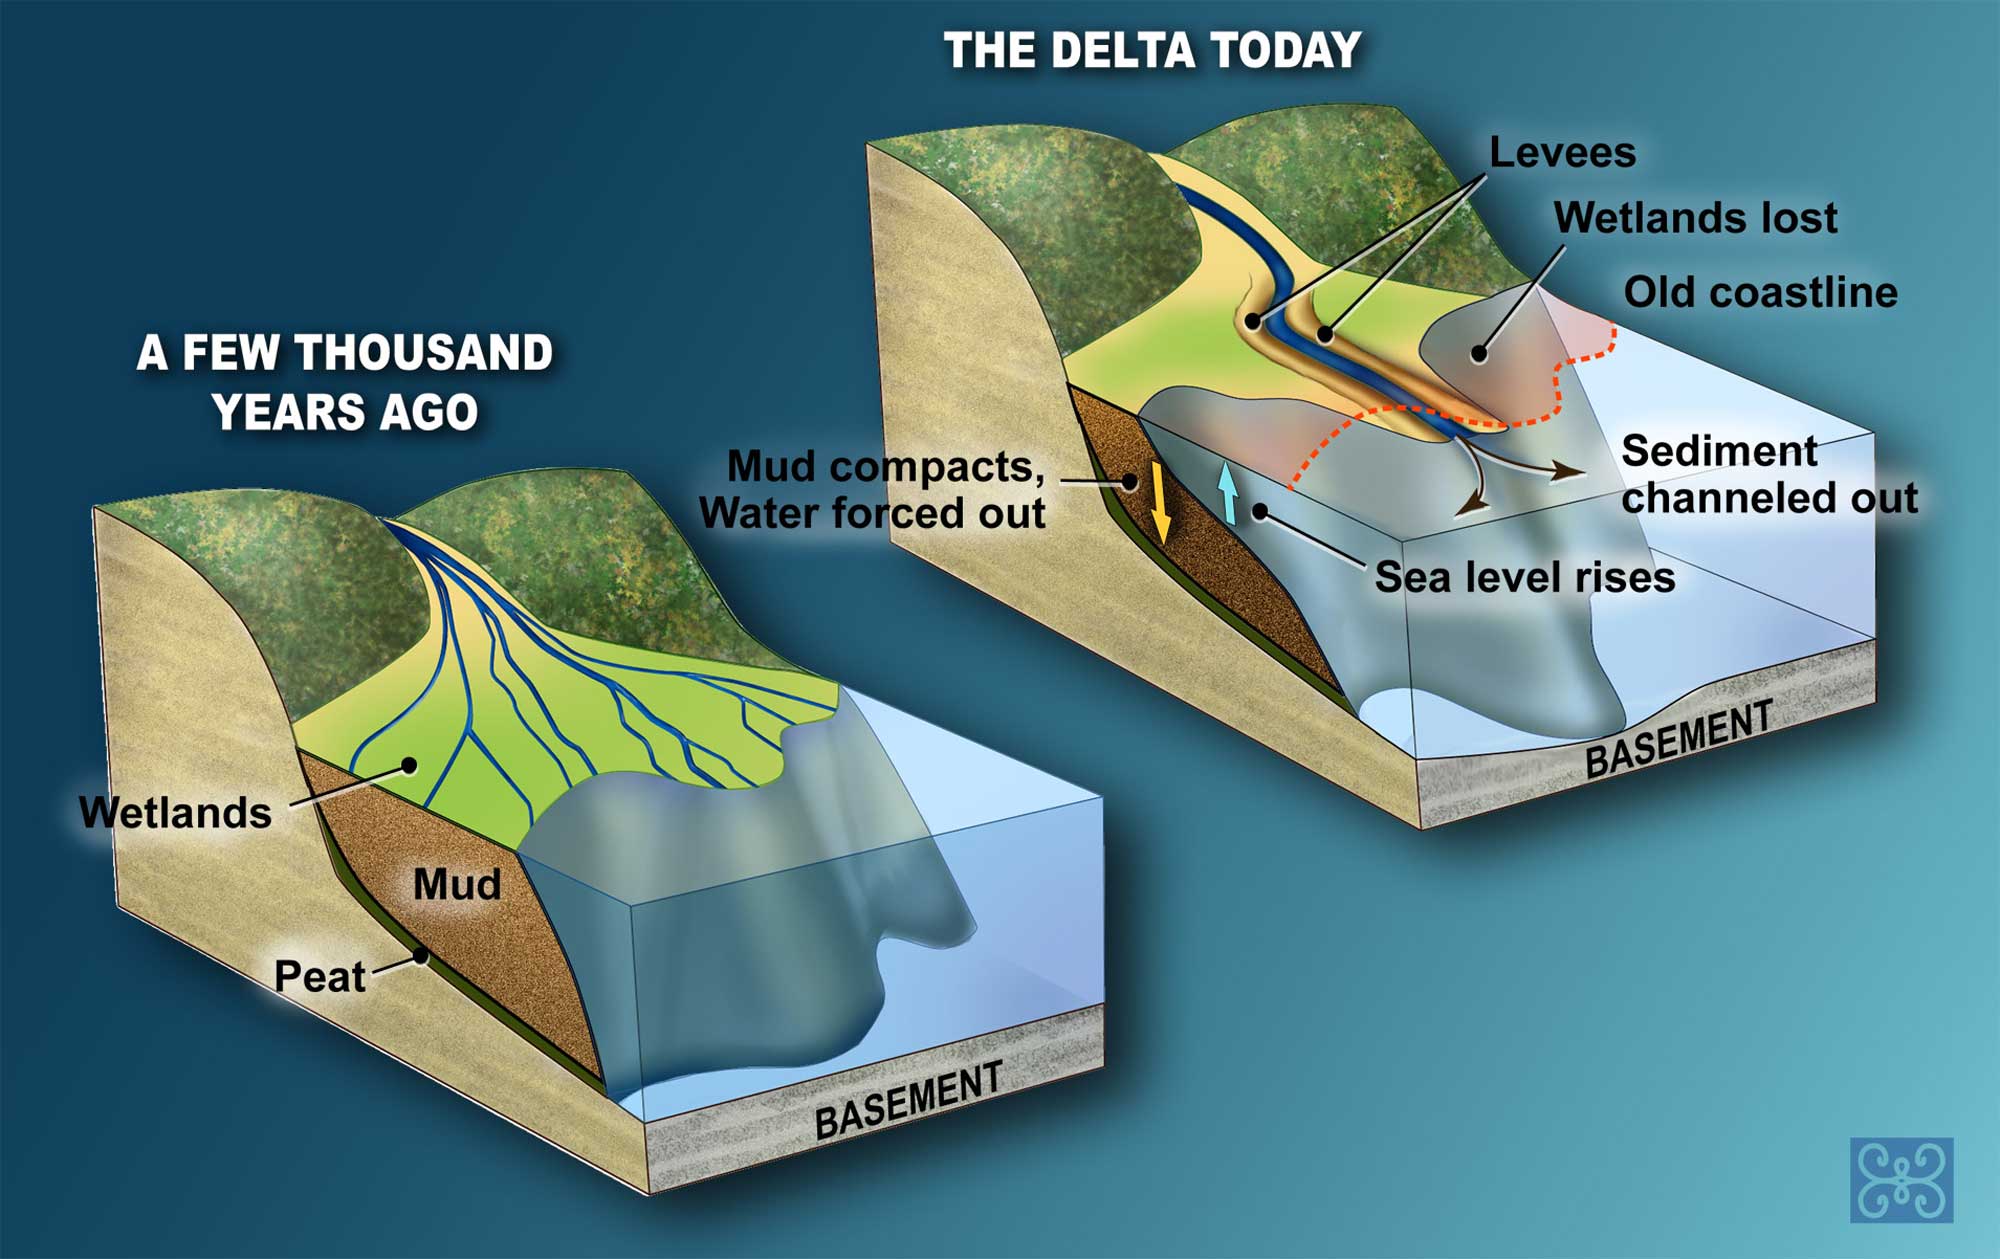
The Mississippi Delta and its wetlands are not as extensive as they were before river and coastal management programs were enacted. Image by Zina Deretsky (National Science Foundation; public domain).
About 40% of US wetlands are in Louisiana, but about 80% of US wetlands-loss occurs there as well. The dramatic increase in Louisiana’s coastal erosion in recent decades is due to a number of different factors, including natural erosional processes and human activities such as dredging and development. This trend is expected to continue as sea level rises and storm frequency and severity increase. Barrier island and beach erosion is expected to occur in large bursts during storm events as a result of increased wave height and storm intensity.
The Coastal Plain is threatened by the triple risk of coastal erosion, sea level rise, and subsidence, with subsidence exacerbating the effects of the first two. Compaction of sediment, extraction of water and minerals from the soil, and collapse along fault lines are combining to increase the rate of subsidence. A combination of coastal erosion, sea level rise, subsidence, and increased storm intensity could have catastrophic impacts on the Coastal Plain region. Since the 1930s, Louisiana has lost 4870 square kilometers (1880 square miles) of coastline, and it is predicted that an additional 4530 square kilometers (1750 square miles) could be lost by 2100, at least partially due to rising sea levels caused by glacial melting associated with climate change.
New Orleans, which is subsiding five centimeters (two inches) per decade, is of special concern. The city’s topography and that of the surrounding coastal zone reflects the negative effects of river levees and subsidence along faults. One study places significant blame for recent subsidence on the Michoud Fault, which trends beneath the eastern portion of New Orleans, where a portion of the city known as “Michoud” has an unusually high subsidence rate. New Orleans is the largest urban area in the US that has been affected by subsidence—over 35 square kilometers (13.5 square miles) of the city are now below sea level and must be kept dry by use of a series of levees and pumps. With sea level rise and the loss of nearby protective wetlands, the impacts of coastal storms, hurricanes, and associated storm surges may become increasingly devastating.
Weather hazards
Weather is the measure of short-term atmospheric conditions such as temperature, wind speed, and humidity. The South Central is among the most active locations on Earth for two very different kinds of high-energy atmospheric events: tornados and hurricanes. It also experiences a variety of other weather hazards, including high temperatures and drought.
Storms, Tornadoes and Derechos
Rainstorms occur where colder air from higher latitudes abruptly meets warmer air. This often happens in the mid-latitudes (particularly in the South-Central U.S.) where air may warm up as it passes over flat open spaces or when warm, moist air is delivered off the Gulf of Mexico. At the boundary between warmer and cooler air, buoyant warm air rises, and then cools because air pressure decreases with increasing height in the atmosphere. As the air cools, it becomes saturated with water vapor; condensation occurs and clouds begin to form. Because liquid water droplets in the clouds must be very small to remain suspended in the air, a significant amount of condensation causes small water droplets to come together, eventually becoming too large to remain suspended. Sufficient moisture and energy can lead to dramatic rainstorms. Because warm air has a lower pressure relative to cold air, and the movement of air from areas of high pressure to areas of low pressure generates wind, the significant difference in air pressure associated with these boundaries and rainstorms also generates strong winds. Flat regions, such as the Great Plains, allow winds to move unimpeded by topography, and are often subject to severe thunderstorms.
While severe thunderstorms are common in some parts of the South Central, two less common storm hazards have the potential to cause serious property damage and endanger lives: derechos and tornados. Approximately one derecho every year or two will occur in Arkansas, eastern Oklahoma, and southern Missouri, but they do occur with decreasing frequency through most of the remaining parts of the South-Central U.S.
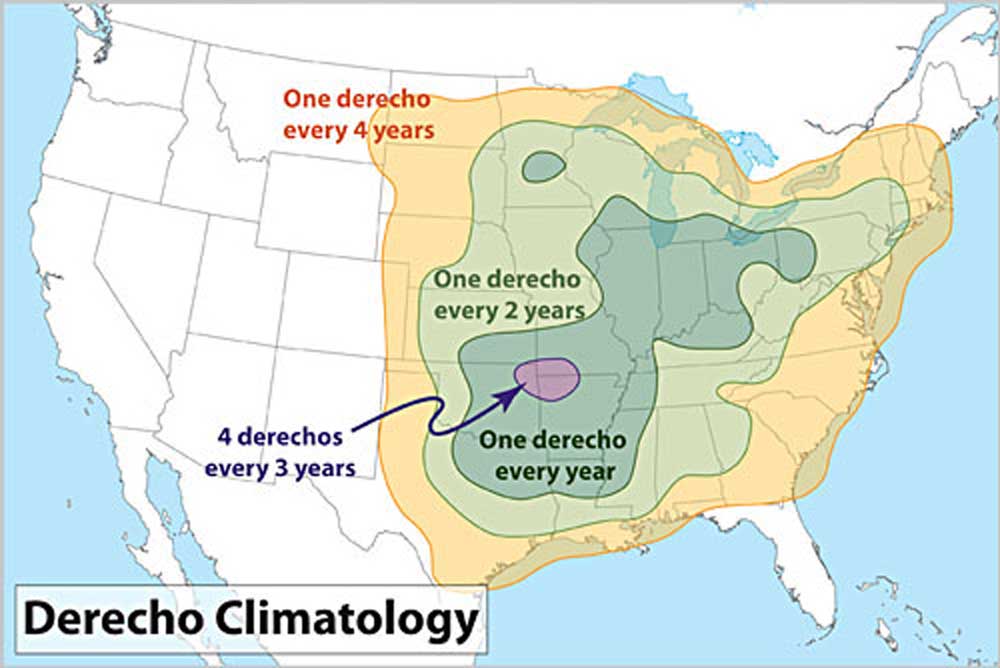
Derecho frequency in the continental United States. Map by NOAA (public domain).
“Tornado Alley” is the nickname for an area, extending from Texas to Minnesota, that experiences a high number of exceptionally strong tornados due to its flatter topography and high incidence of severe thunderstorms. Most of the South Central resides within Tornado Alley, leading to more tornados in this part of the United States than in any other.
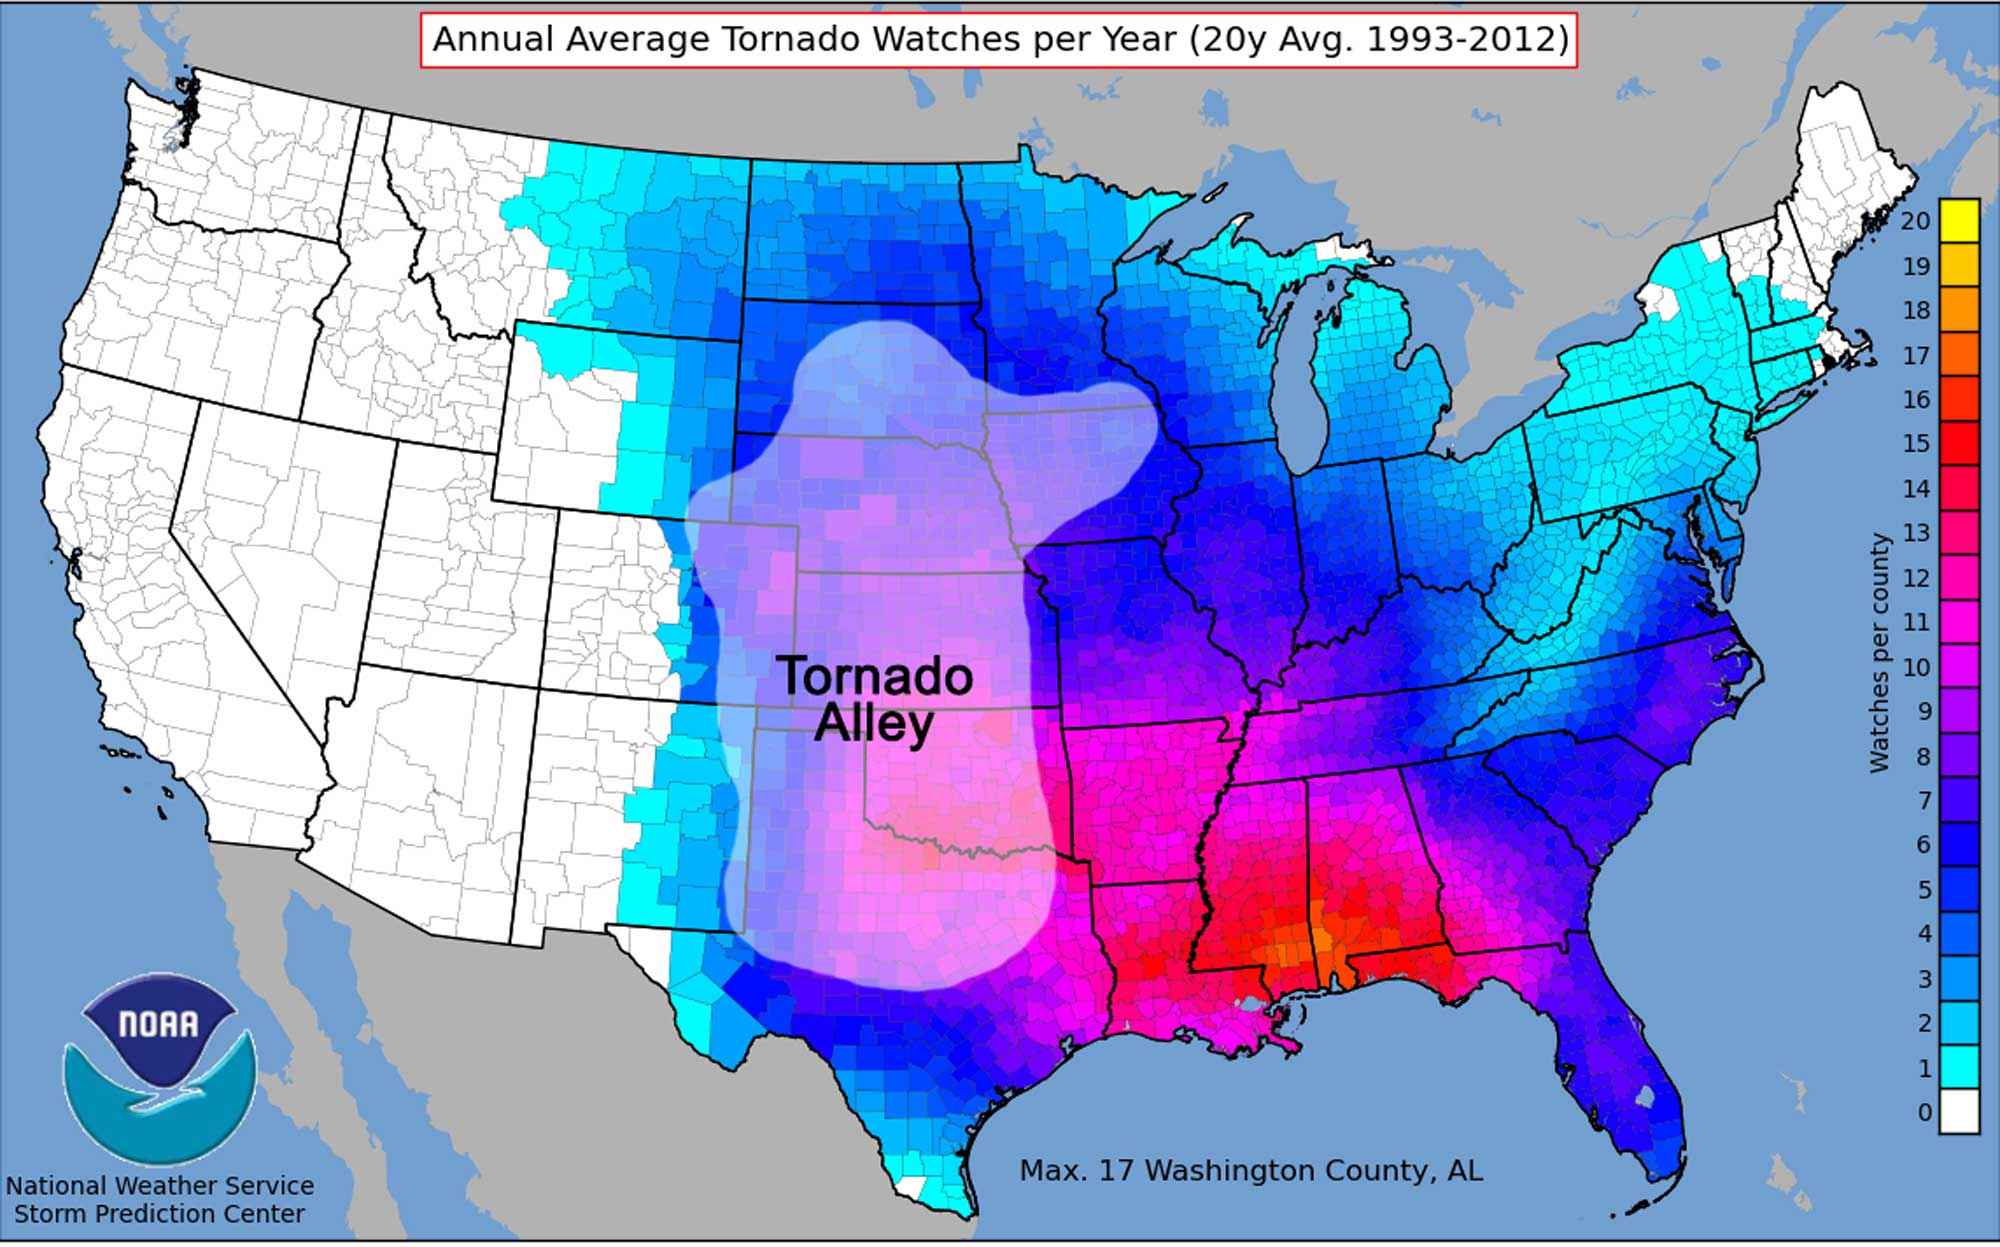
Twenty-year average yearly tornado watches in each county of the United States between 1993 and 2012. Tornado Alley is identified. Map by NOAA (public domain) modified for the Earth@Home project.
From 1991 to 2010, for example, an annual average of 115, 62, and 96 tornados occurred in Texas, Oklahoma, and Kansas, respectively. To the east of Tornado Alley, far fewer tornado strikes occur, with an annual average of 37, 39, and 45 striking Louisiana, Arkansas, and Missouri, respectively. The boundaries of Tornado Alley vary in application, depending on whether the frequency, intensity, or number of events per location are used to determine the area’s borders. Some people apply the name “Dixie Alley” to the adjacent tornado-prone area from Louisiana and Arkansas east to Florida.
Hurricanes
In an average year, about a dozen hurricanes travel through the western Atlantic and sometimes the Gulf of Mexico. Of these, roughly one a year hits the Texas and/or Louisiana coast, though these occurrences vary considerably. The peak month is September, followed by August and October. More rarely, hurricanes may hit the coast in June, July, or November. The 2005 hurricane season was the most active in recorded history, with a record number of 15 hurricanes, 7 of which strengthened into major (category 3 or greater) hurricanes; there were 14 hurricanes (7 major) in 2020.
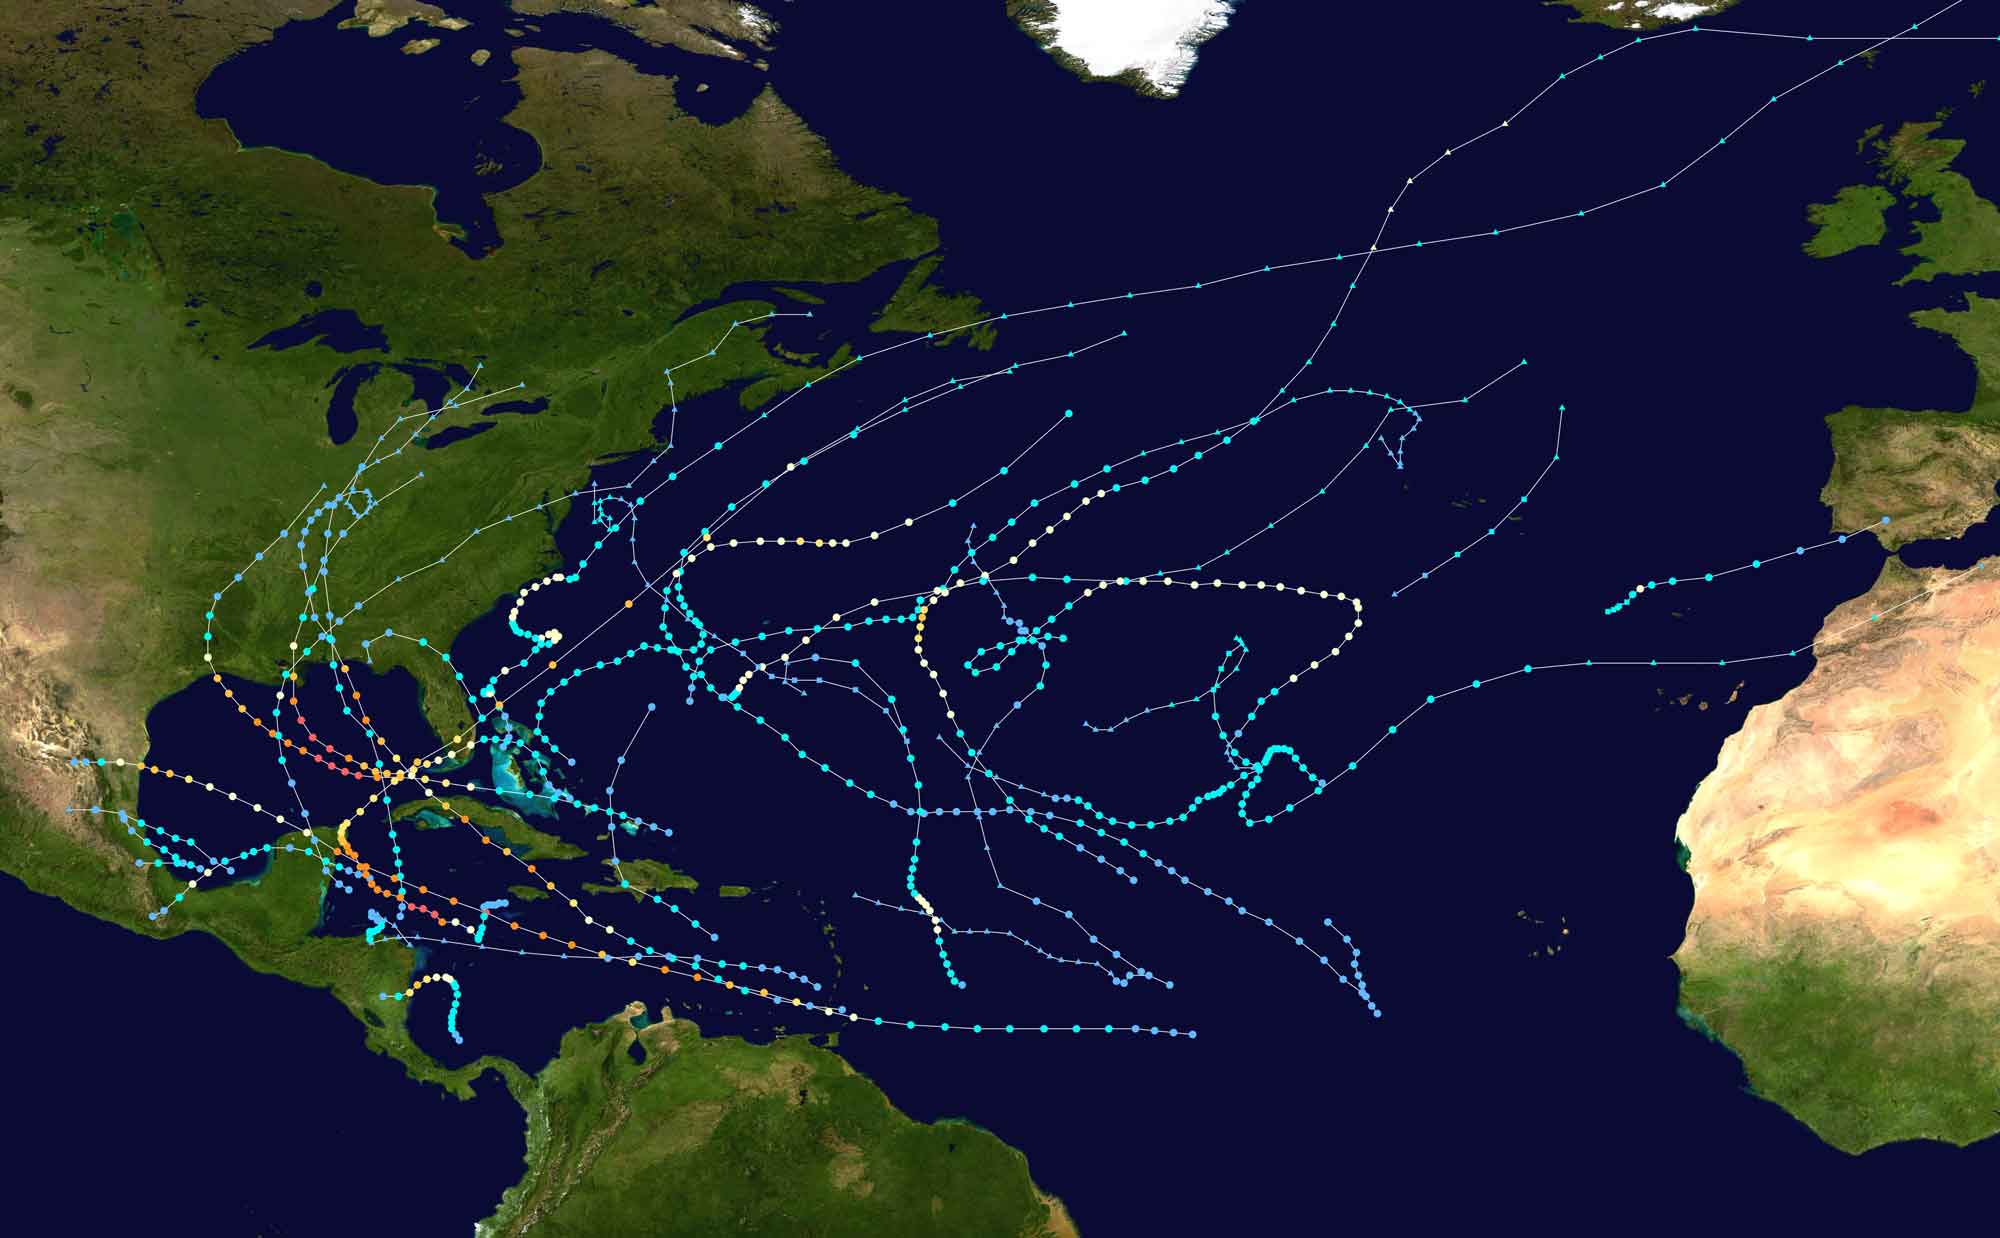
Tracks of all Atlantic hurricanes during the 2005 season. Warmer colors indicate higher maximum sustained wind speeds. Image by "Supportstorm" (Wikimedia Commons; public domain).
Two of the 2005 hurricanes—Katrina and Rita—were category 5 storms that did substantial damage to the Gulf Coast. Hurricane Katrina destroyed large parts of New Orleans, resulted in $125 billion in damage, caused over 1,800 deaths, and led to significant human suffering and displacement.
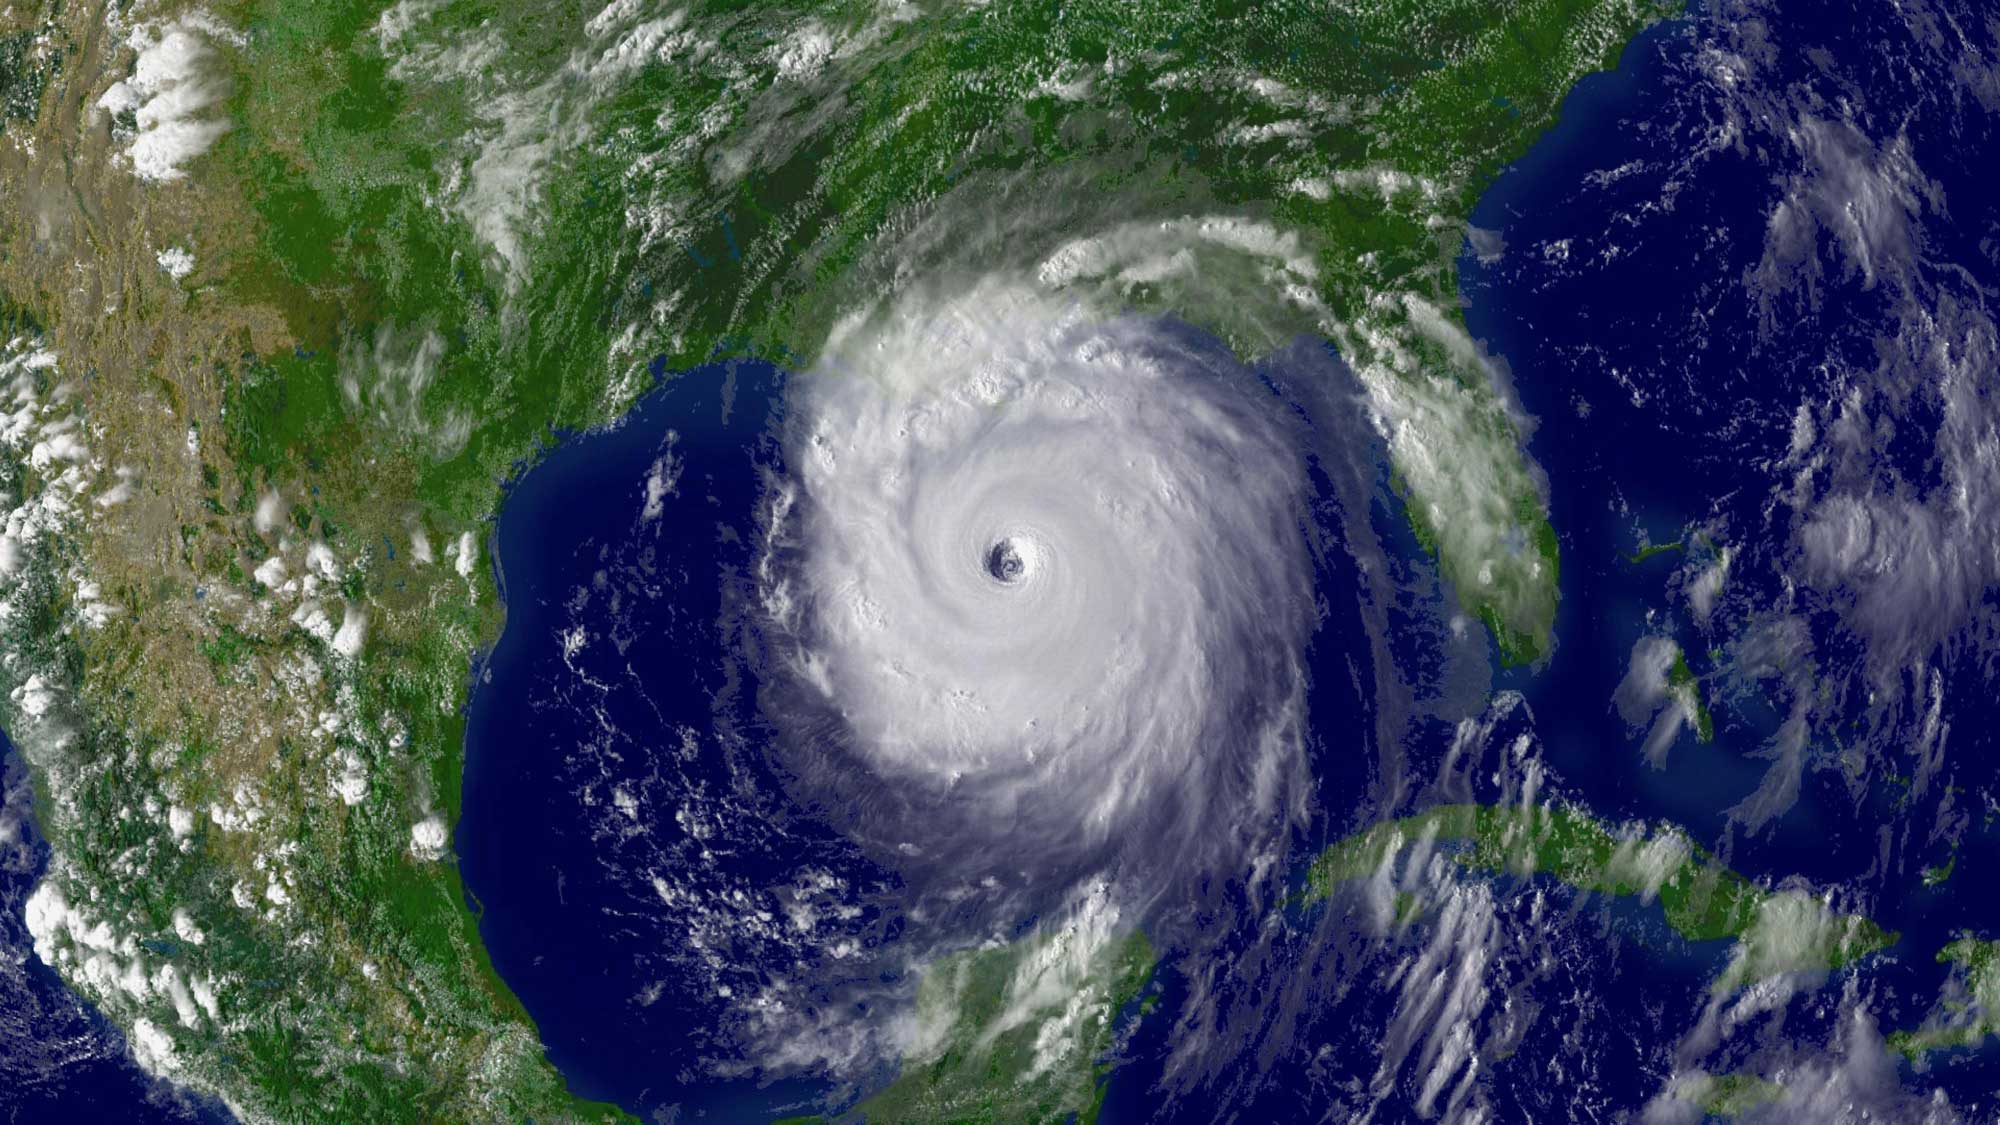
Satellite image of Hurricane Katrina as it approached the Louisiana coastline in 2005. Image by NOAA (public domain).
"Hurricane Katrina Day by Day" by National Geographic (YouTube). Warning: This video includes disturbing content, including an image of a person who died and clips showing human suffering.
Once hurricanes reach land, they lose energy rapidly, though they typically continue to deliver substantial precipitation and somewhat high winds for hundreds of miles onshore. Hurricane tracks over eastern Texas and Louisiana generally veer north to northeast, heading across eastern Texas and Louisiana to eastern Oklahoma, Arkansas, and southeast Missouri. This was the general pattern of Hurricane Harvey, which made landfall in Texas and Louisiana in 2017 as a category 4 storm. Harvey caused $125 billion in damage (tied with Katrina for the most costly ever) and resulted in over 100 deaths.
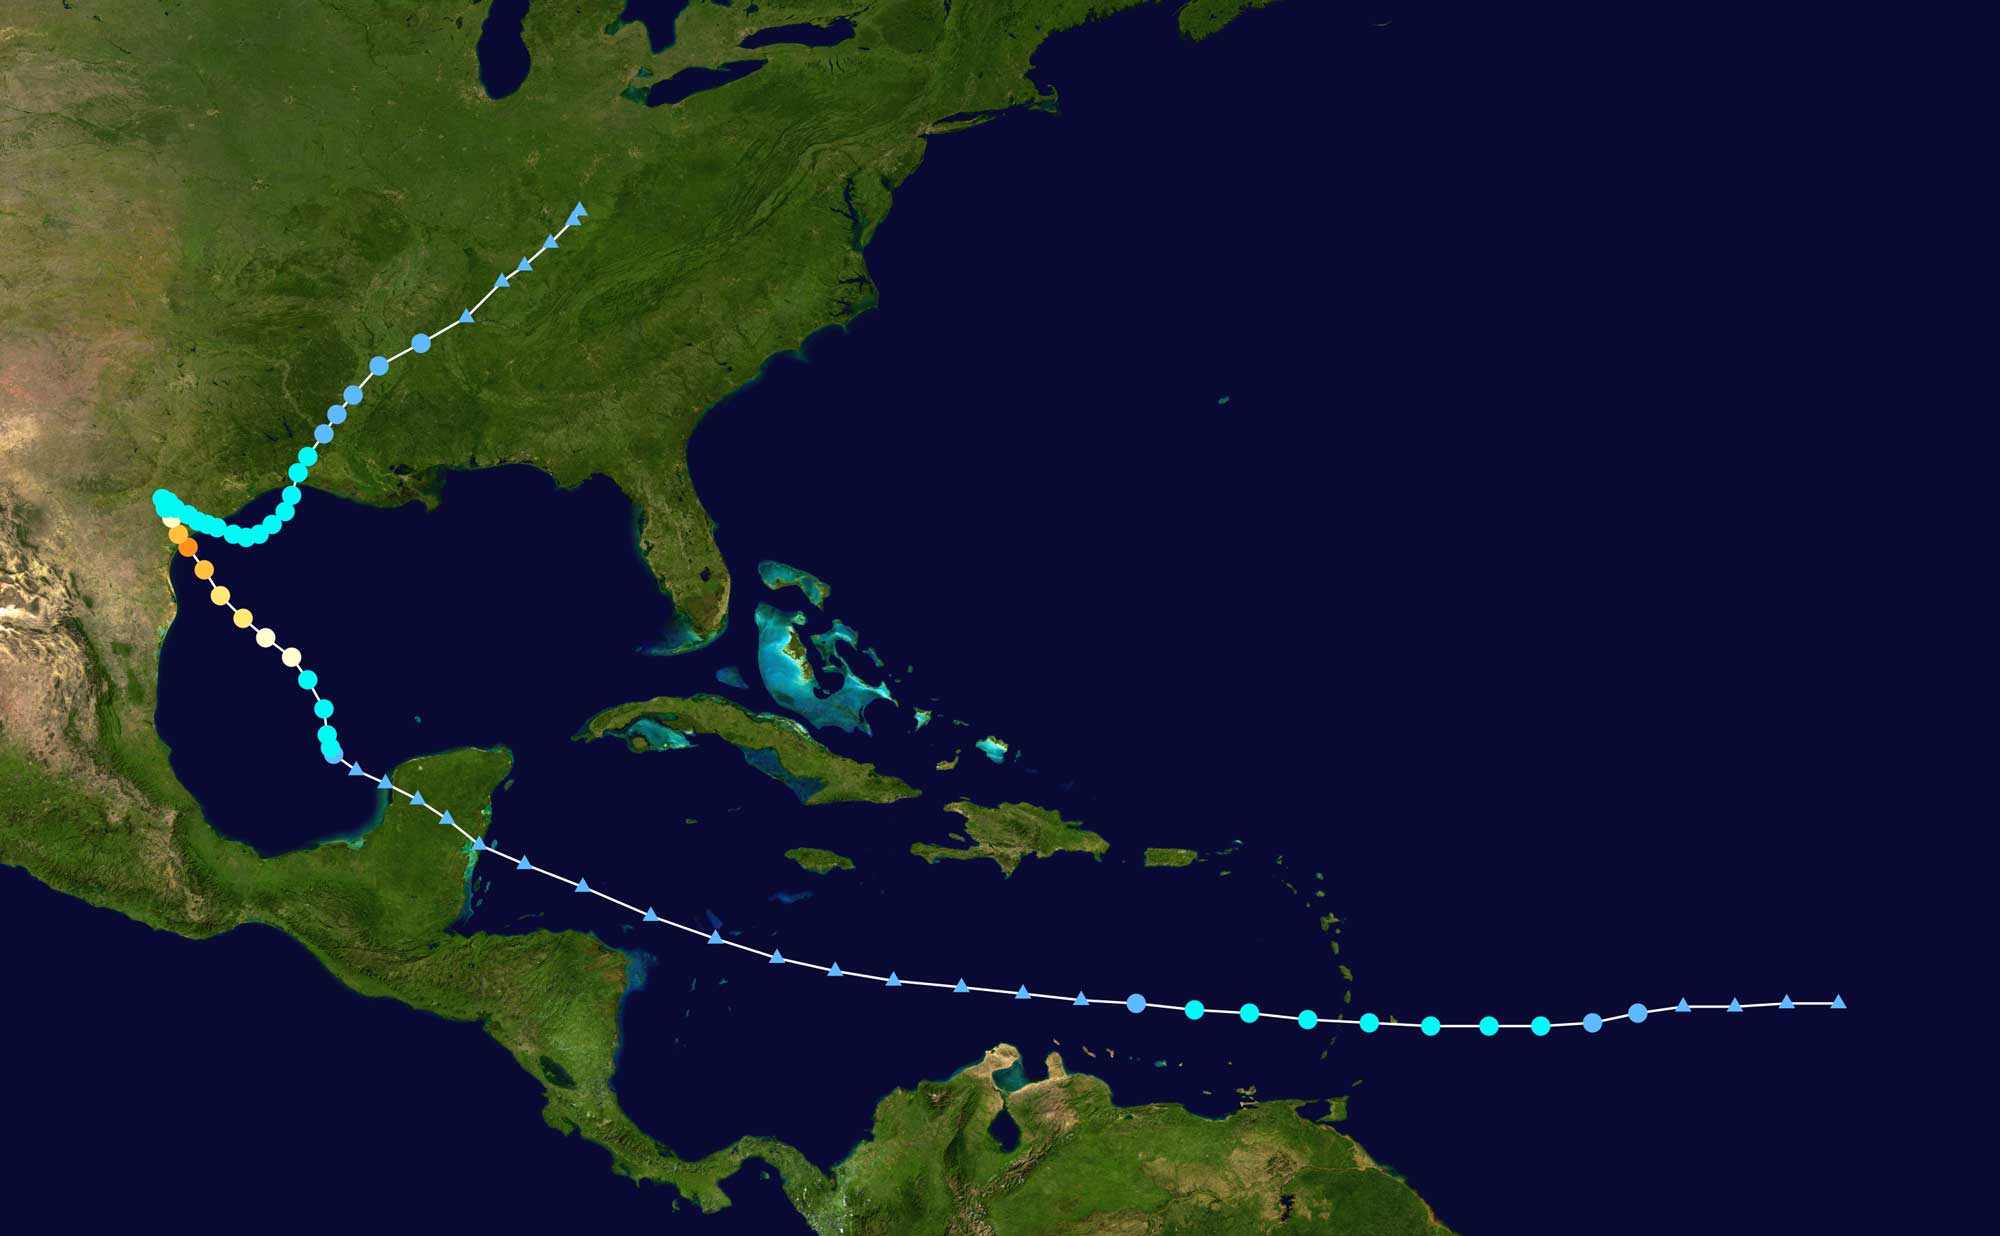
Storm track of Hurricane Harvey in 2017; warm colors are associated with higher wind speeds. Image by "OverlordQ" (Wikimedia Commons; public domain).
Extreme Temperature and Drought
In 2011, the South-Central United States experienced the nation’s hottest summer heat wave in 75 years, with temperatures reaching upwards of 55°C (131°F) during a period of four months.
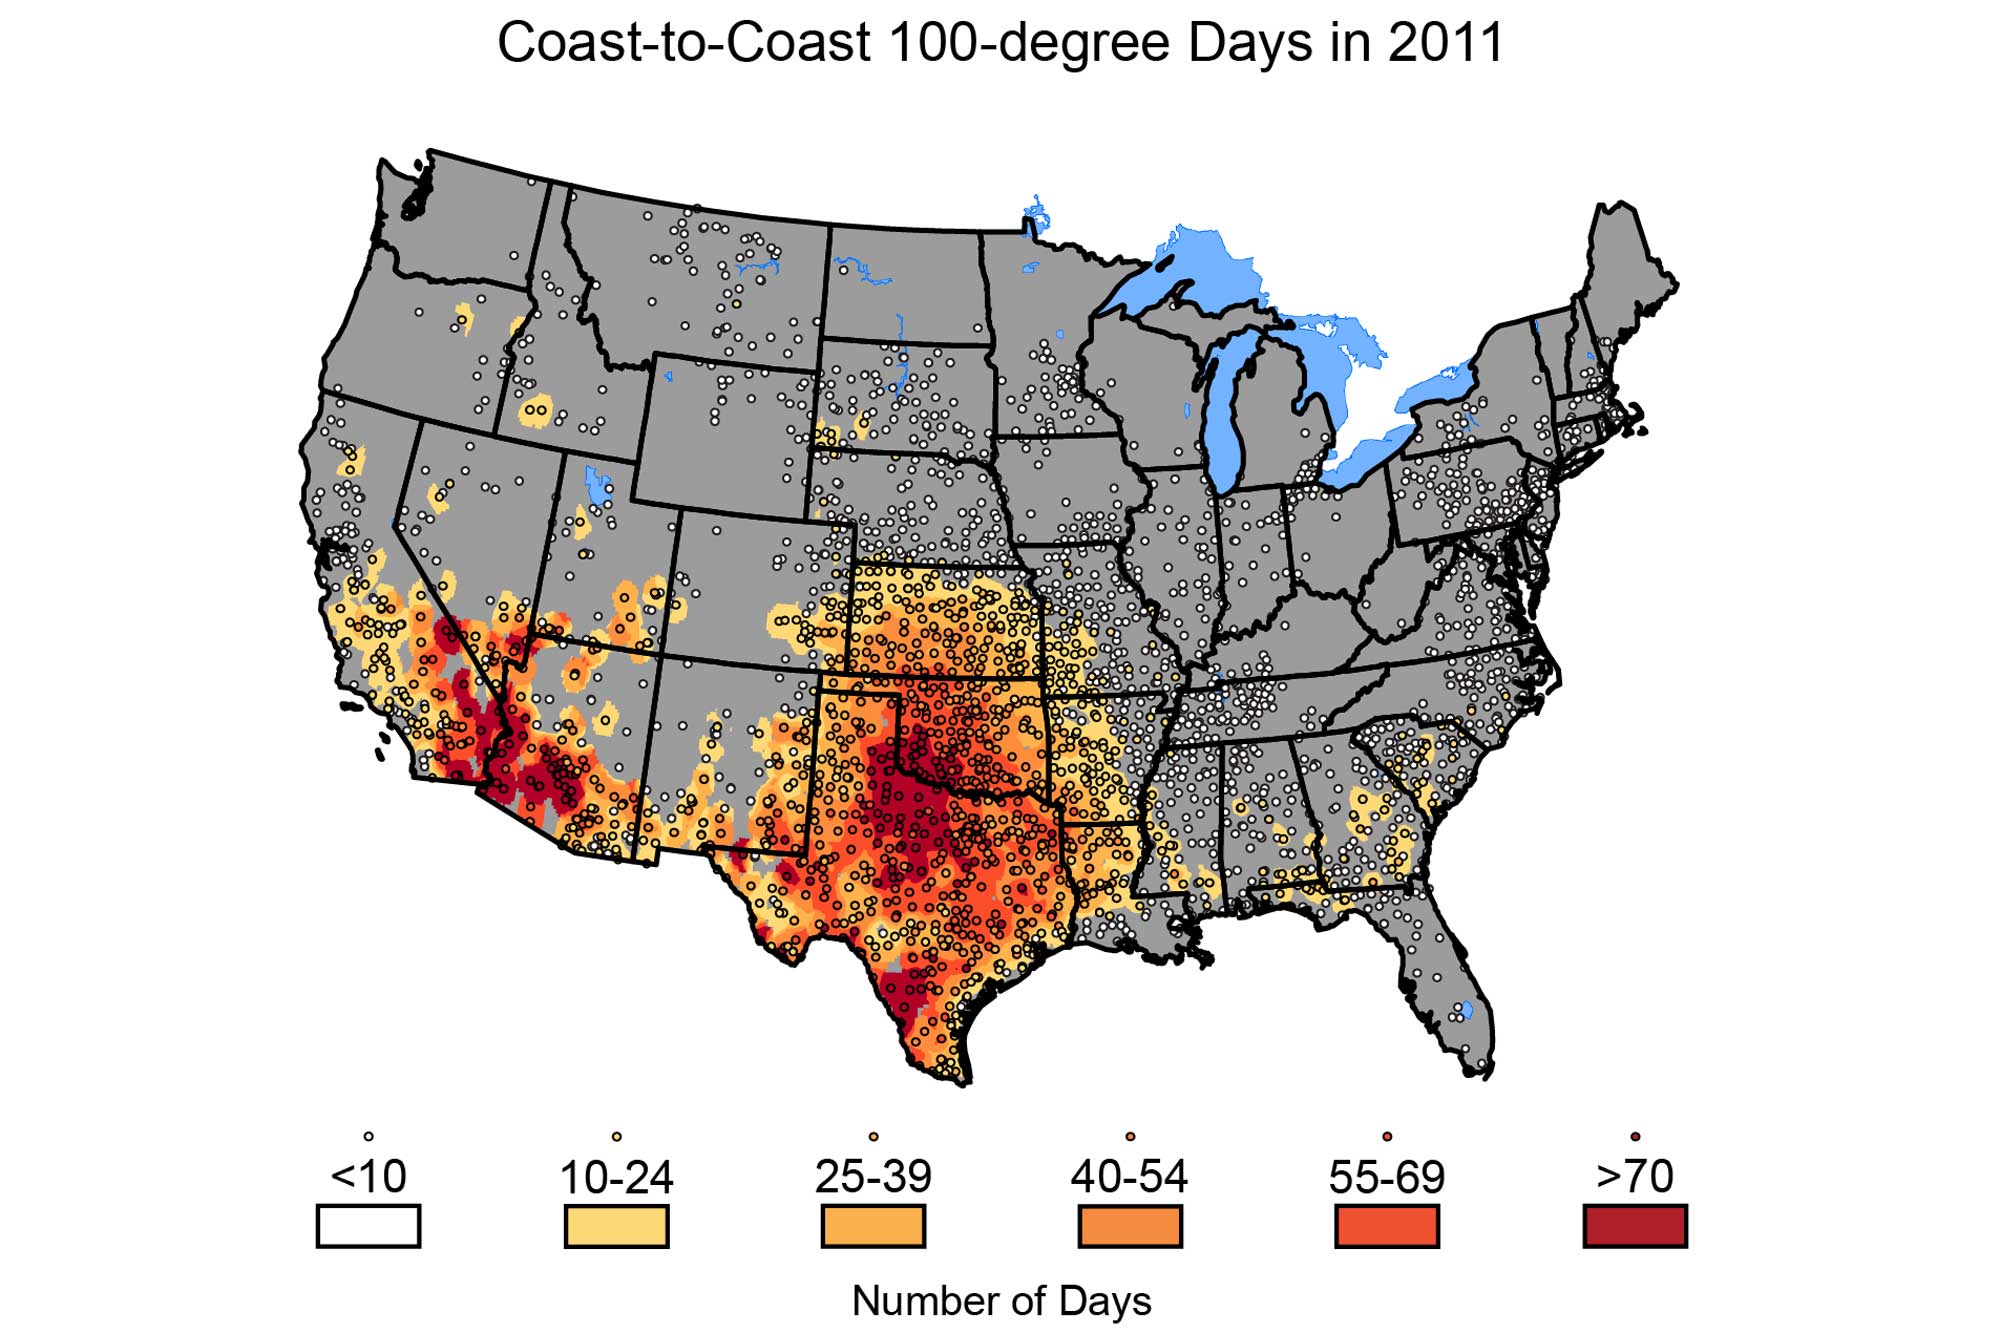
Number of days with temperatures reaching above 100°F during the year 2011. Image by the National Climate Assessment (public domain).
Texas, Oklahoma, and Arkansas took the brunt of the extreme heat, which contributed to severe drought, amplified heat-based health emergencies, and caused a heavy spike in electricity usage (related to increased air conditioning use) that generated a record-breaking demand on the power grid and led to increased energy prices.
While high temperatures can be directly dangerous, a larger scale hazard arises when these temperatures are coupled with lack of precipitation in an extended drought period. Many significant droughts have occurred in the South-Central states. Most famously, high temperature and drought in the 1930s, combined with deep plowing that removed moisture-trapping grasses, led to the Dust Bowl— dust storms that carried vast clouds of black dust across the Midwest and eastern US, greatly damaging both the ecology and agriculture across that portion of the country.
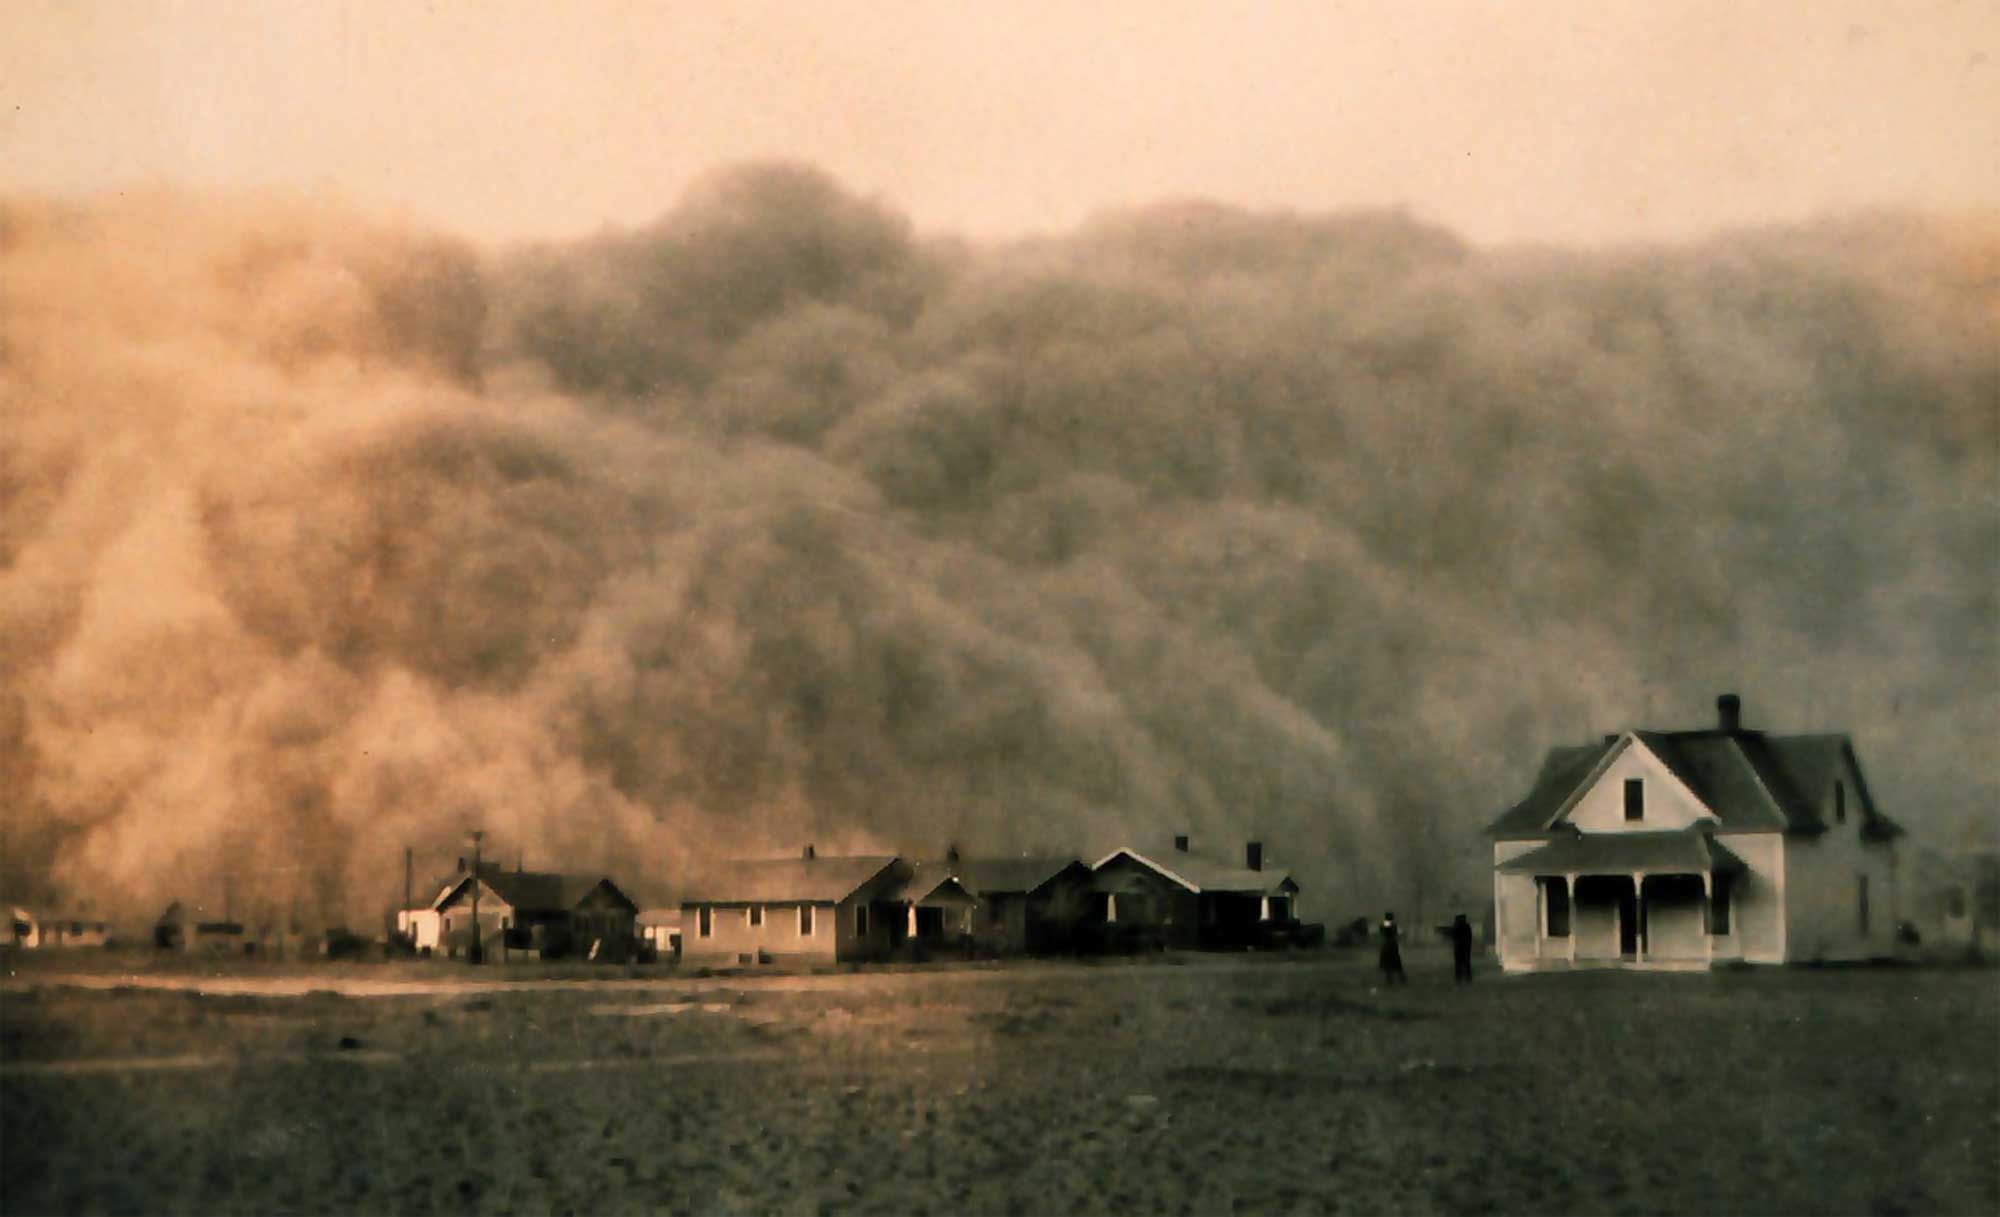
A dust storm approaching the town of Stratford, Texas during the Dust Bowl in 1935. Photograph by George E. Marsh (Wikimedia Commons; public domain).
The Dust Bowl, which was most intense in the panhandles of Texas and Oklahoma and also affected adjoining parts of Kansas, New Mexico, and Colorado, displaced 3.5 million people.
Texas experienced a seven-year record drought in the 1950s, and the lowest average statewide rainfall record was set in Texas as recently as 2011. That year, nearly the entire state was categorized as experiencing “exceptional drought,” the highest of the five drought levels recognized by NOAA’s U.S. Drought Monitor. Today, much of the South Central is still experiencing moderate to extreme drought, with exceptional drought still occurring in some areas of Texas and Oklahoma.
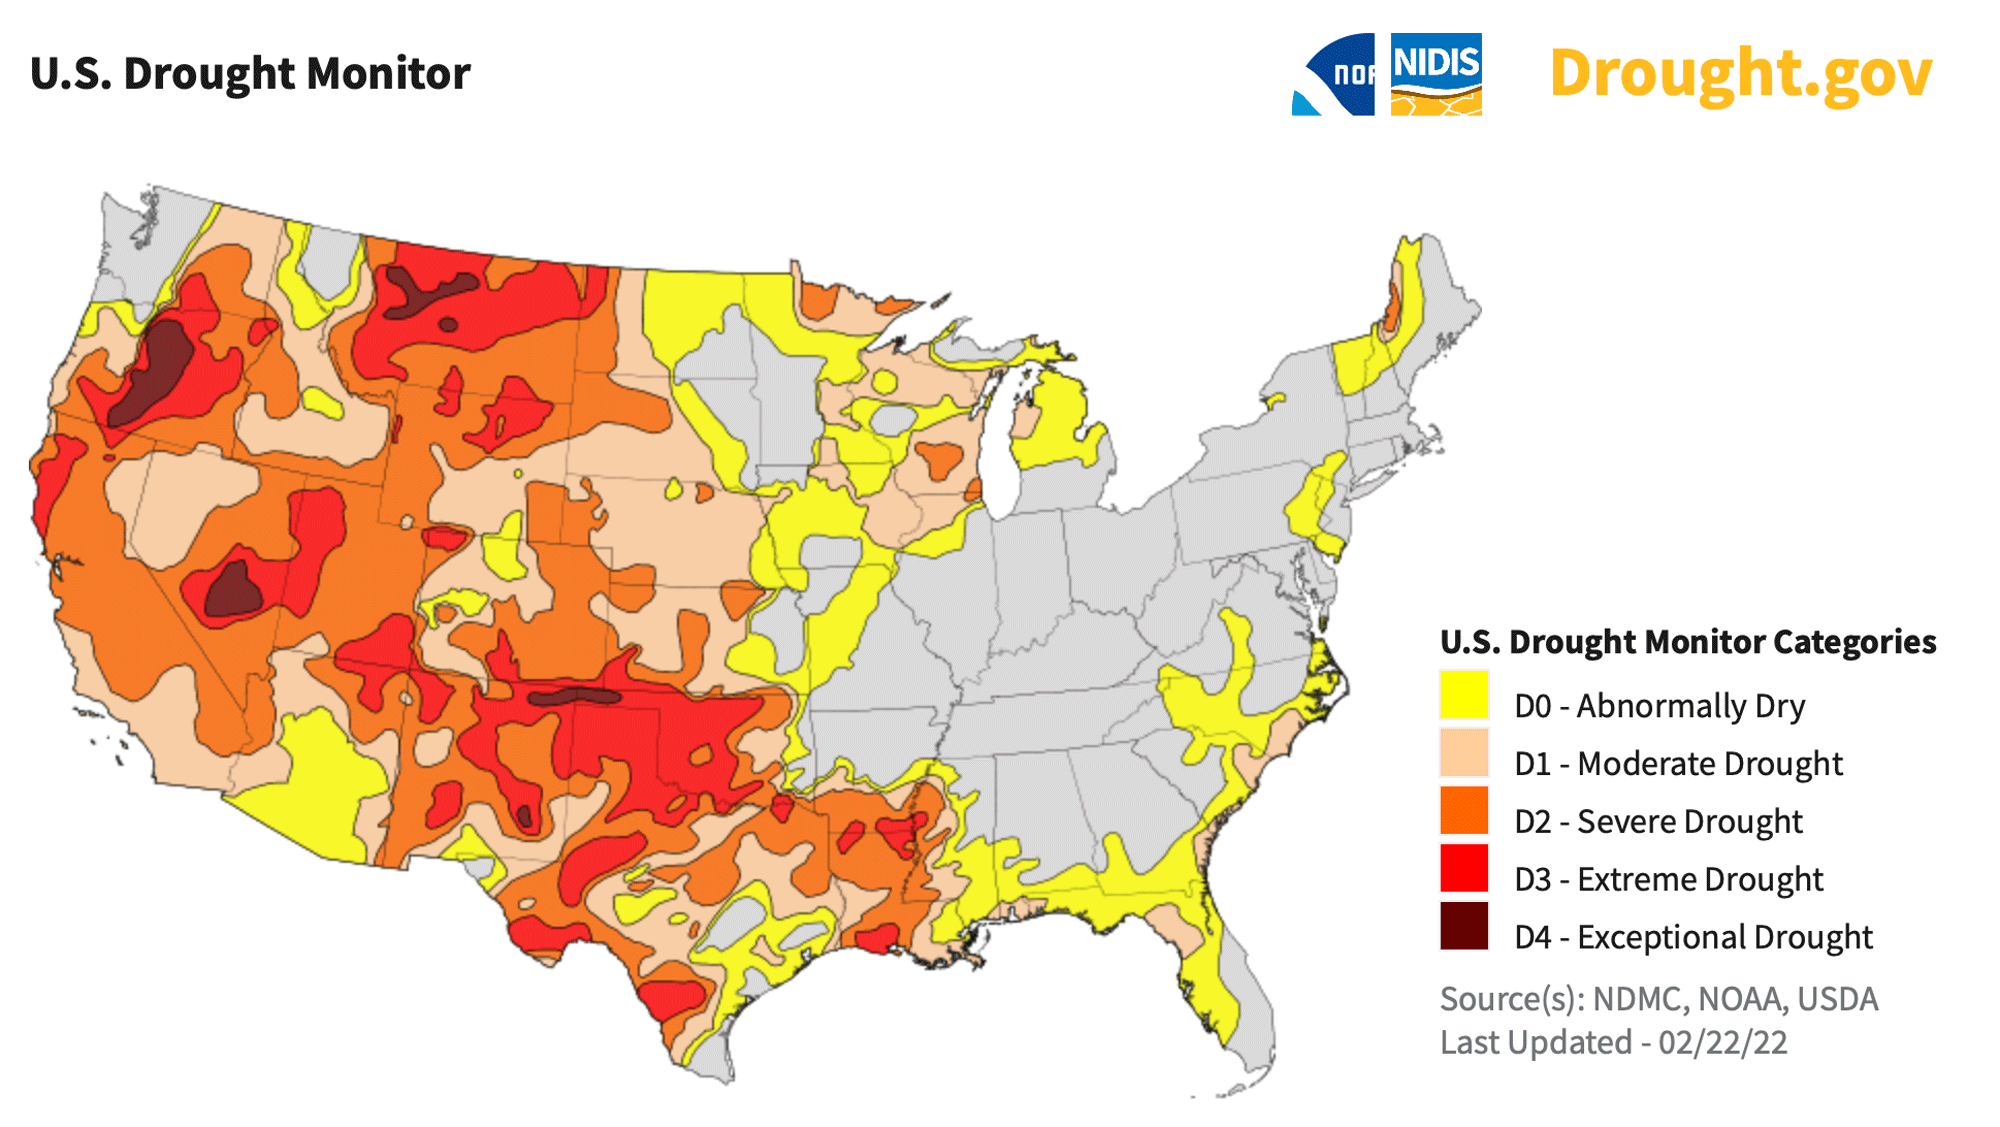
Drought severity in the continental United States as of February 25, 2022. Modified from map available at drought.gov (public domain).
Climate change
It is important to understand that most of the extreme climate change in Earth’s history occurred before humans existed. That being said, the rapid release of carbon dioxide into the atmosphere from human activity is currently causing a global warming event. The warmest overall average state summer tempera-tures in the US are generally found in the South Central (primarily in Oklahoma, Texas, Louisiana, and Arkansas), with the warmest years averaging 28 to 30°C (83 to 86°F) and occasional weeks with maximum temperatures above 37.8°C (100°F). For the last 25 years, these temperature averages have been steadily rising. This seemingly slight increase has been accompanied by more frequent heat waves, shorter winters, and an increased likelihood of drought and wildfires.
The South Central is currently experiencing significant drought throughout, with the worst effects occurring in Texas and Oklahoma (see map above). Increased dryness contributes to fire risk—in March 2015, the area northeast of Woodward, Oklahoma experienced a wildfire that consumed more than 9600 hectares (23,000 acres) of land and forced over 125 people to evacuate from their homes. During the major drought and heat wave of 2011, more than 31,000 separate wildfires raged through central Texas, burning a cumulative 1,559,446 hectares (3,853,475 acres) of land and destroying almost 6000 structures.
Water supply is also a critical issue for the South-Central states. Much of the area obtains its agricultural and drinking water from aquifers, underground layers of water-bearing permeable rock. The Ogalalla aquifer, part of the High Plains aquifer system, supplies vast quantities of groundwater to Texas, Oklahoma, Kansas, and Nebraska. As drought intensifies and temperature rises, the amount of water drawn from the aquifer (especially for agricultural irrigation) has increased, while the rate at which the aquifer refills has decreased. The aquifer’s average water level has dropped by about 4 meters (13 feet) since 1950, and in some areas of heavy use, the decrease is as high as 76 meters (250 feet).
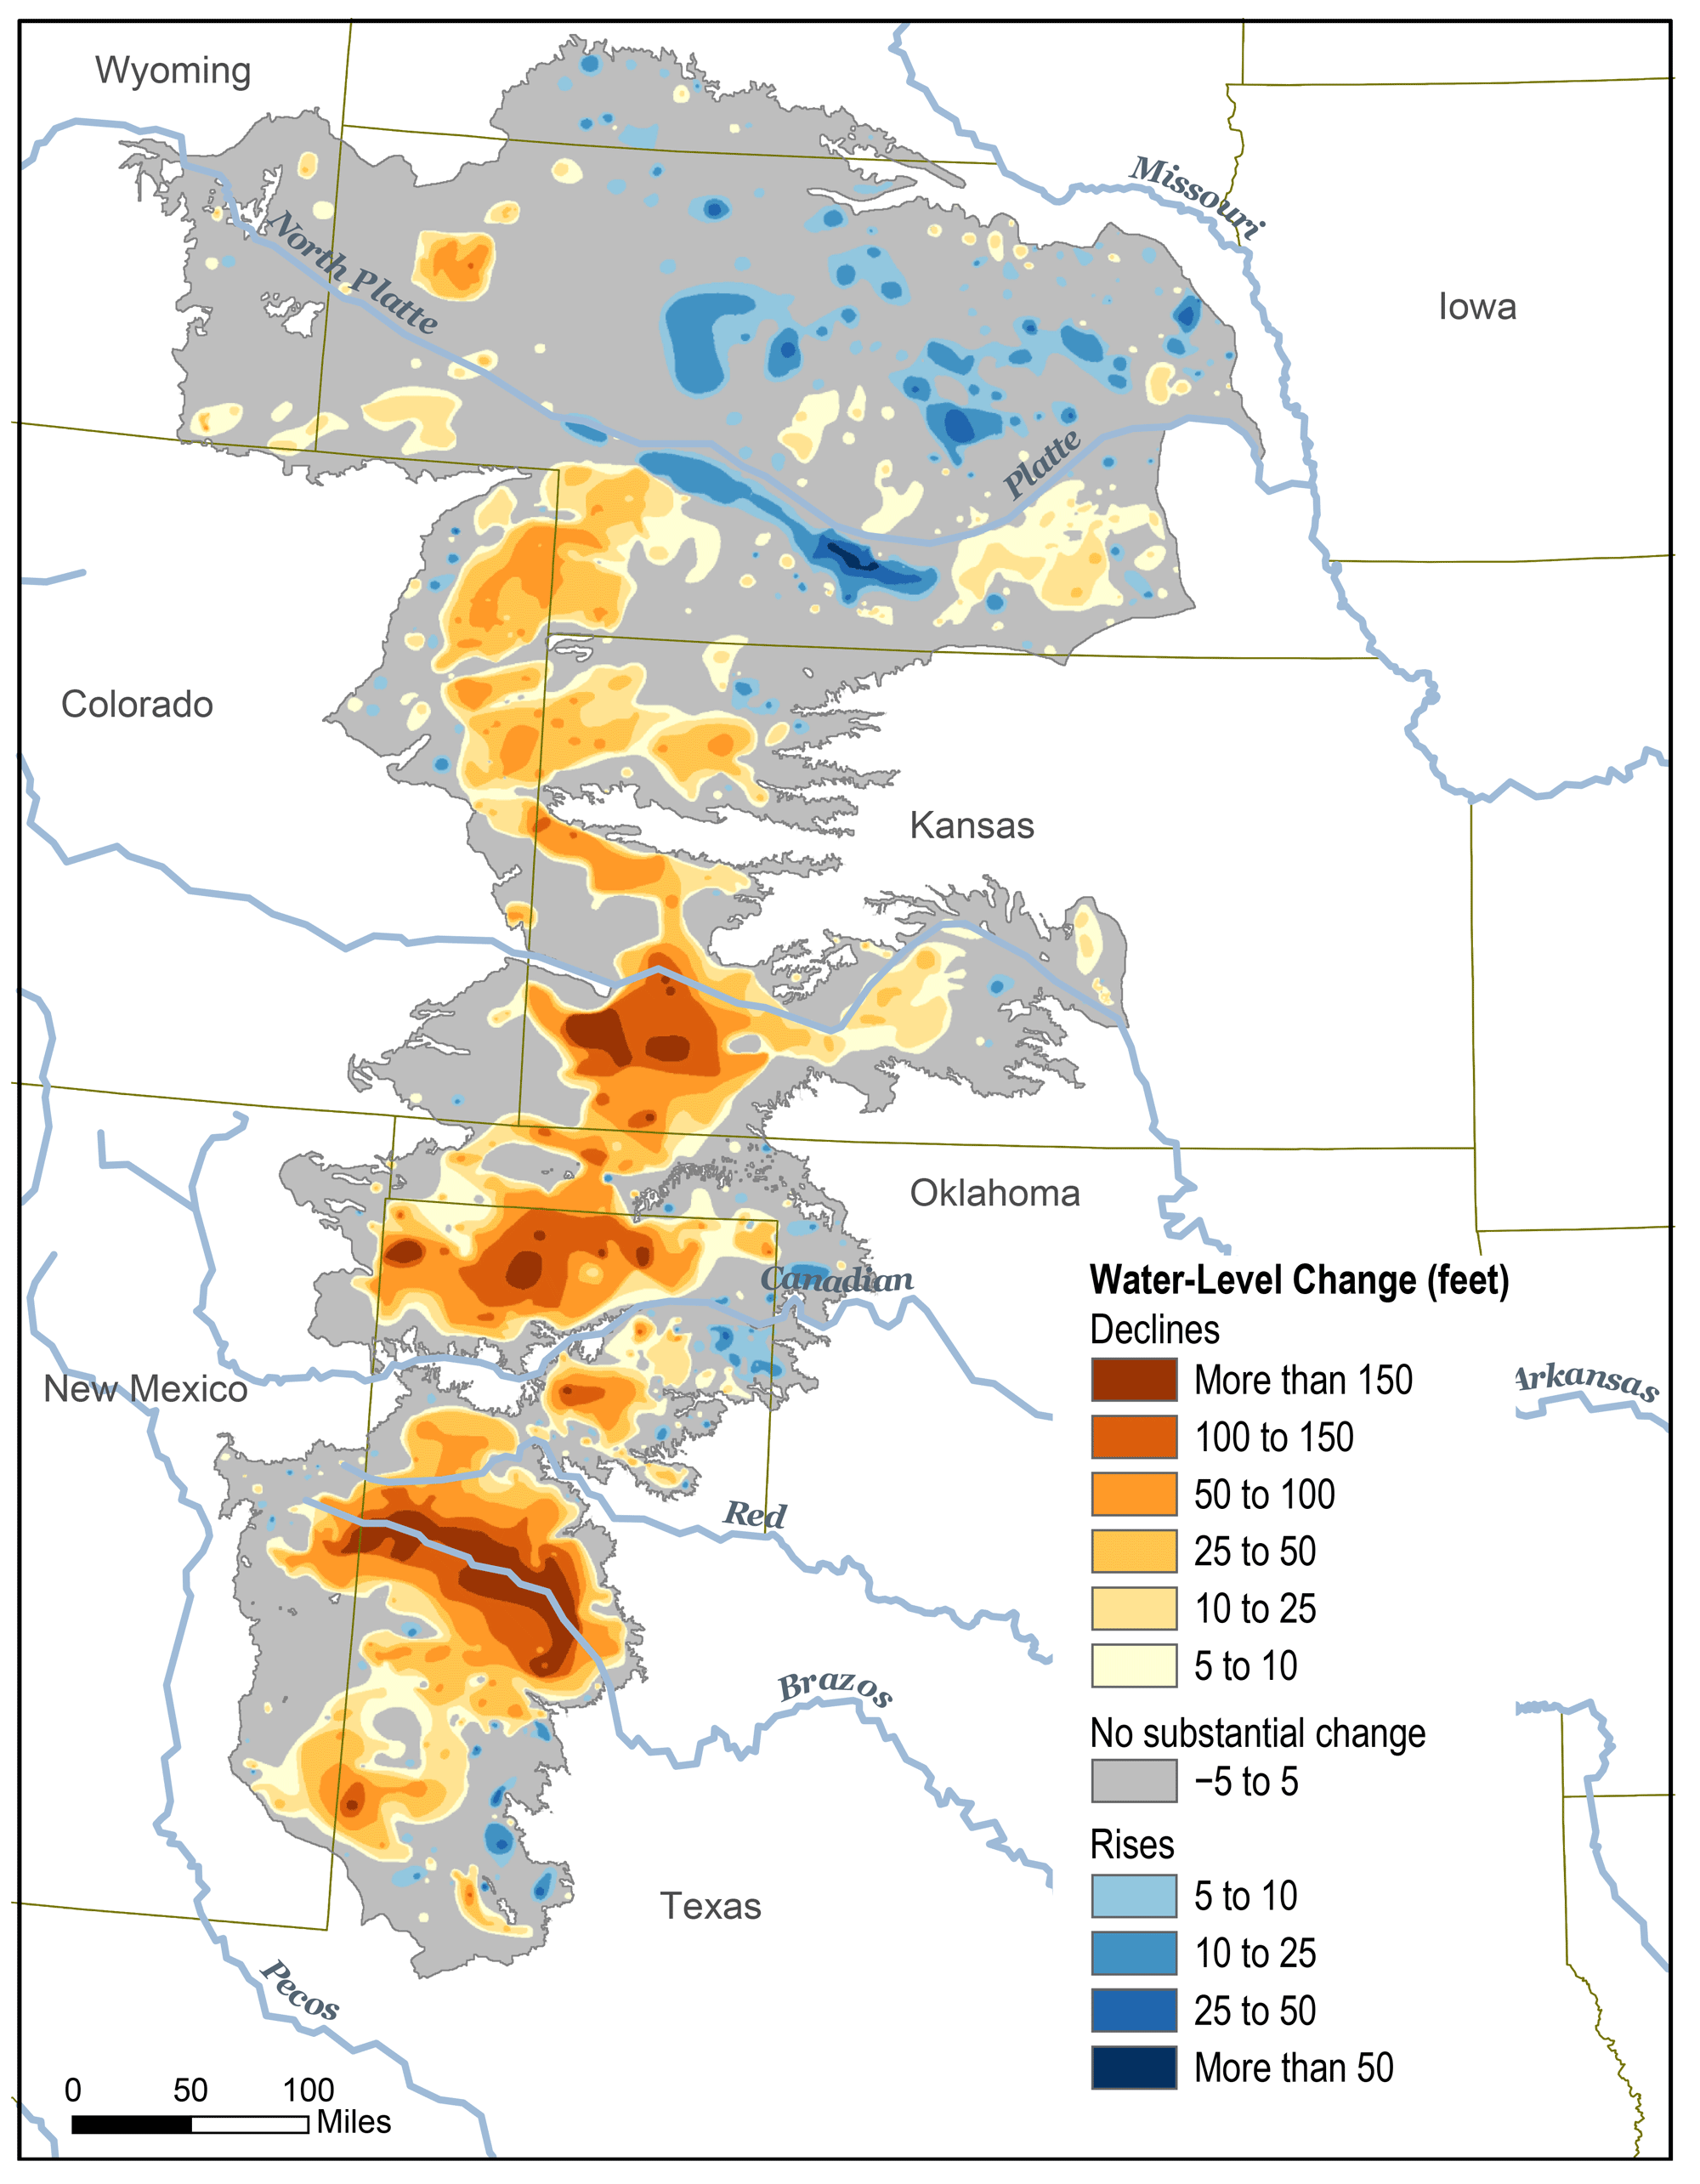
Changes in water level of the Ogalalla Aquifer from before being tapped up to 2015. Image by Michon Scott and climate.gov (public domain).
However, the aquifer only replenishes at a rate no greater than 150 millimeters (6 inches) per year. Some estimates indicate that at its current rate of use, the entire Ogalalla aquifer could be depleted by as early as 2028, threatening human lives, our food supply, and the entire Great Plains ecosystem.
Increasing temperatures also allow certain pests, such as ticks and mosquitoes, to live longer, thereby increasing the risk of contracting the diseases they carry. In addition, invasive organisms that damage ecosystems, such as the hydrilla plant in Louisiana, have a better chance to multiply and outcompete native organisms because increased temperatures stress local ecosystems and create an environment more favorable to invasive species.
Another concern regarding hazards exacerbated by climate change in the South-Central United States is whether there has been or will be an increase in the number or severity of storms, such as hurricanes and tornados. According to NASA, the present data is inconclusive in terms of whether hurricanes are already more severe, but there is a greater than 66% chance that global warming will cause more intense hurricanes in the 21st century. Since climate is a measure of weather averaged over decades, it might take many years to determine that a change has occurred with respect to these types of storms. Scientists are certain that the conditions necessary to form such storms are becoming more favorable due to global warming.
Resources
Resources from the Paleontological Research Institution
Earth@Home: Here on Earth: Introduction to Earth Hazards: https://earthathome.org/hoe/hazards/