

Page snapshot: Introduction to energy of the midwestern United States, including fossil fuels, renewable energy, and nuclear power in the Superior Upland, Central Lowland, and Inland Basin regions.
Topics covered on this page: Overview; Oil and gas; Oil; Gas; Frac sand mining; Produced water (wastewater) disposal; Coal; Coal in the Central Lowland; Coal in the Inland Basin; Acid mine drainage; Wind energy; Biofuels; Nuclear power; Resources.
Credits: Most of the text of this page comes from "Energy in the Midwestern US" by Carlyn S. Buckler, chapter 7 in The Teacher-Friendly Guide to the Earth Science of the Midwestern US, edited by Mark D. Lucas, Robert M. Ross, and Andrielle N. Swaby (published in 2014 by the Paleontological Research Institution; currently out of print). The book was adapted for the web by Elizabeth J. Hermsen and Jonathan R. Hendricks in 2022. Changes include formatting and revisions to the text and images. Credits for individual images are given in figure captions.
Updates: Page last updated October 12, 2022.
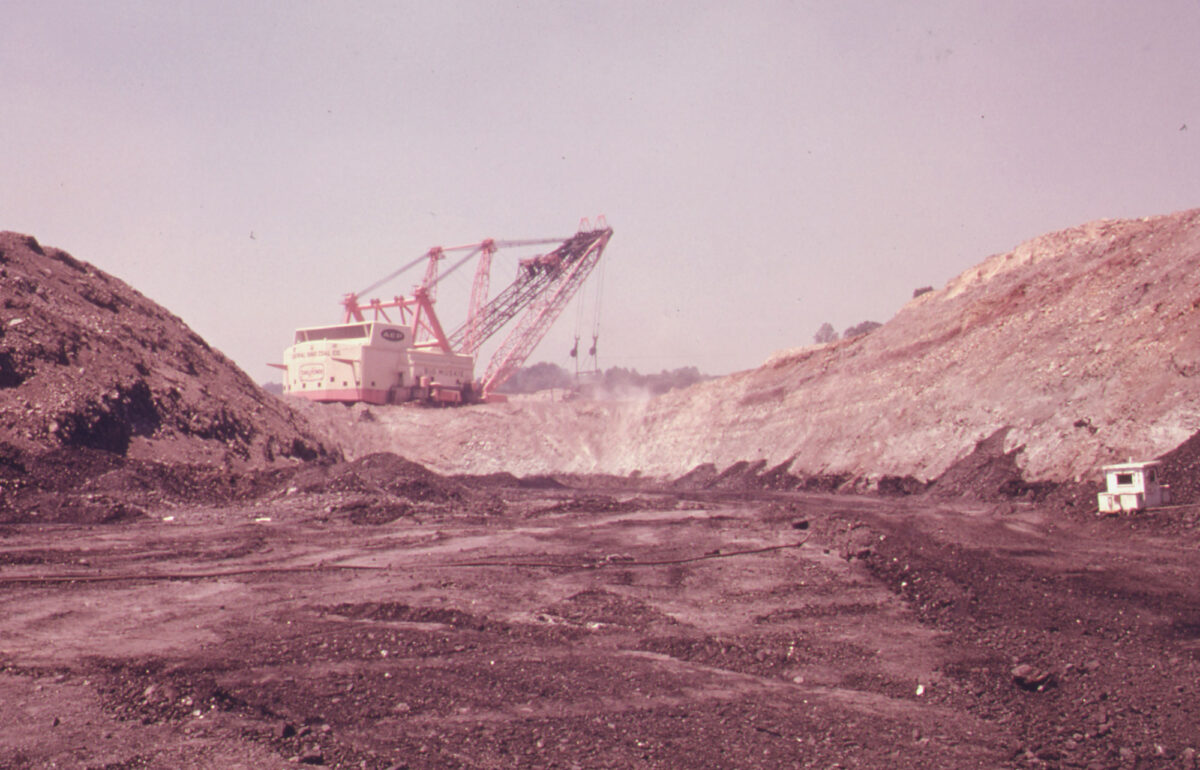
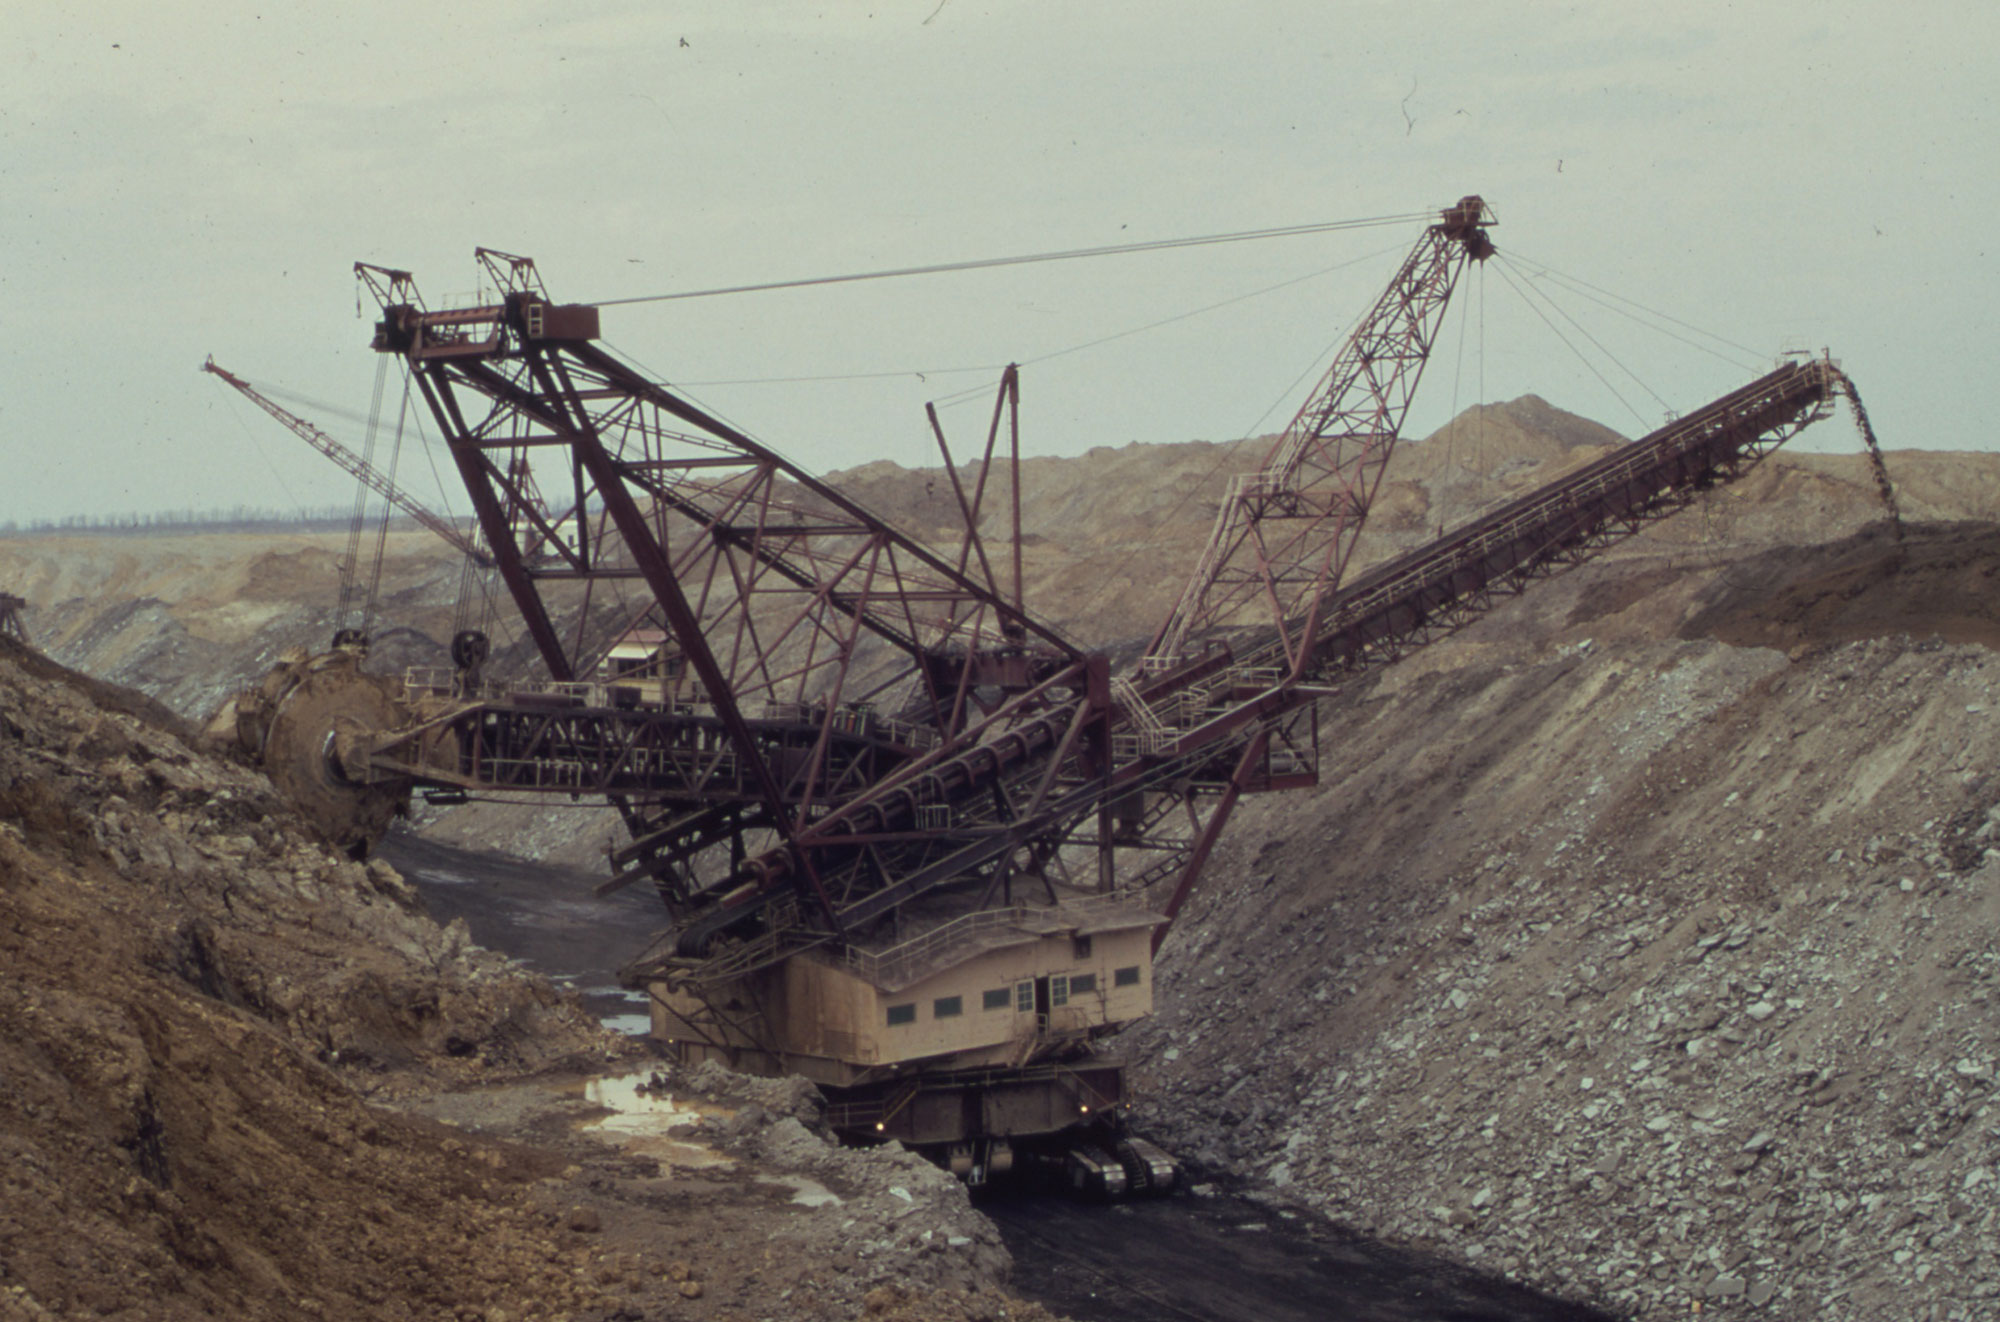
Image above: "Big Muskie," a large coal shovel, operating in a strip mine near Chandlersville, Ohio, in 1974. According to the original photo caption: "The shovel weighs 13,000 tons and its bucket can hold 12 cars. The machine stands over 20 stories high, picks up 325 tons of earth per scoop and cuts a swath 75 feet wide and 150 feet deep." This machine no longer exists, but "Big Muskie's Bucket," the bucket of the shovel, can still be visited in McConnelsville, Ohio. Photo by Eric Caonius, EPA/DOCUMERICA (National Archives Indentifier 555644, unrestricted use).
Overview
The primary energy resources in the Midwest come from fossil fuels. Illinois, Indiana, and Ohio combined represent 13% of the total coal production in the U.S. Illinois was once a major producer of oil, and natural gas production has been increasing in Ohio. Nevertheless, development of renewables has also been increasing.
Energy consumption in the Midwest varies from state to state. Iowa relies on wind to provide more than 50% of its electricity. Illinois, Indiana, Michigan, Wisconsin, and Ohio rely on a mix of nuclear power, coal, and natural gas in varying proportions to meet their electricity needs. In addition to these resources, Illinois and Minnesota each generate more than 10% of their electricity from wind.
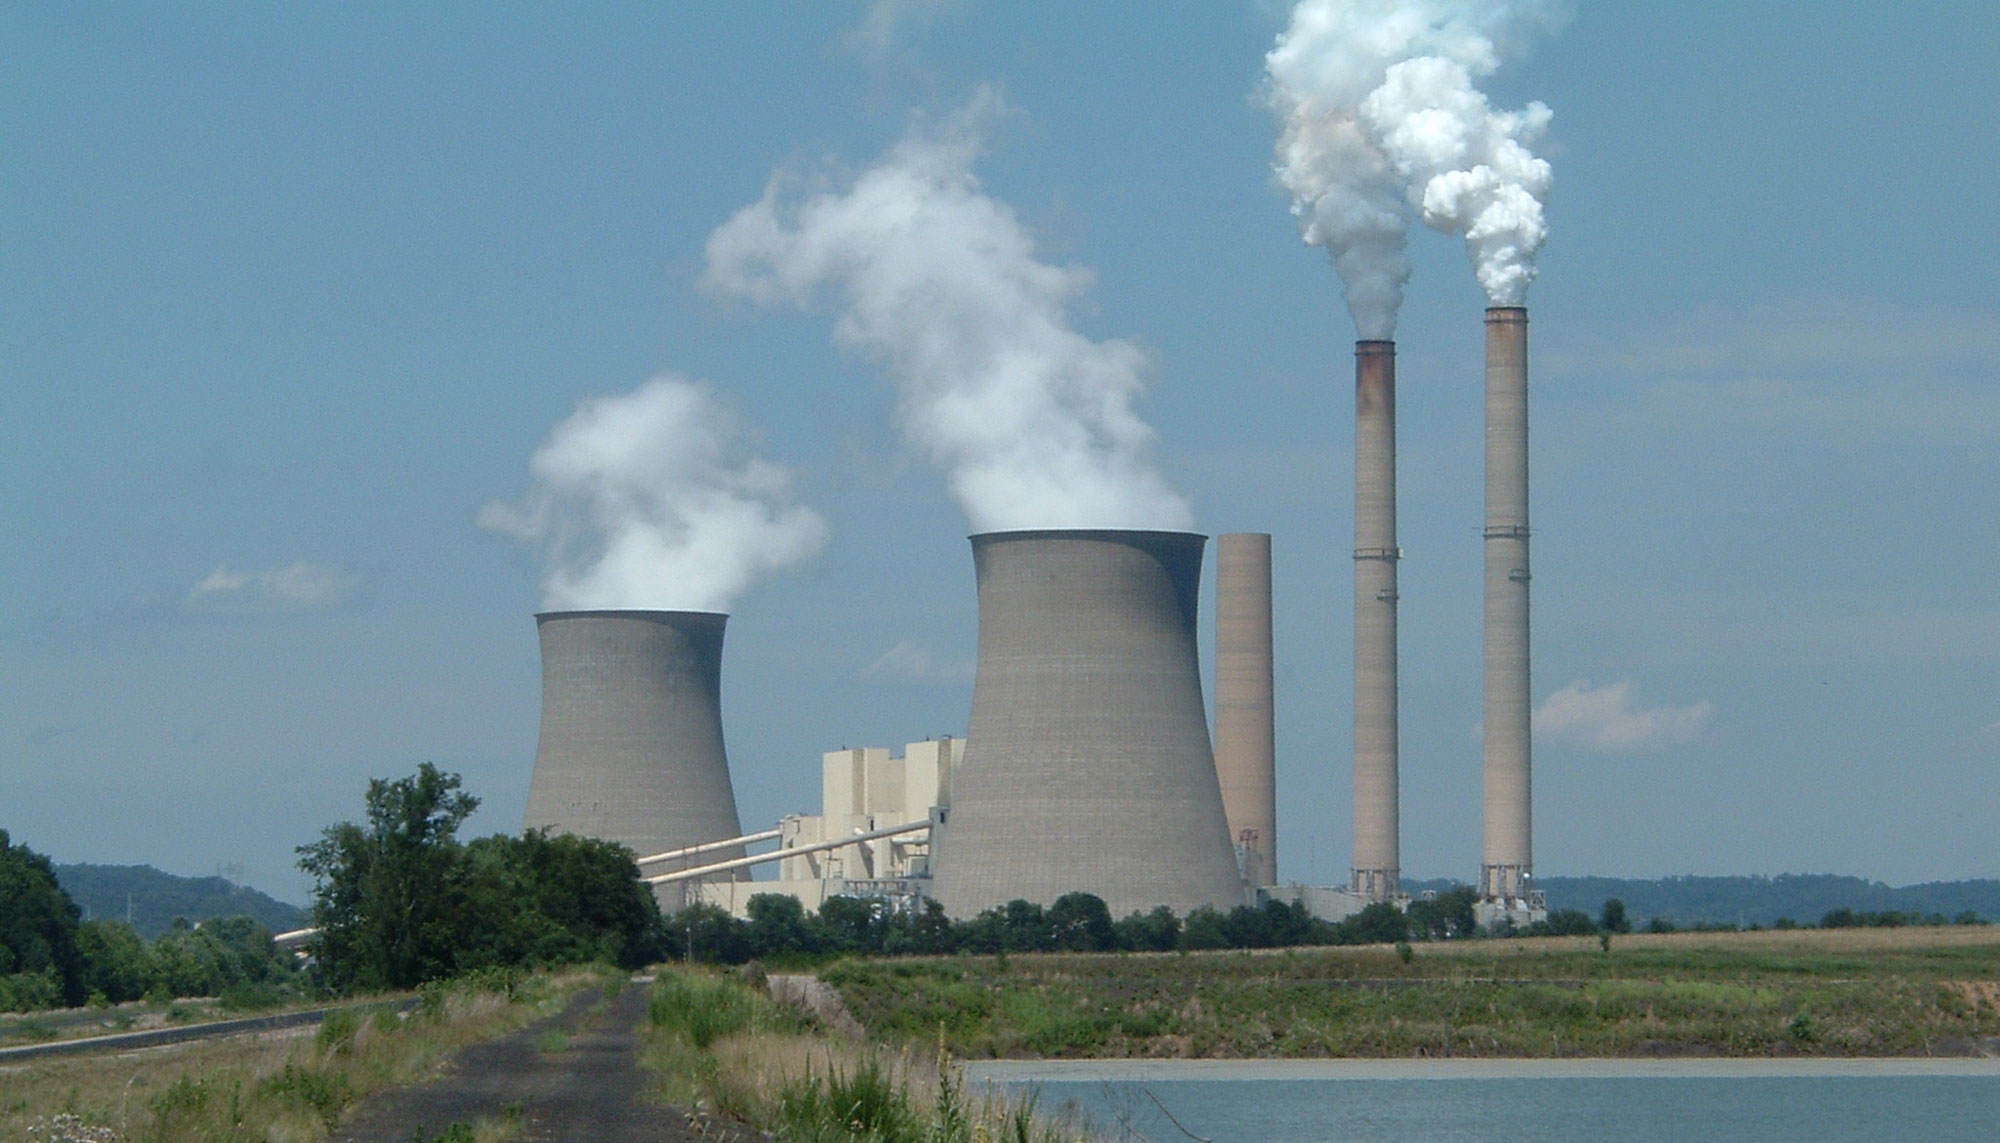
General James M. Gavin Power Plant, a coal-burning plant in Cheshire, Ohio. Photo by Analogue Kid (Wikimedia Commons, Creative Commons Attribution 2.5 Generic license, image cropped and resized).
Oil and gas
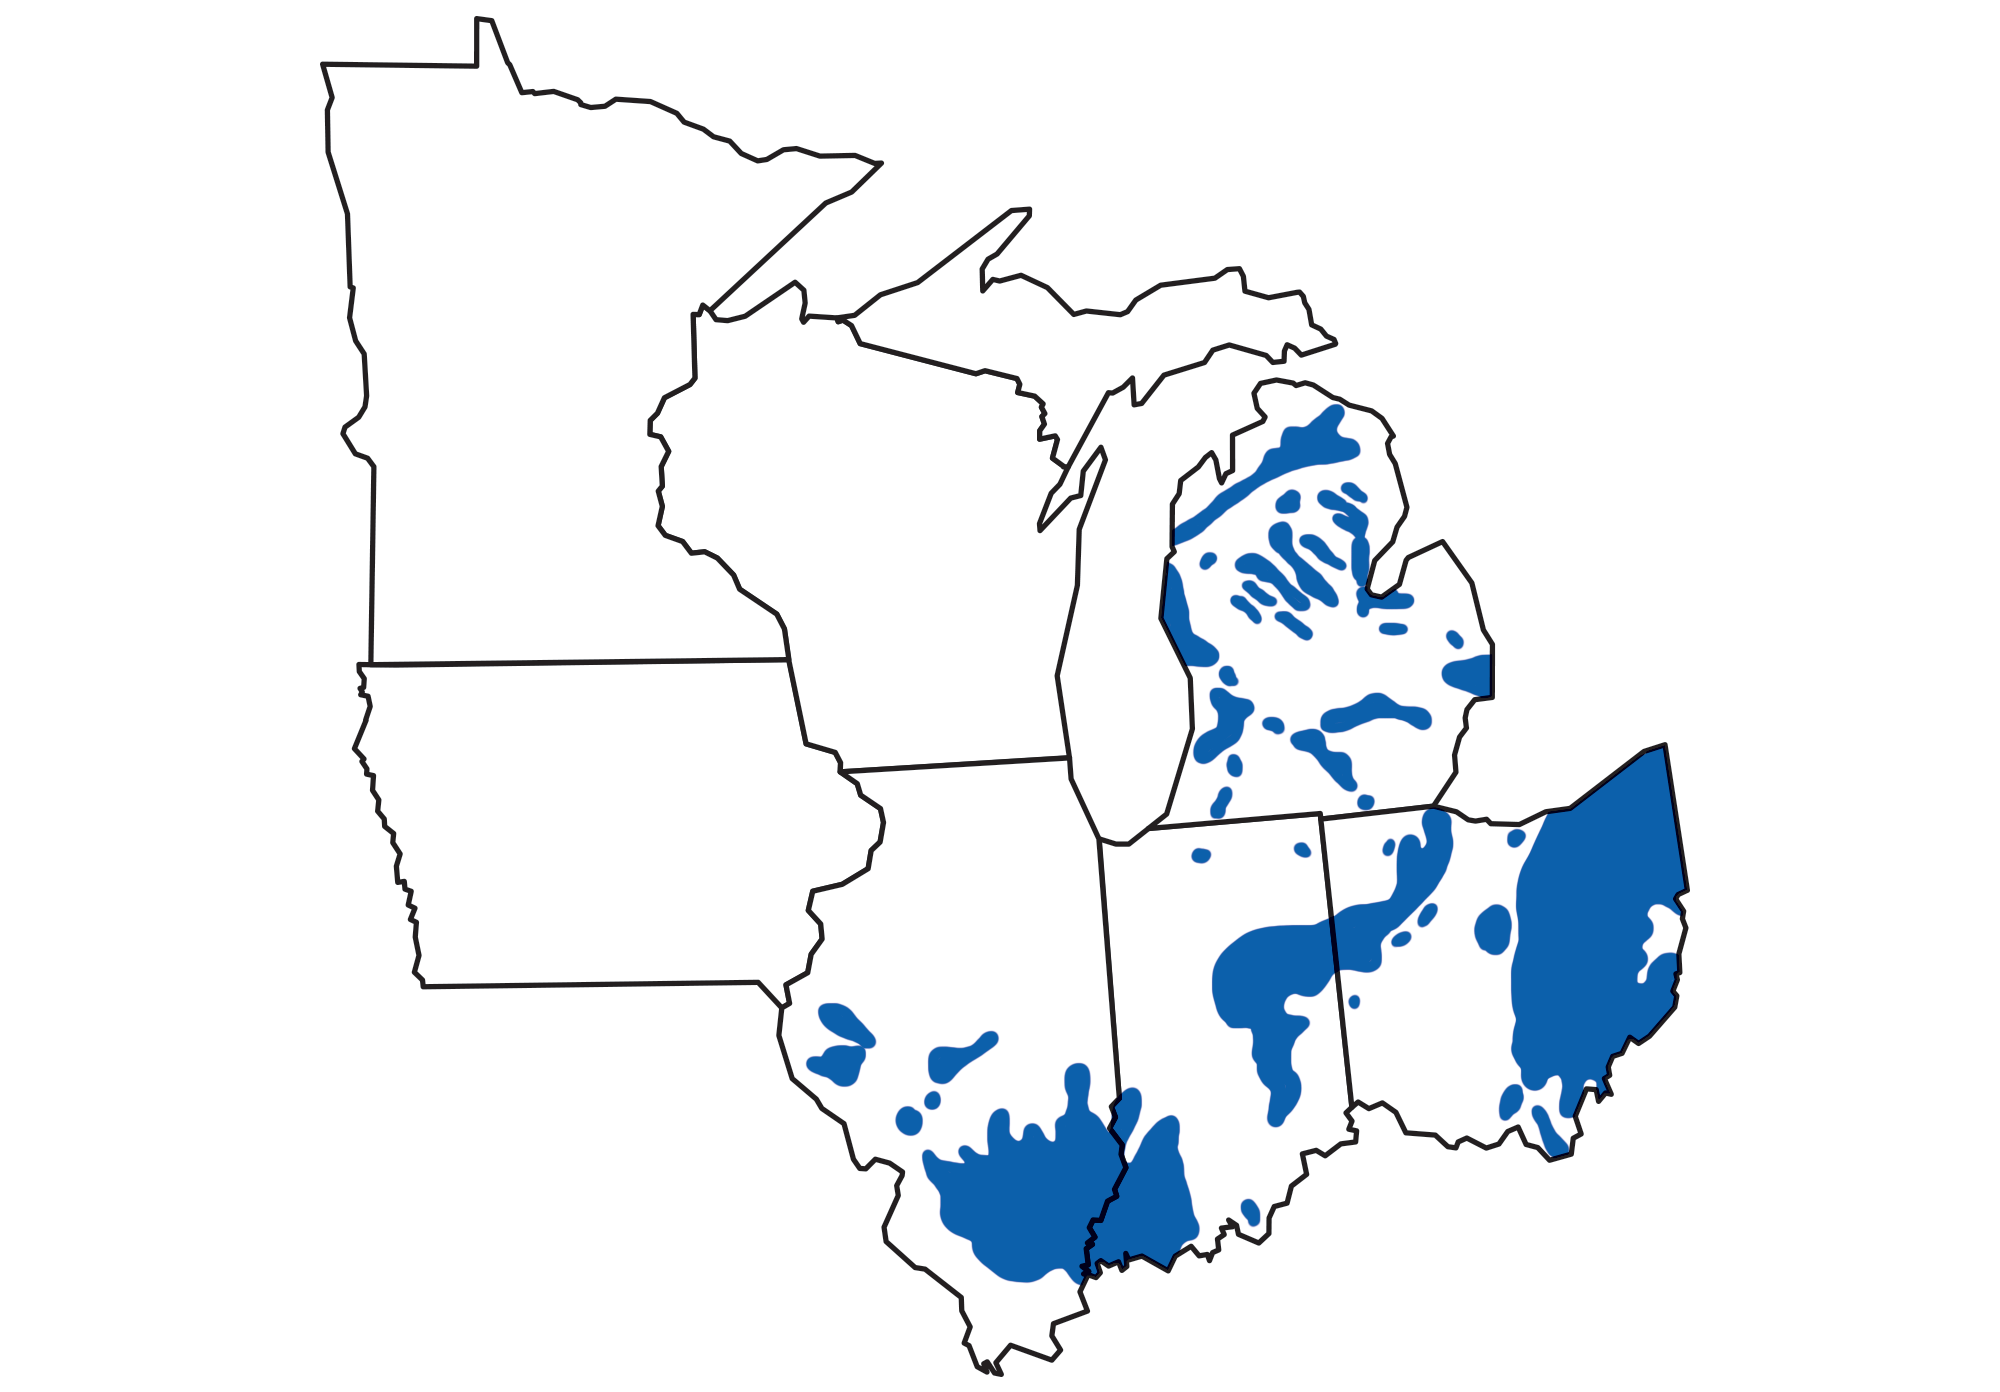
Distribution of oil and gas drilling in the midwestern U.S. Modified from a map by Peter Nester that was originally published in The Teacher-Friendly Guide to the Midwestern US.
Oil
The largest producer of oil in the region is the Illinois Basin, which spans southern Illinois, southwestern Indiana, and northwestern Kentucky. Oil drilling in this basin began in the 1800s, and production peaked in the 1940, when more than 145 million barrels were pumped. Oil is still produced in the region, although most oil wells have a very low yield (about 1.5 barrels of oil each day). Nevertheless, due to the large number of wells, the Illinois Basin generates about 12,000 barrels of oil a year.
The Central Lowland is also a major oil-refining region. The Chicago area has one of the largest oil refineries in the country, with a capacity of nearly one million barrels a day.
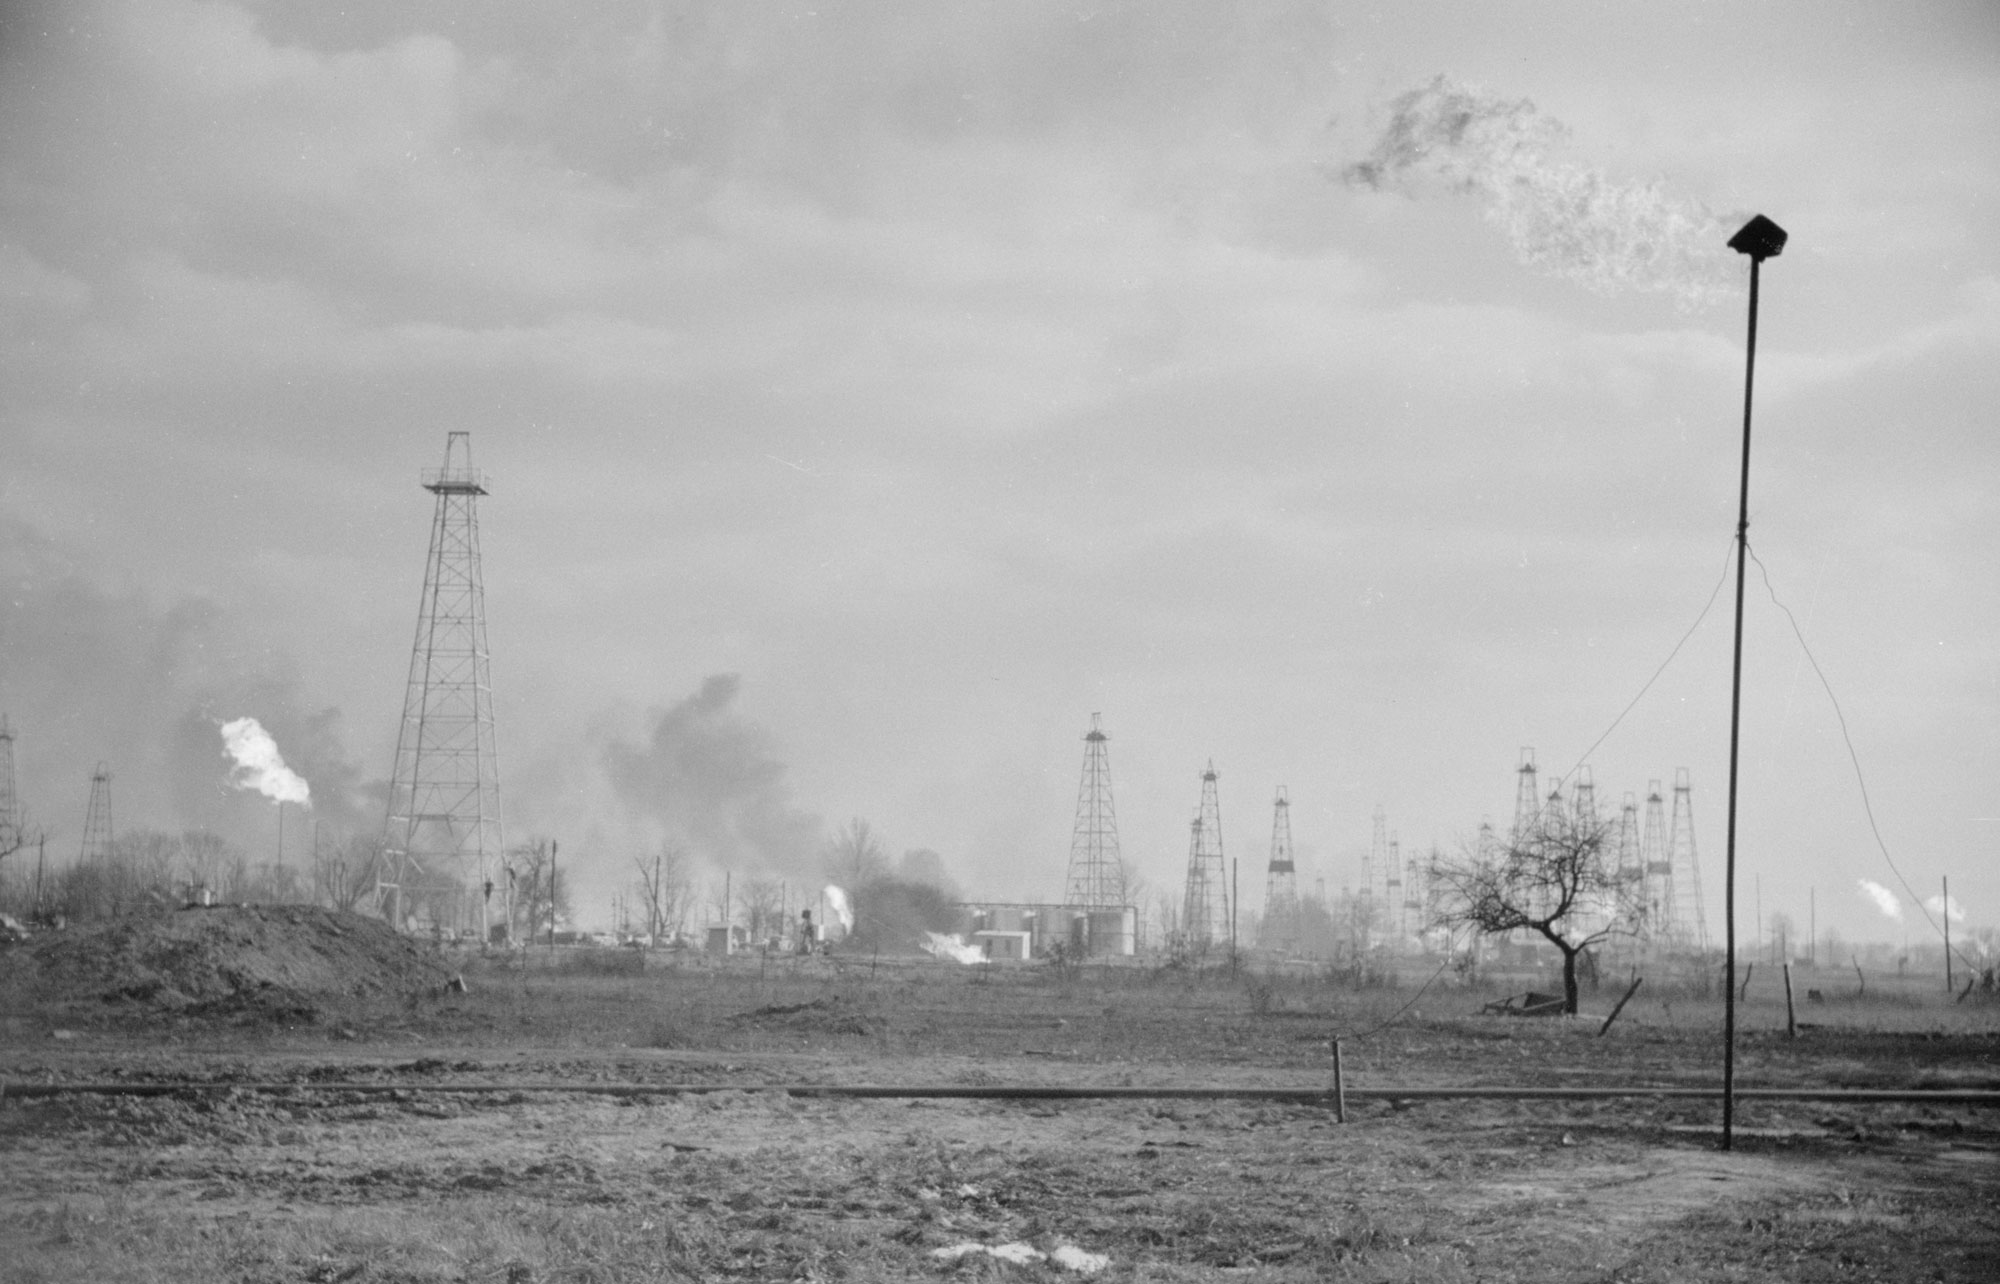
Oil derricks and gas flares in Marion County, Illinois, 1940. Photo by Arthur Rothstein (U.S. Farm Security Administration/Office of War Information, Library of Congress reproduction number LC-USF33-003522-M5, no known restrictions).
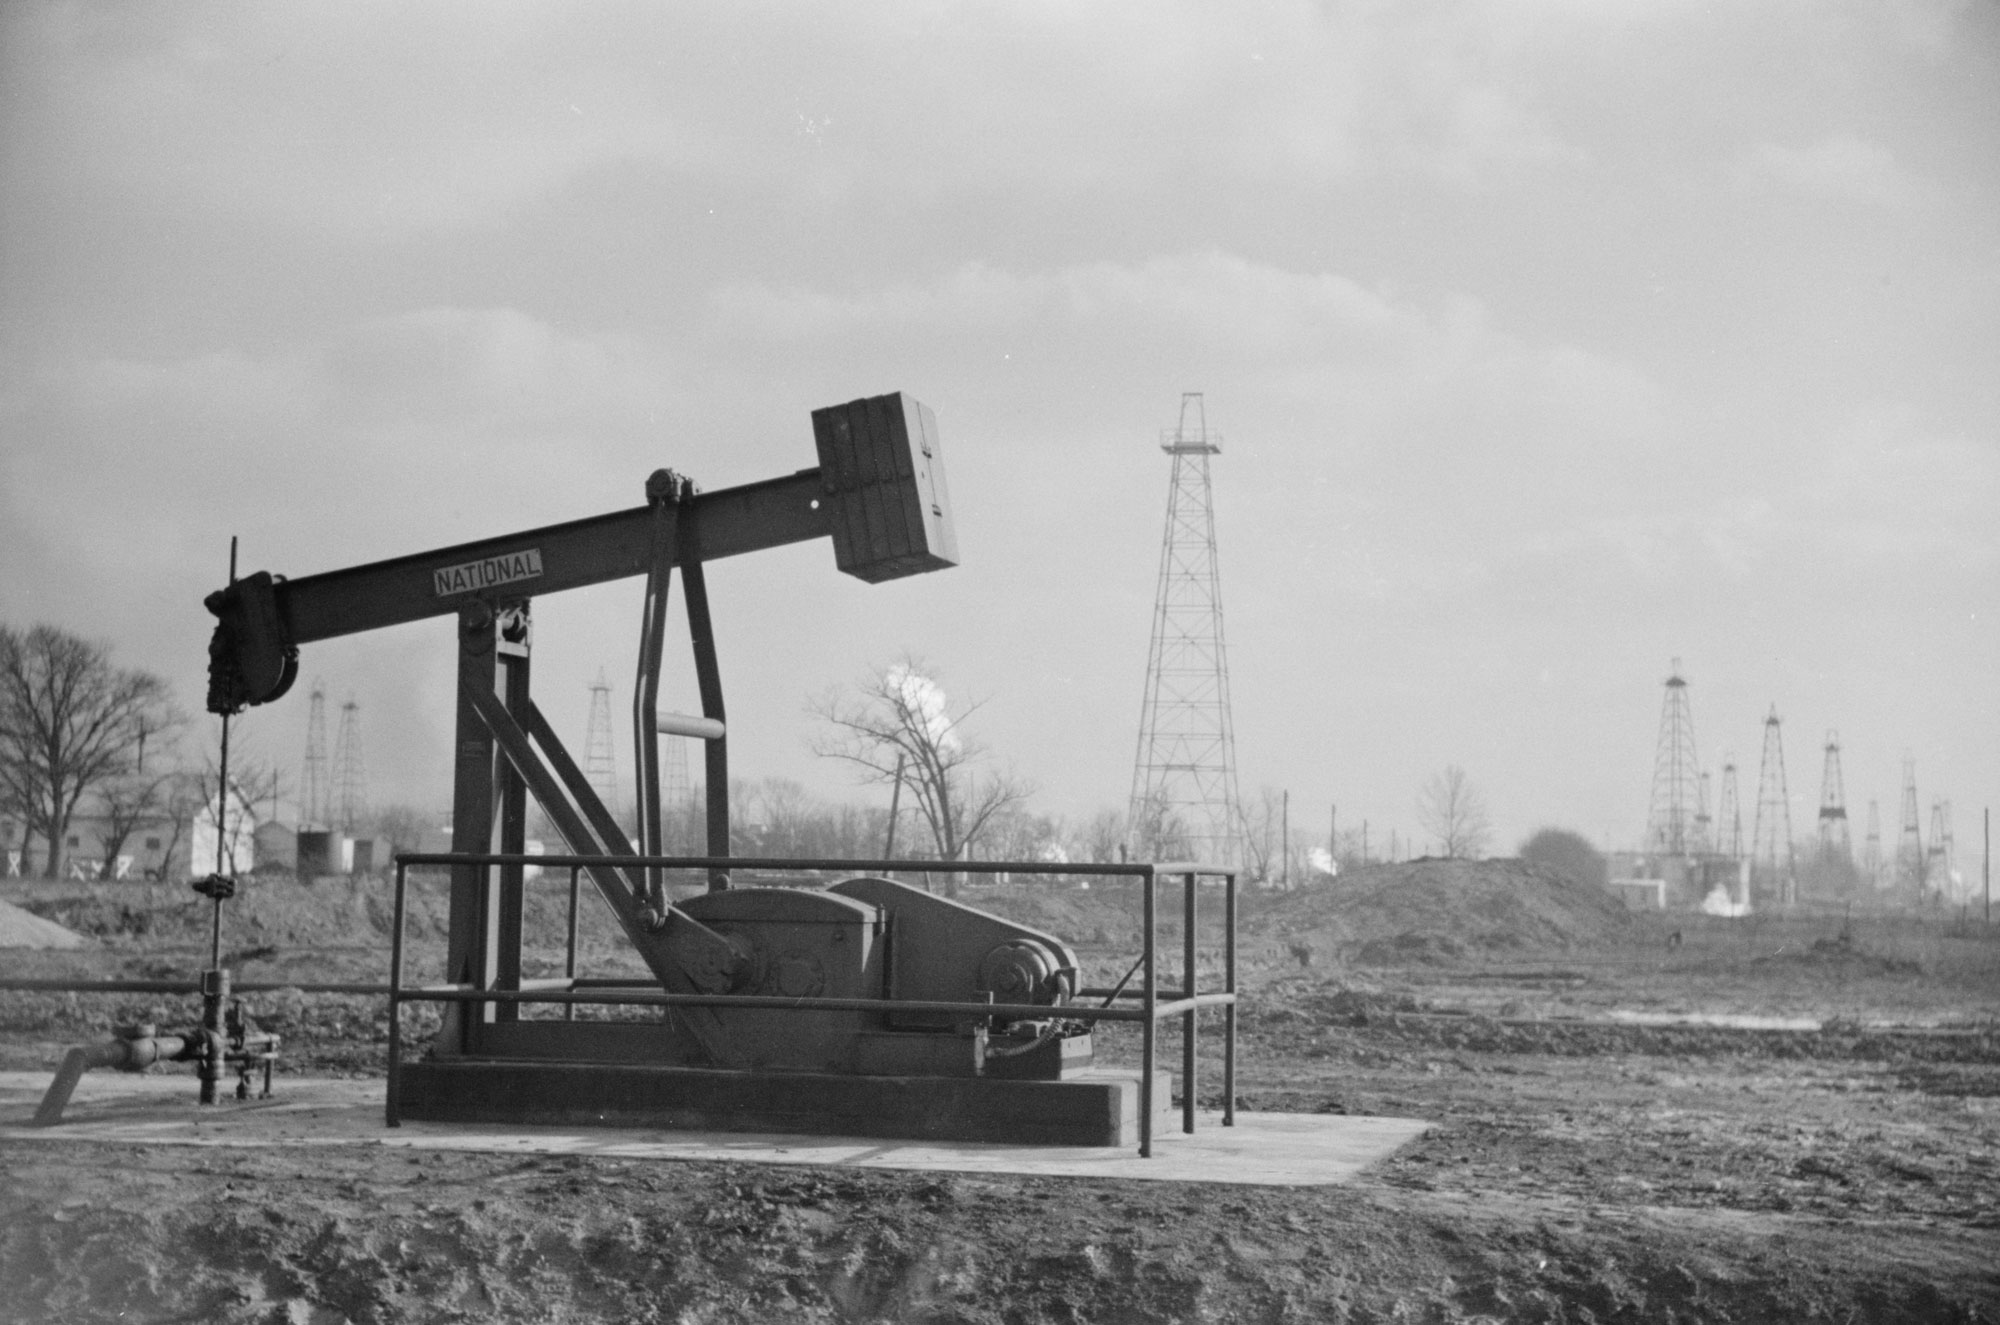
Pumpjack and oil derricks in Marion County, Illinois, 1940. Photo by Arthur Rothstein (U.S. Farm Security Administration/Office of War Information, Library of Congress reproduction number LC-USF33-003524-M1, no known restrictions).
Gas
Michigan increased its gas production in the late 1990s with extraction from Late Devonian period sedimentary rocks of the Antrim Shale, which is part of the Michigan Basin. Gas production is concentrated in the northern part of Michigan's lower peninsula. Michigan produces about 1% of the U.S. total, extracting 300 billion cubic feet of natural gas per year. Natural gas is also produced in Illinois, Indiana, and western Ohio, but not to a significant degree.
Recently, the rate of natural gas production in the eastern Ohio has greatly increased, with gas being extracted from both Appalachian Basin deposits and much older Ordovician period marine deposits. This increase in production has occurred through use of high-volume slick-water hydraulic fracturing ("hydrofracking" or "fracking") in the Utica Formation.
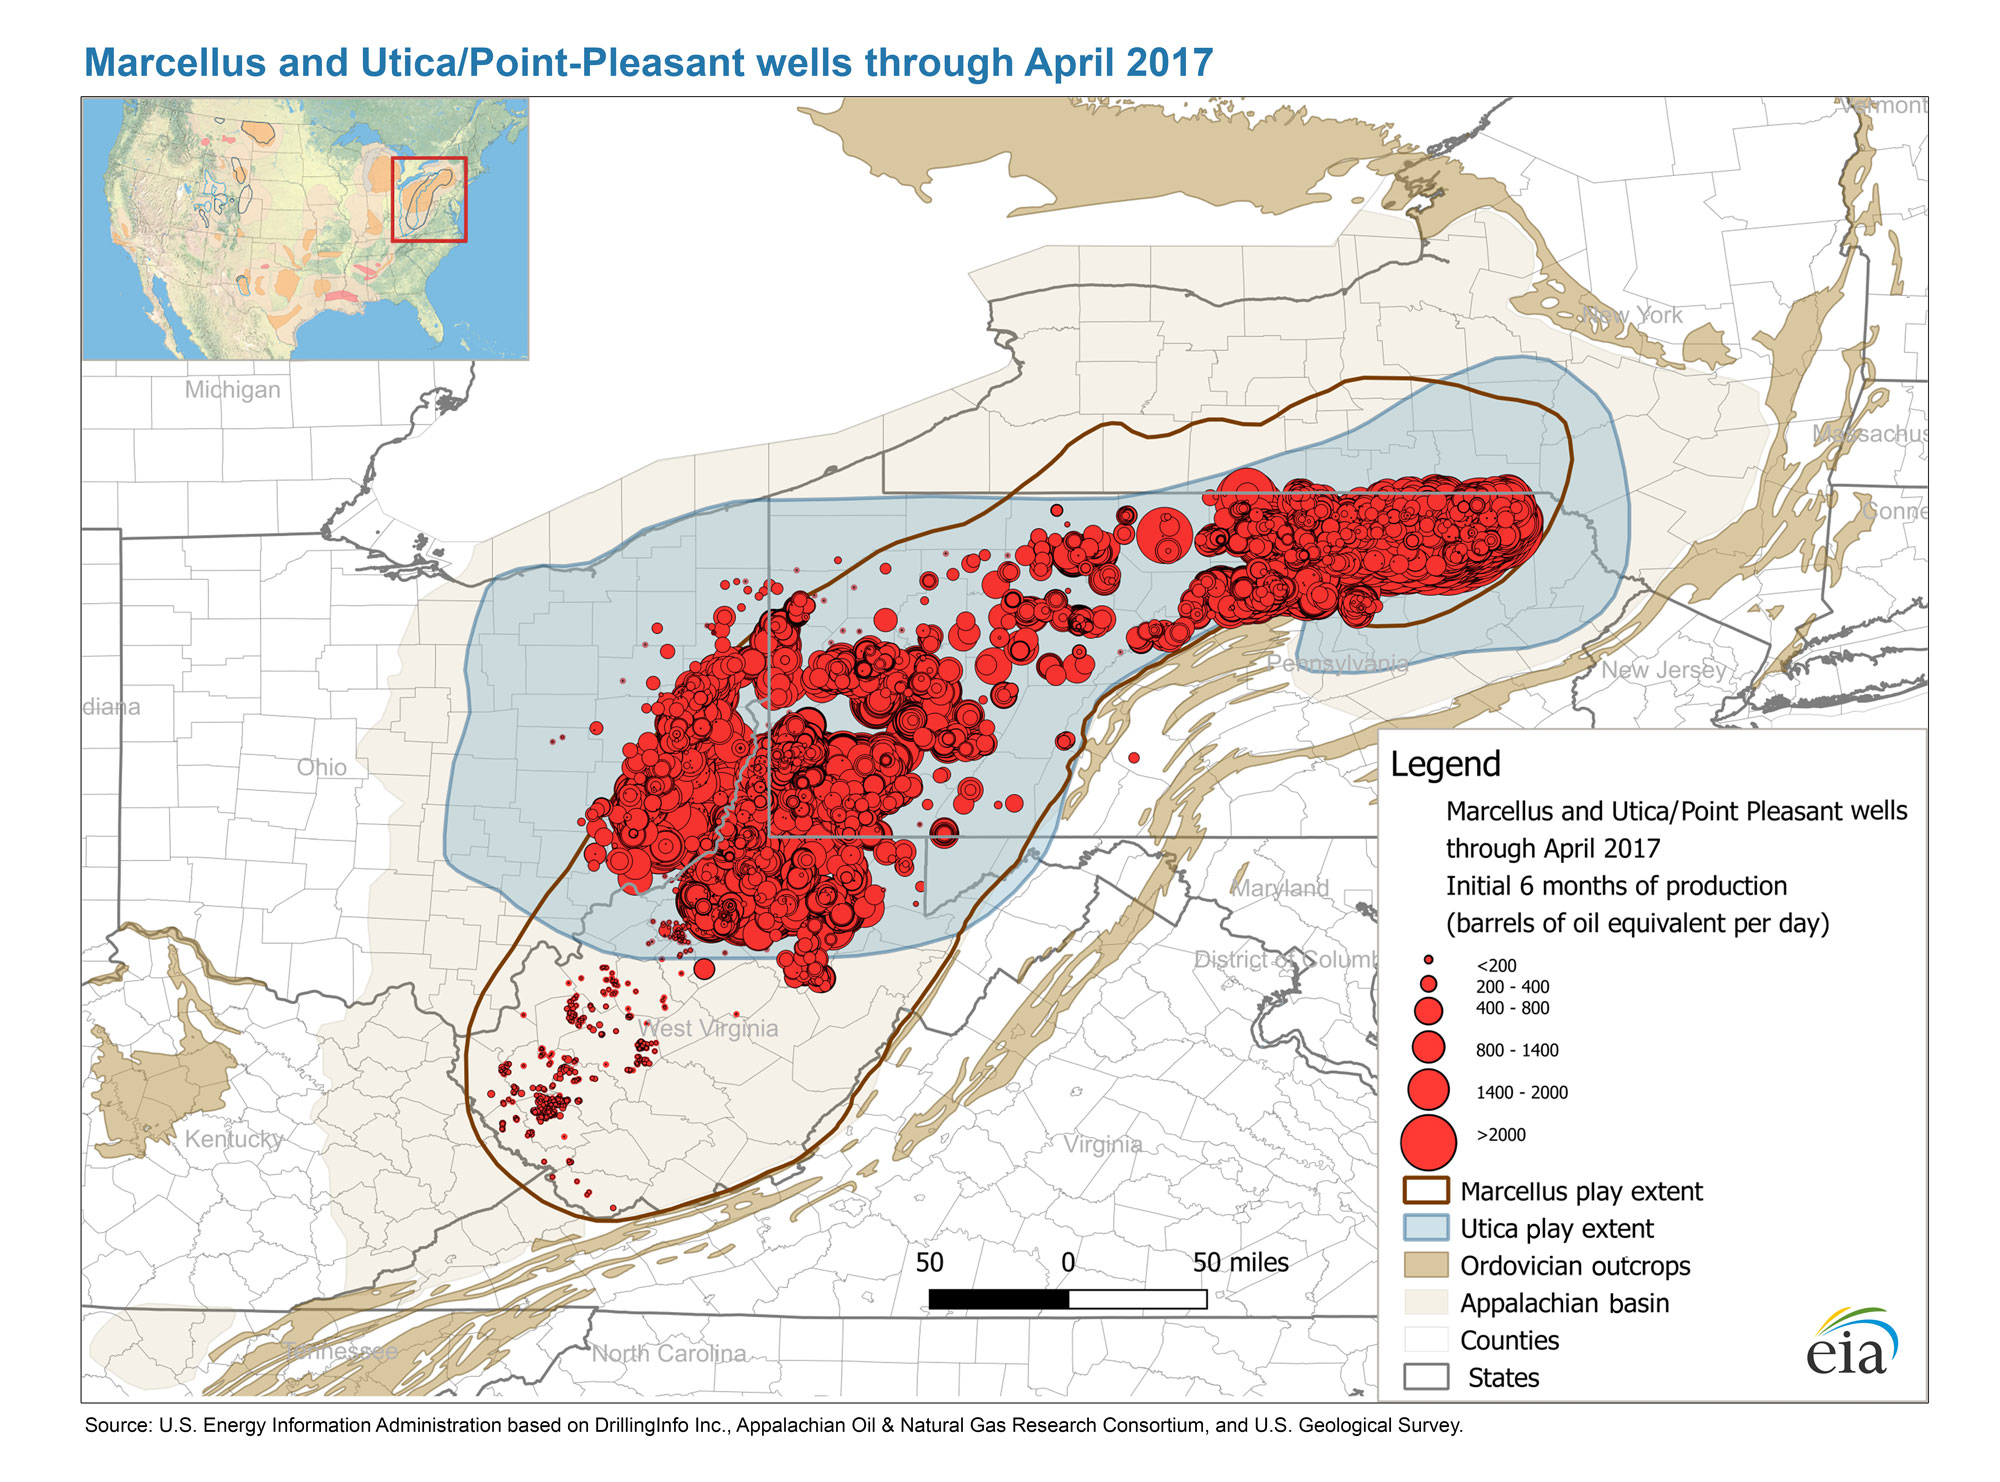
Petroleum production in the Devonian Marcellus and Utica/Point Pleasant shales as of April 2017. Map from the US Energy Information Administration.
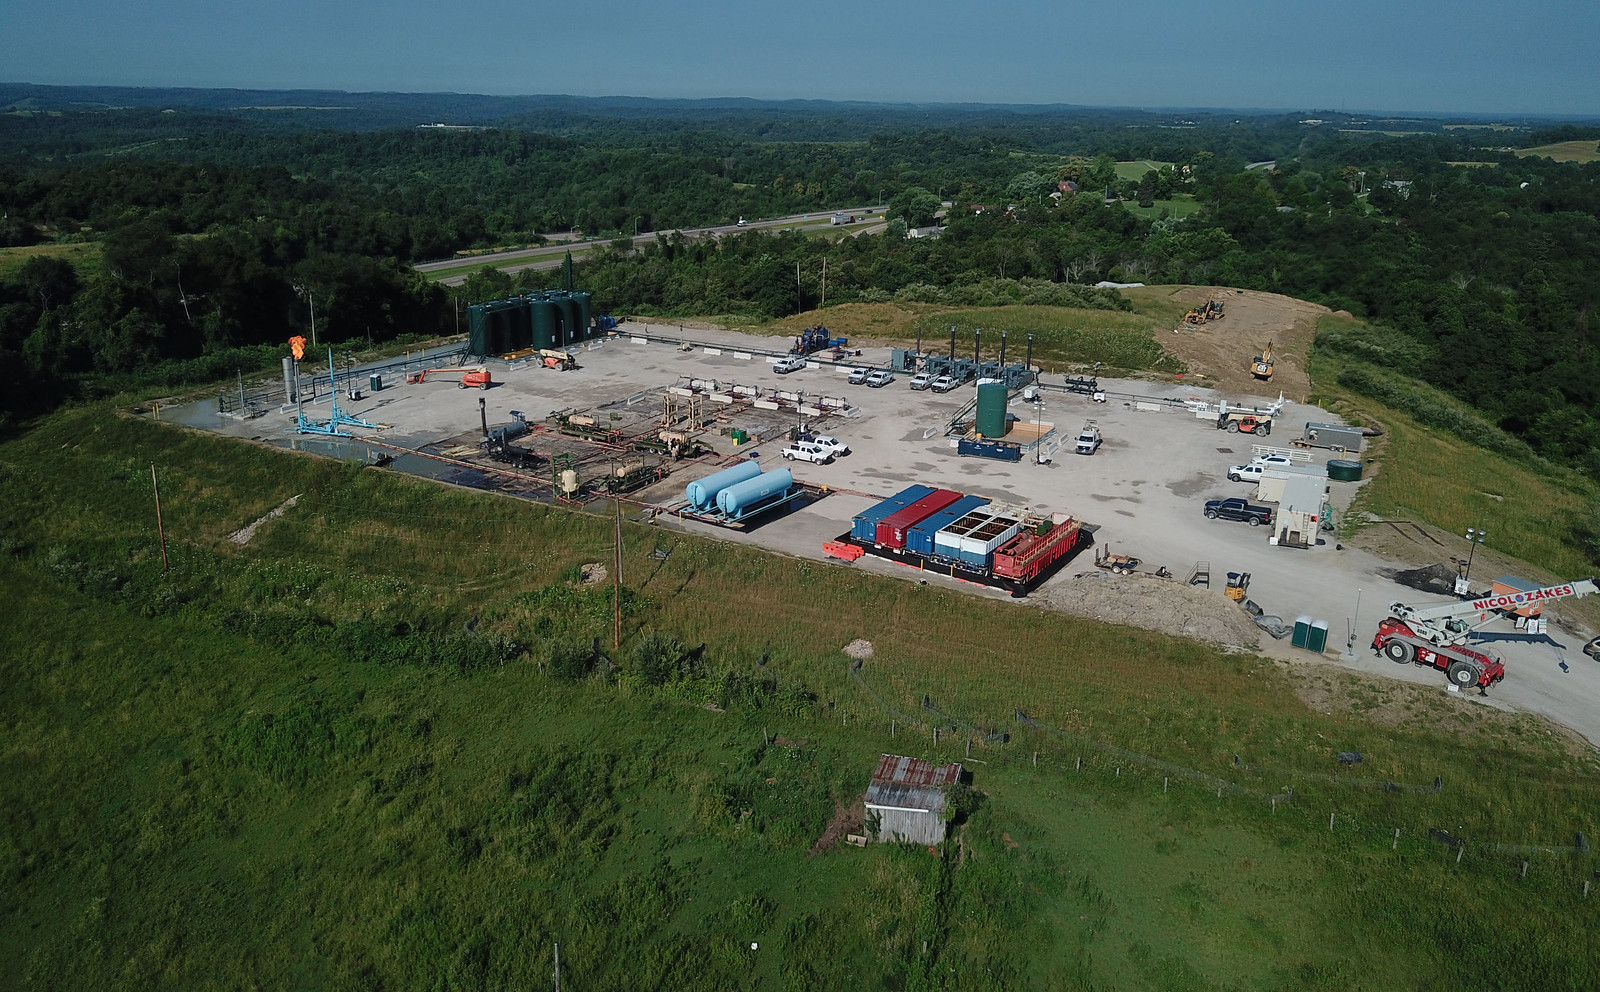
Fracking pad, Fairview, Ohio, 2019. Photo by Ted Auch (FracTracker Alliance on flickr, Creative Commons Attribution-NonCommercial 2.0 Generic license, image resized).
Frac sand mining
Shales are the major source rock for petroleum and natural gas. Extracting oil and gas from shale is challenging, however, because shale is not permeable; in other words, it does not contain pores through which liquid and gas can move. Thus, shale acts as a trap for oil and gas.
One way to release oil and gas from shale is to fracture the shale underground using a process called hydraulic fracturing. During hydraulic fracturing, horizontal wells are drilled along the shale. The shale is then fractured using high volumes of fracking fluid (frac fluid) that is flushed through the wells at high pressure. Frac fluid is made up of water mixed with gel, sand, and chemicals. The thousands of tiny fractures created by the frac fluid are held open by the small grains of sand in the fluid.
Cambrian and Ordovician sandstones in the Midwest yield pure, quartz-rich sand and are important sources of sand for frac fluid. These sandstones include the Jordan, Mount Simon, and Wonewoc formations and especially the Ordovician St. Peter Sandstone. Frac sand (also called silica sand) mining in the Midwest takes place mostly in Wisconsin, but also in Illinois, Iowa, and Minnesota. Much of the sand from the region is simply called "northern white sand" in the industry.
Quaternary sand dunes on the shore of Lake Michigan have also been mined for frac sand. Sand mining of the Great Lakes' dunes was more widespread in the past (in addition to fracking, sand is used in other industries, like glass-making), but many sand dune areas are protected today.
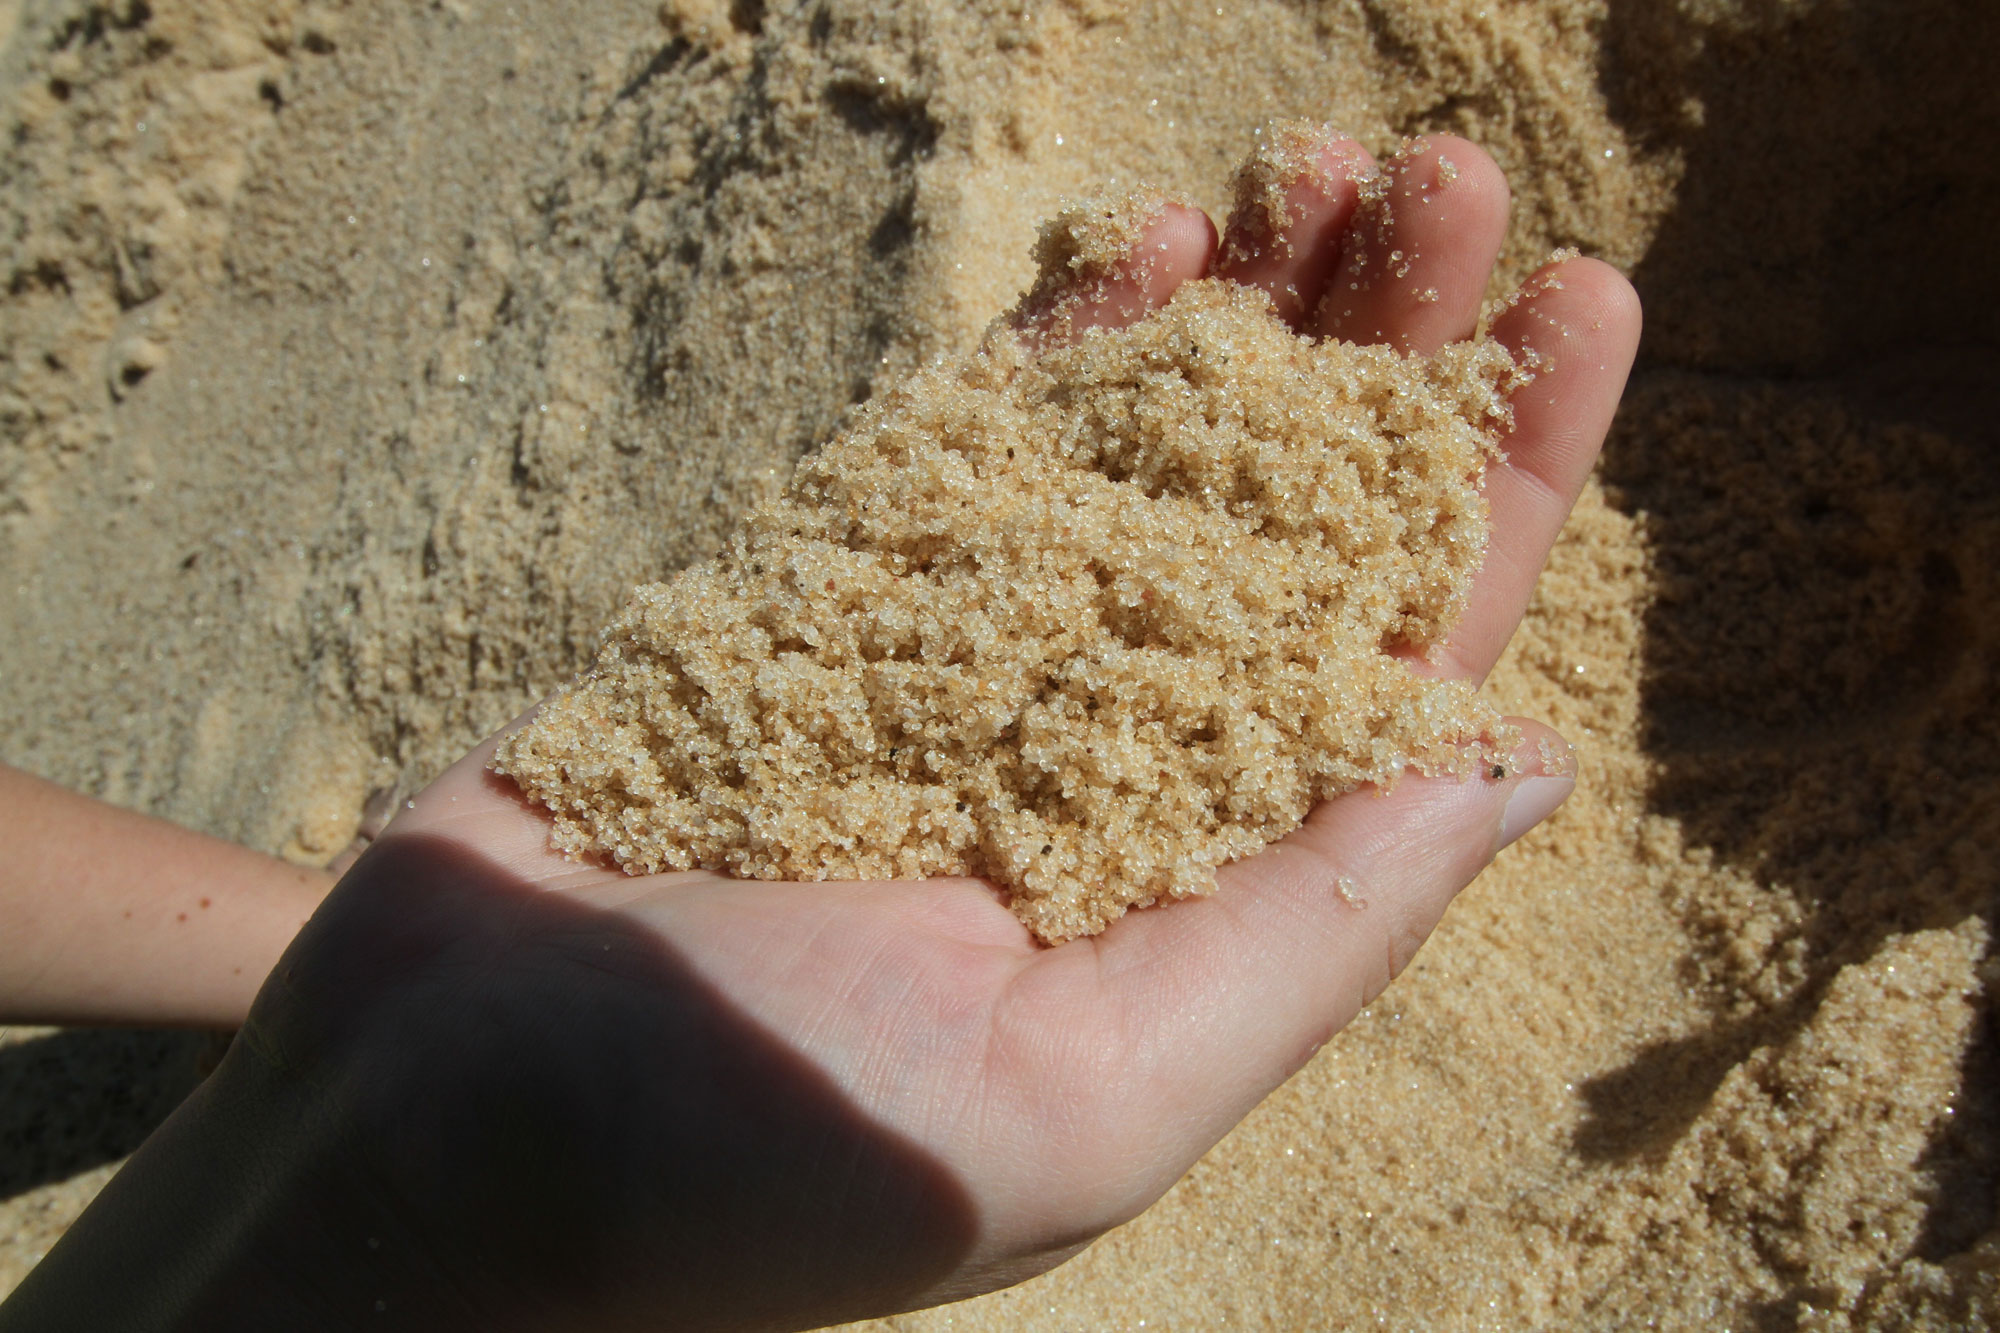
A handful of silica sand from Great Plains Sand, Jordan, Minnesota. The formation that this sand came from was not named, but is probably the Cambrian Jordan Formation. Source: MPCA Photos on flickr (Creative Commons Attribution-NonCommercial 2.0 Generic license, image resized).
Mining of St. Peter Sandstone in Auburn, Wisconsin, 2013. St. Peter Sandstone is used in frack sand, used in the process of horizontal drilling and hydraulic fracturing, a method of extracting natural gas from shales. Photo by Ted Auch, FracTracker Alliance, 2013 (FracTracker Alliance on flickr, Creative Commons Attribution-NonCommercial-NoDerivs 2.0 Generic license).
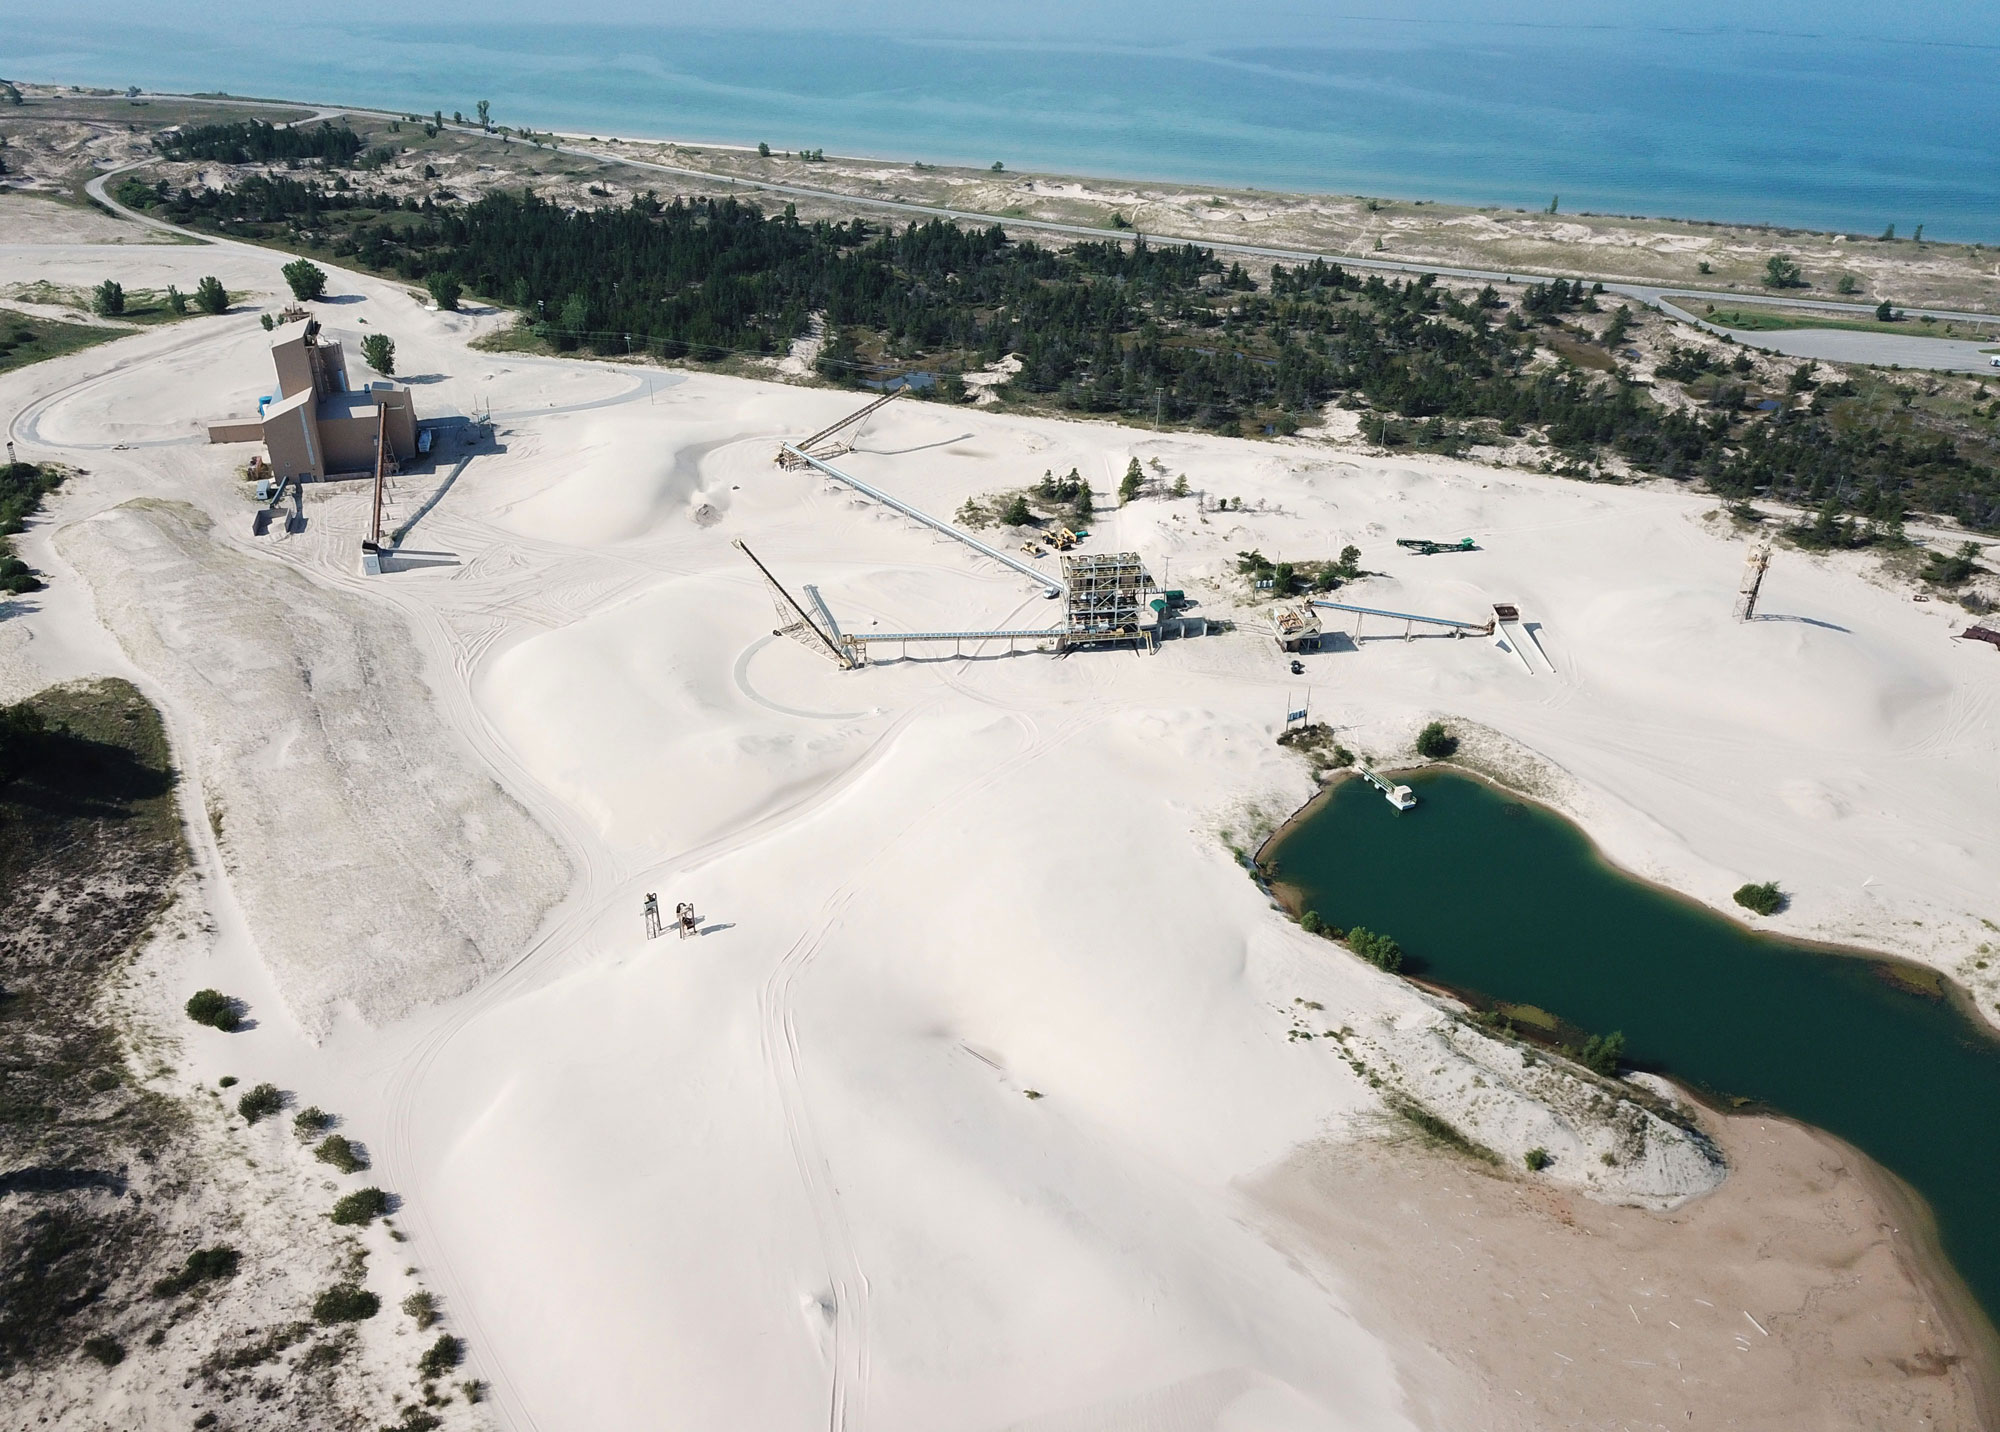
A sand mine near Ludington State Park on the Lower Peninsula of Michigan, 2021. Sand for fracking has been mined here in recent years, although operations at the mine were apparently on pause as of 2022. Photo by Ted Auch, FracTracker Alliance 2021. Aerial support provided by LightHawk (FracTracker Alliance on flickr, Creative Commons Attribution-NonCommercial 2.0 Generic license, image resized).
The frac sand industry in the Midwest has gone through ups and downs since it first ramped up around 2010. In Wisconsin in 2016, there were around 90 active sand mines. By 2020, that number had dwindled significantly. One reason for the decline in sand mining in the Midwest was that sand mines were opened in Texas, nearer to areas where fracking was occurring. In 2022, the midwestern sand mining industry had at least partially recovered by finding other destinations for its sand.
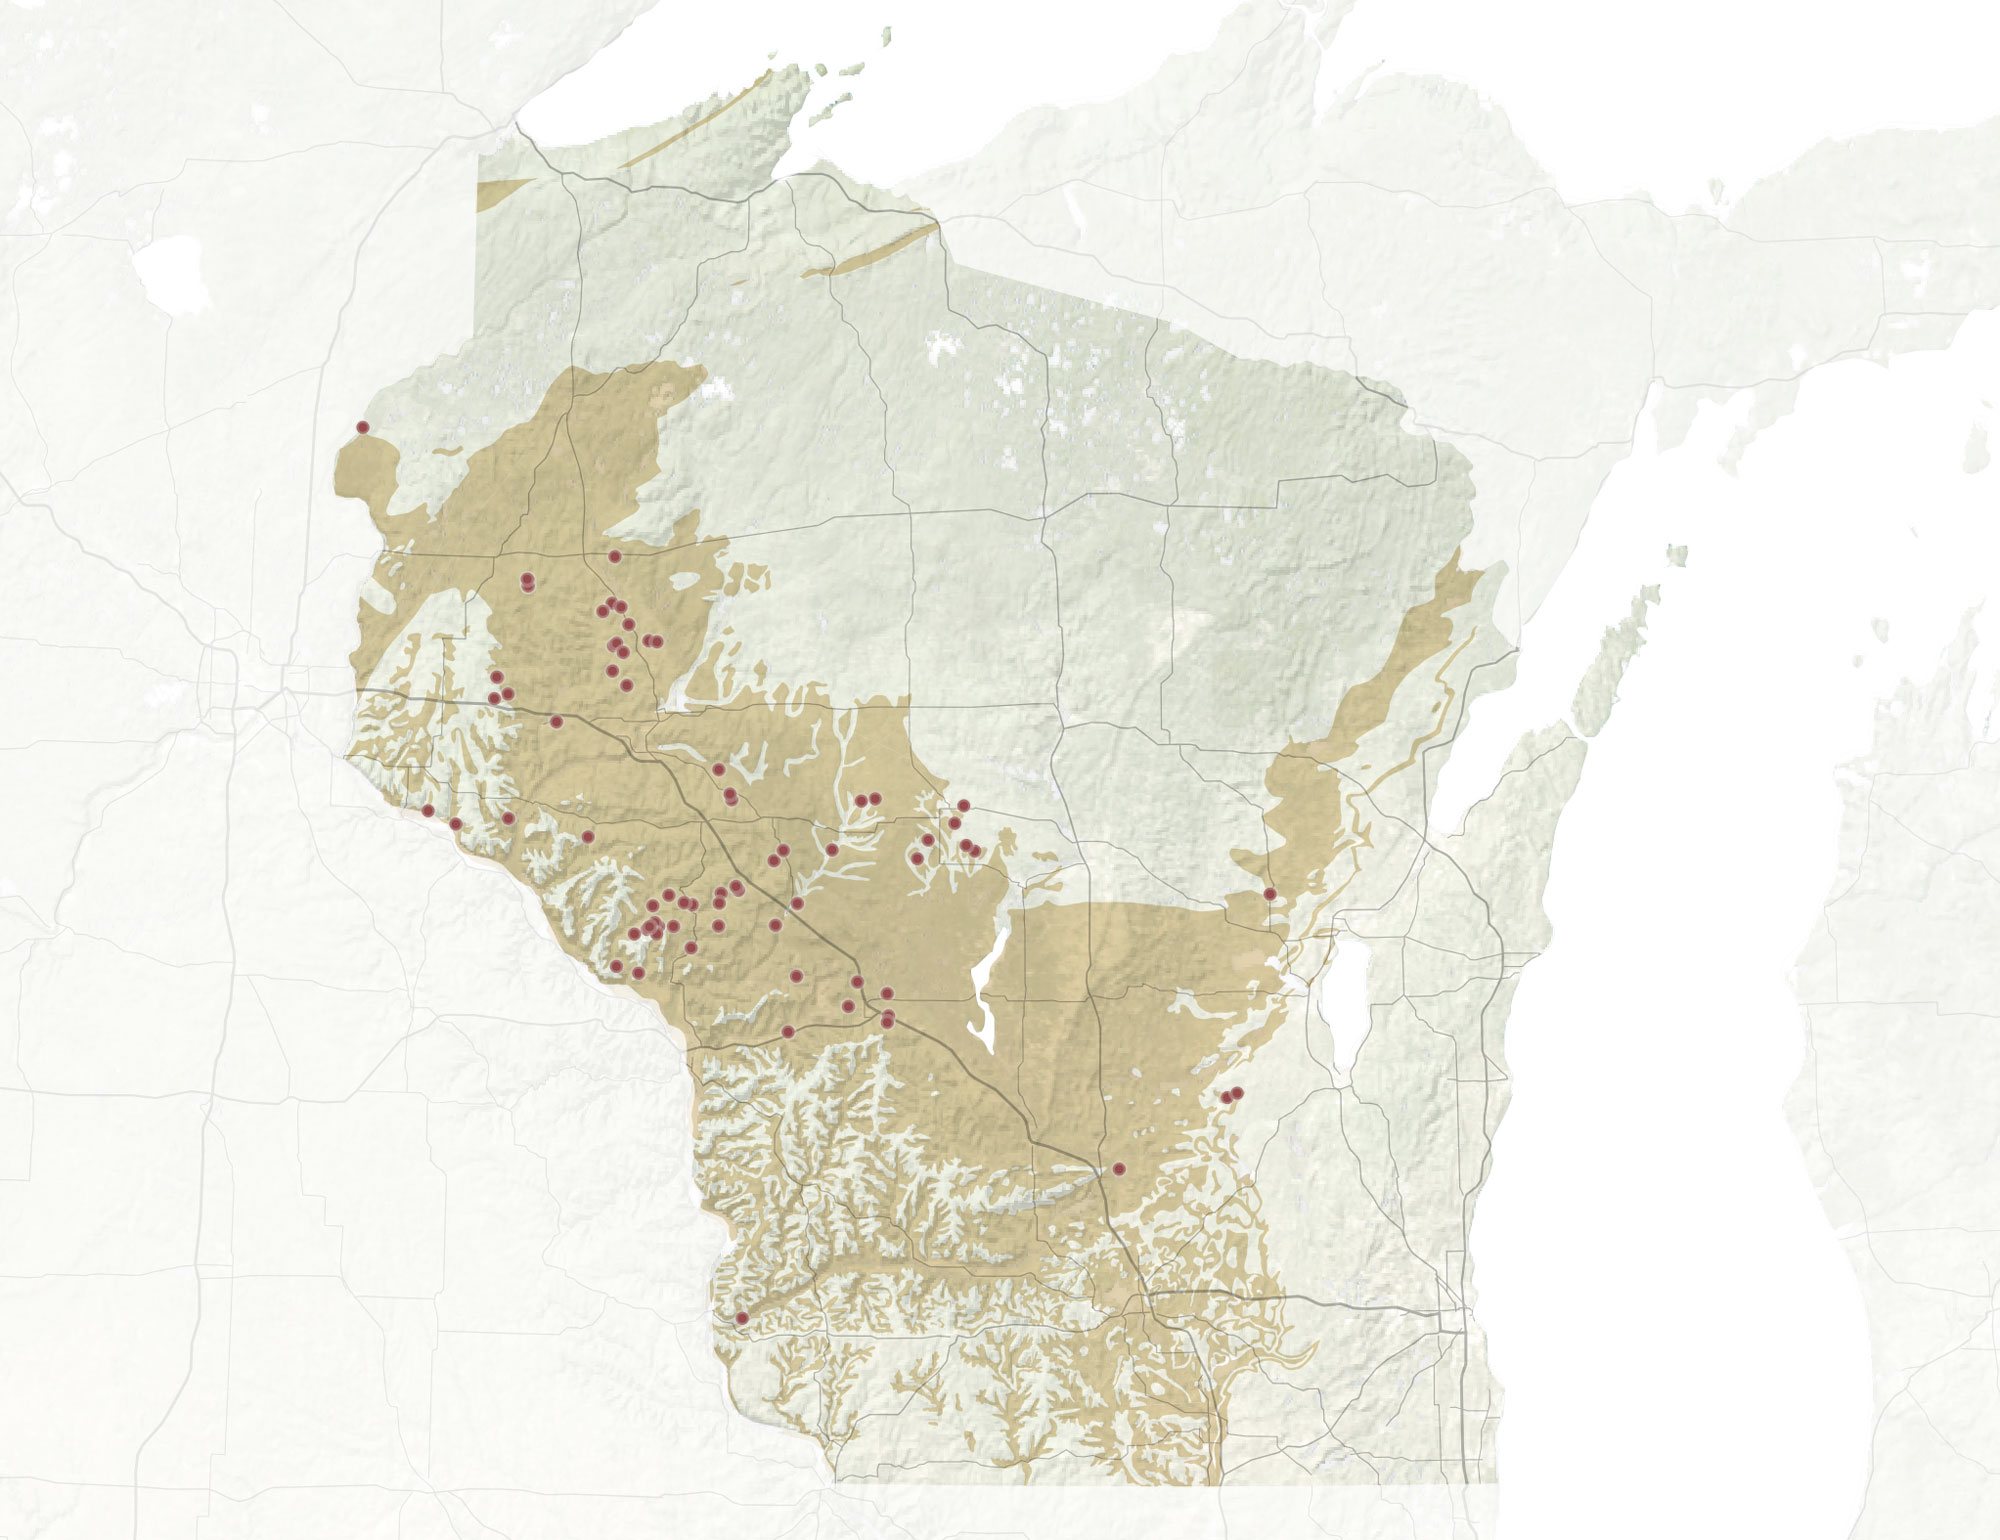
Map of Wisconsin showing sandstone formations (beige) and active sand mines (red dots). This map shows the extent of mining ca. 2018. Map by Joshua Stevens, NASA Earth Observatory (used following NASA's image use policy).
Produced water (wastewater) disposal
The disposal of produced water (wastewater) from oil and gas drilling using injection wells is a large industry in eastern Ohio. An injection well is a well where wastewater is injected deep underground. Pumping wastewater into the ground can sometimes cause induced earthquakes, or earthquakes triggered by human activity.
Although less seismic activity has been linked to injection wells in Ohio than in places like Oklahoma, a series of earthquakes in 2011 and 2012 were caused by the operation of an injection well near Youngstown; the largest was a magnitude 3.9 earthquake in December 2011 (the well that apparently triggered the earthquakes is no longer in use). Other concerns about injection wells include potential for spills and groundwater contamination, as well as negative impacts on quality of life (for example, increased traffic near injection well sites).
An injection well site in Meigs County, Ohio, 2021. Photo by Ted Auch (FracTracker Alliance on flickr, Creative Commons Attribution-NonCommercial 2.0 Generic license, image resized).
Coal
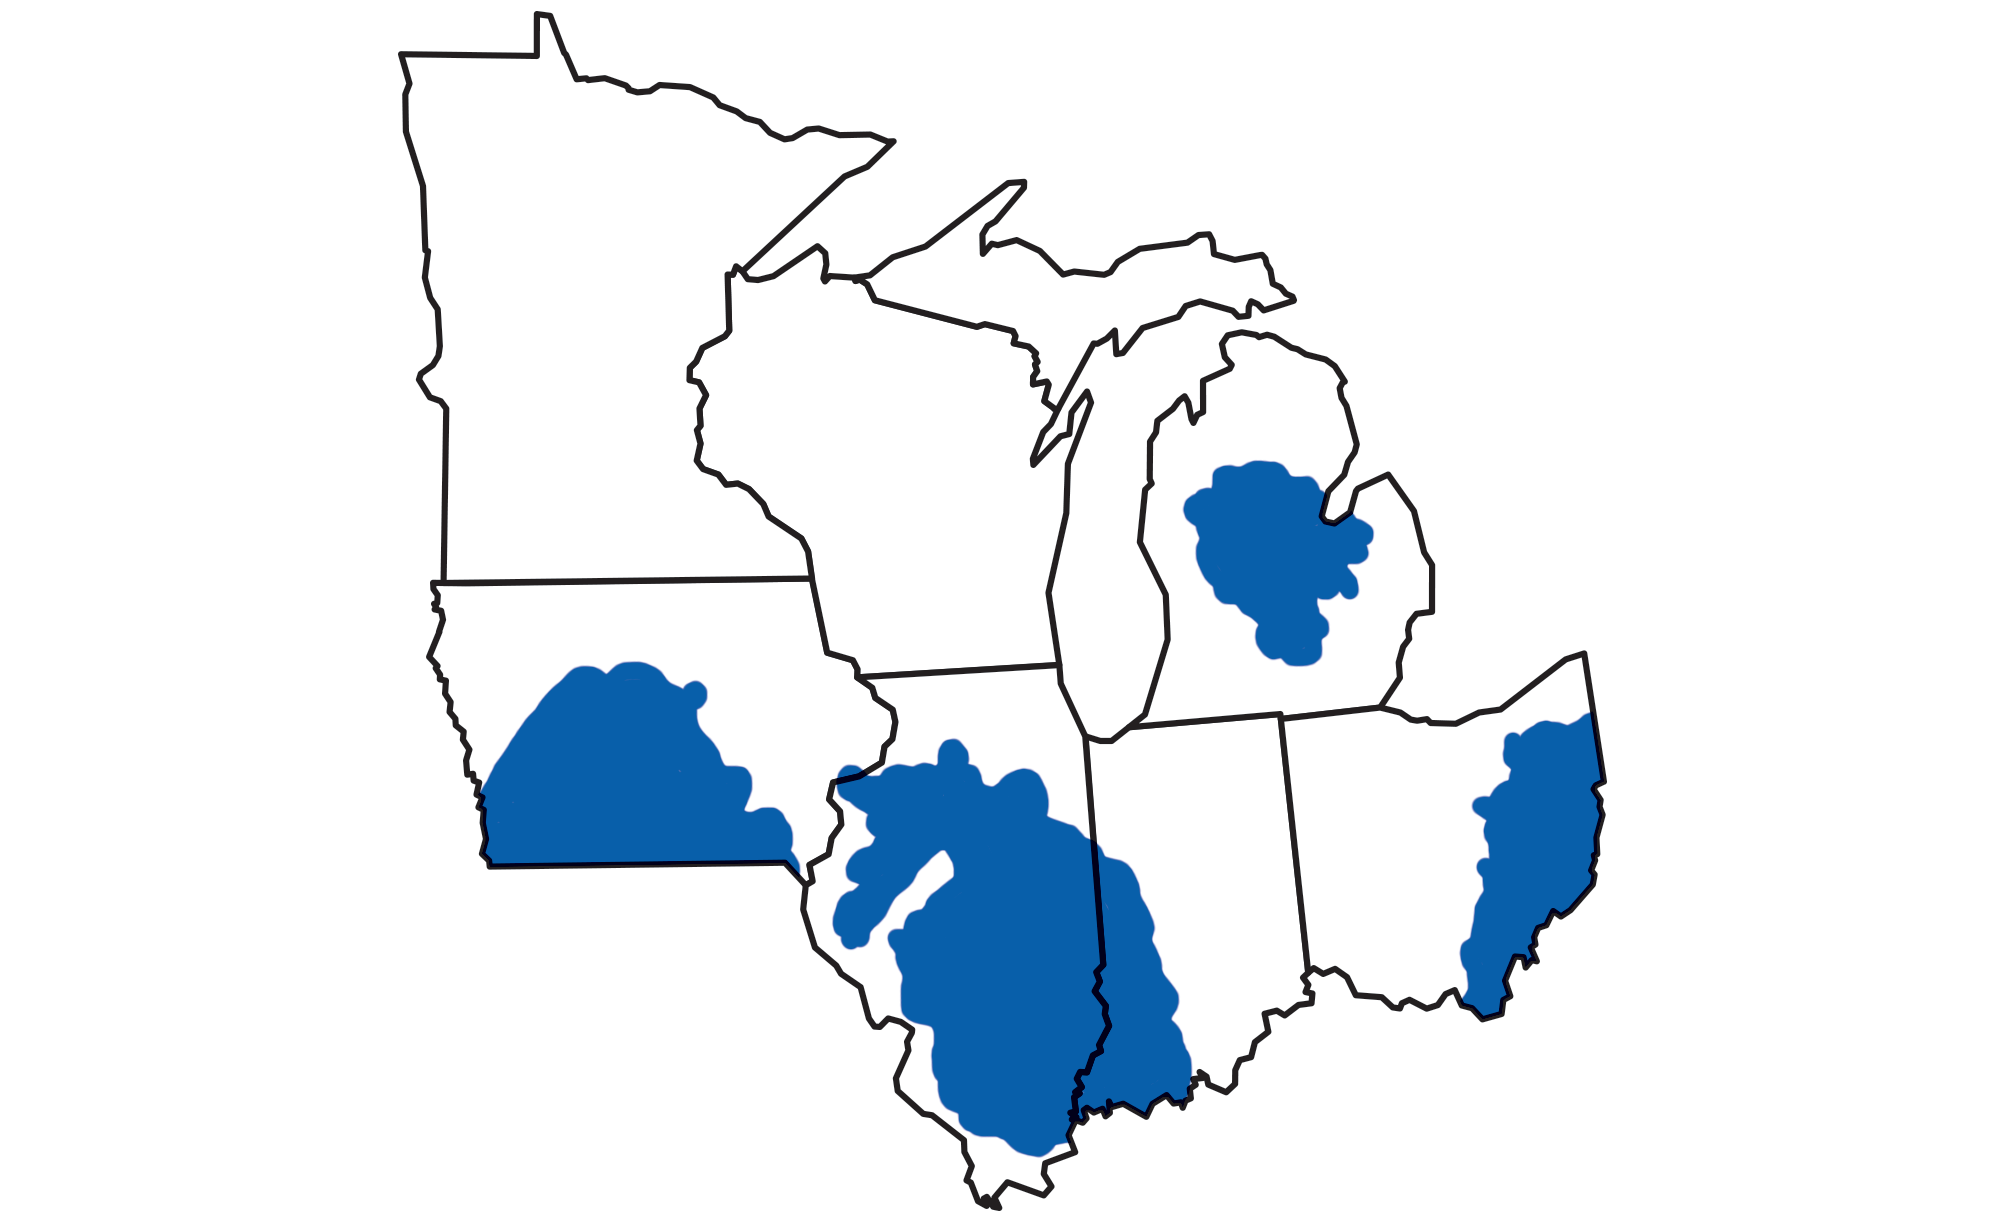
Distribution of coal deposits and cola mining in the midwestern U.S. Modified from a figure from the USGS, originally published in The Teacher-Friendly Guide to the Midwestern US.
Coal in the Central Lowland
The use and production of coal has a long history in the Central Lowland. The most important sources of coal come from Pennsylvanian period deposits in the Illinois Basin of southern Illinois and southwestern Indiana. There are also small Pennsylvanian-age coal deposits in central Michigan. Coal was first discovered by European settlers in Illinois in the 1600s and in Indiana in the 1700s, and it was mined commercially mostly in the 1800s and 1900s. Mines were mainly underground until about the mid-1900s, after which surface mines became more common with the development of new machinery that made large-scale strip-mining economical.
Coal from Illinois Basin deposits is relatively sulfur-rich bituminous coal. The use of coal from this region has declined in recent decades because burning the high-sulfur coal contributes to the formation of acid rain. Today, there are around 20 coal mines operating in Illinois and a similar number in Indiana.
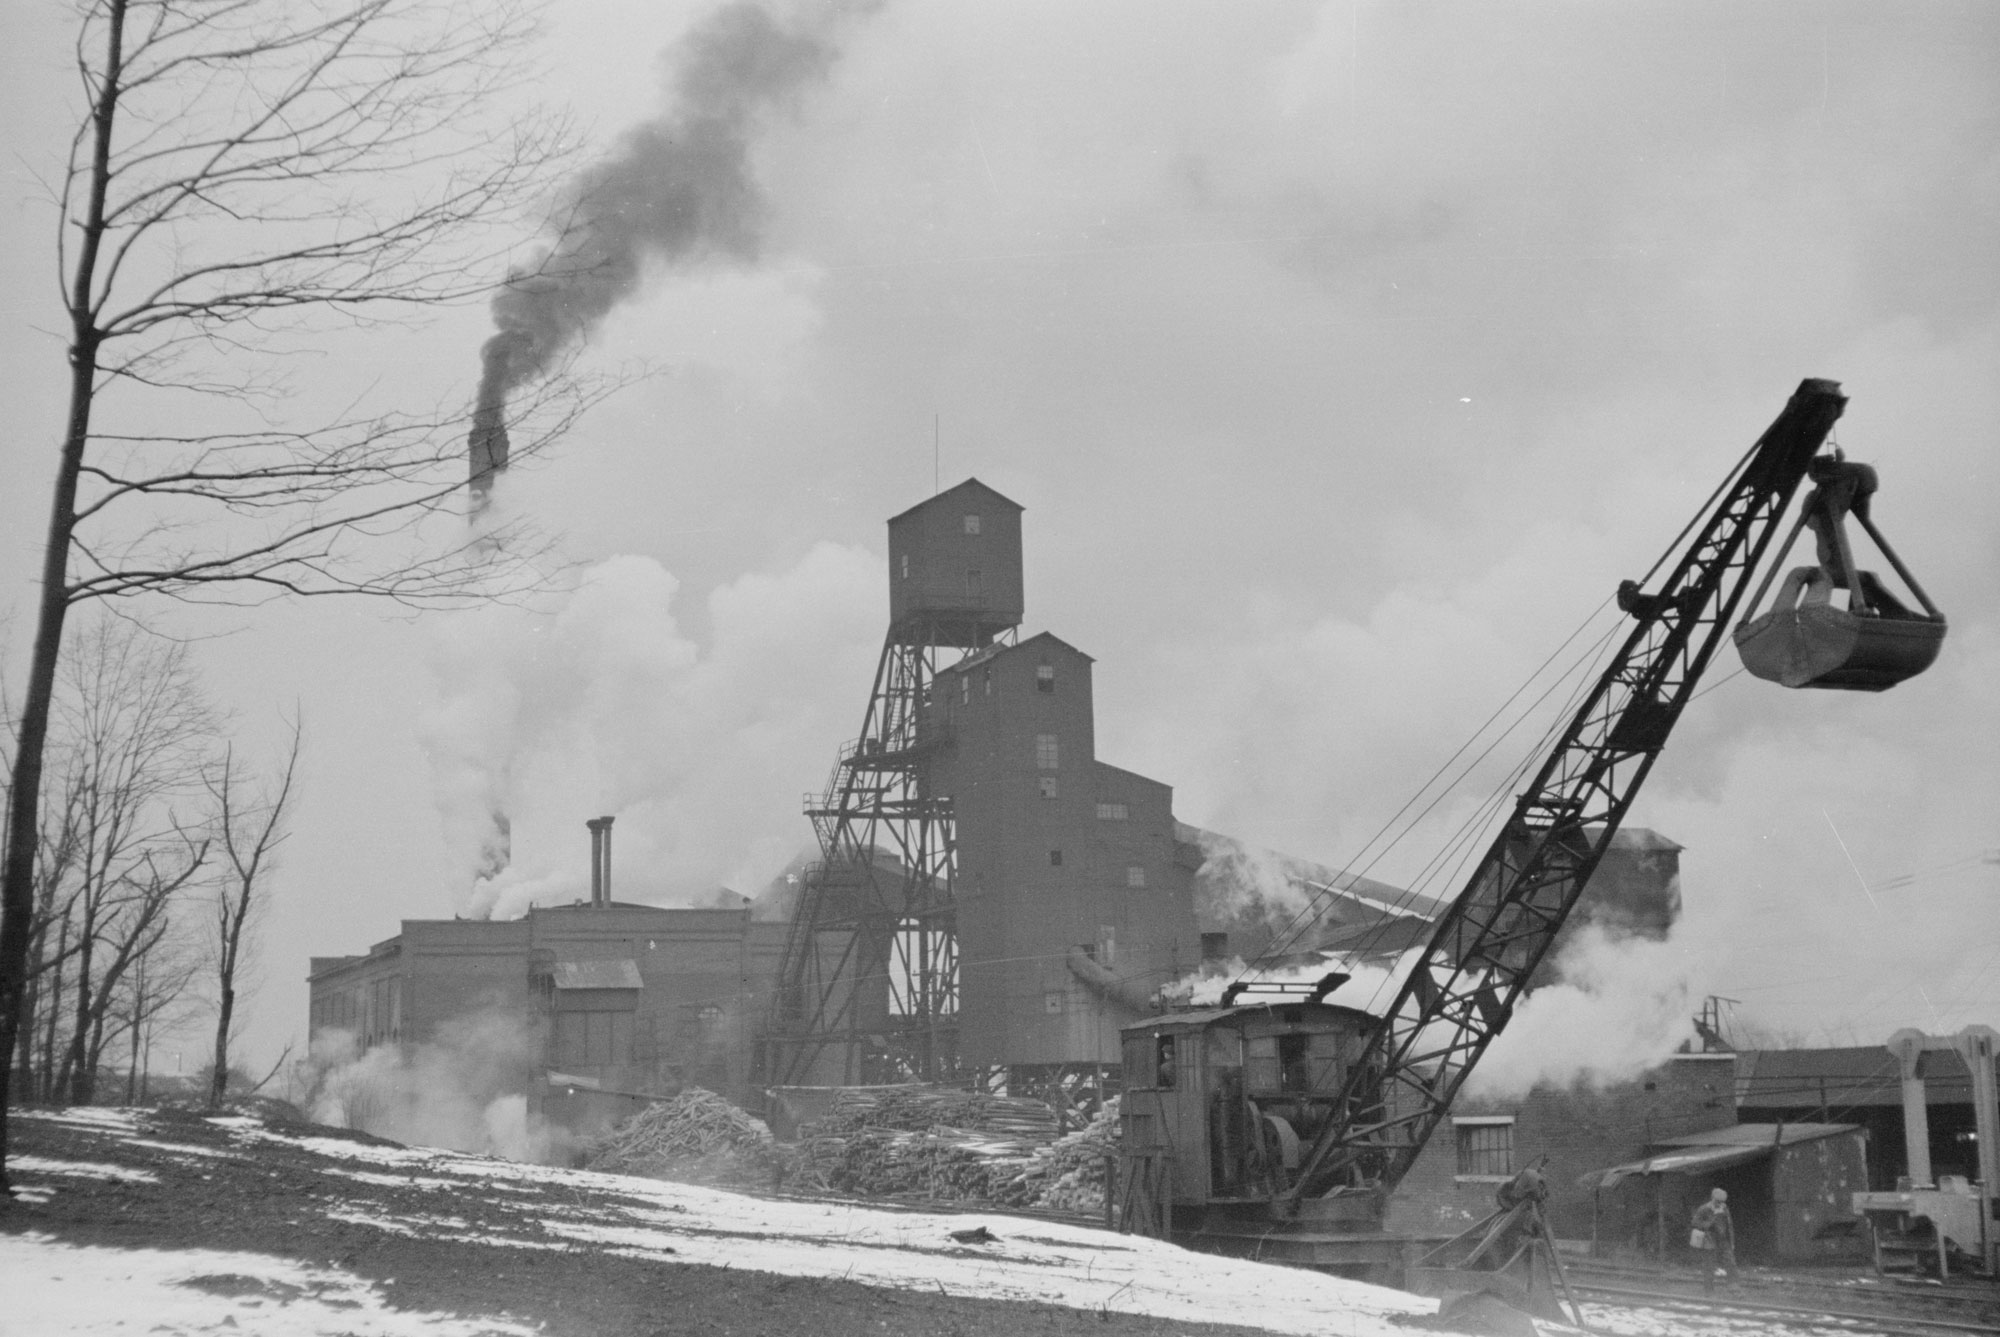
Orient Mine No. 1, Franklin County, Illinois, 1939. Photo by Arthur Rothstein (U.S. Farm Security Administration/Office of War Information, Library of Congress reproduction number LC-DIG-fsa-8a10588, no known restrictions).
Strip mining coal, Fulton County, Illinois, 1973. Photo by Arthur Greenburg (EPA, National Archives and Records Administration, via Wikimedia Commons, public domain).
Coal in the Inland Basin
The eastern edge of Ohio is a coal-producing region, where mining occurs in the same Pennsylvanian period deposits of the Appalachian Basin that have long been famous in Pennsylvania, Kentucky, and West Virginia. Mining in the region dates back to the early 1800s.
Deposits in Ohio are high in sulfur compared to those further east and so have been in less demand since 1990 due to federal environmental regulations. Emissions from high-sulfur coal in particular can react with oxygen and water in the atmosphere to create sulfuric acid. When acid rain falls, it can kill vegetation and change the chemistry of lakes, killing aquatic organisms.
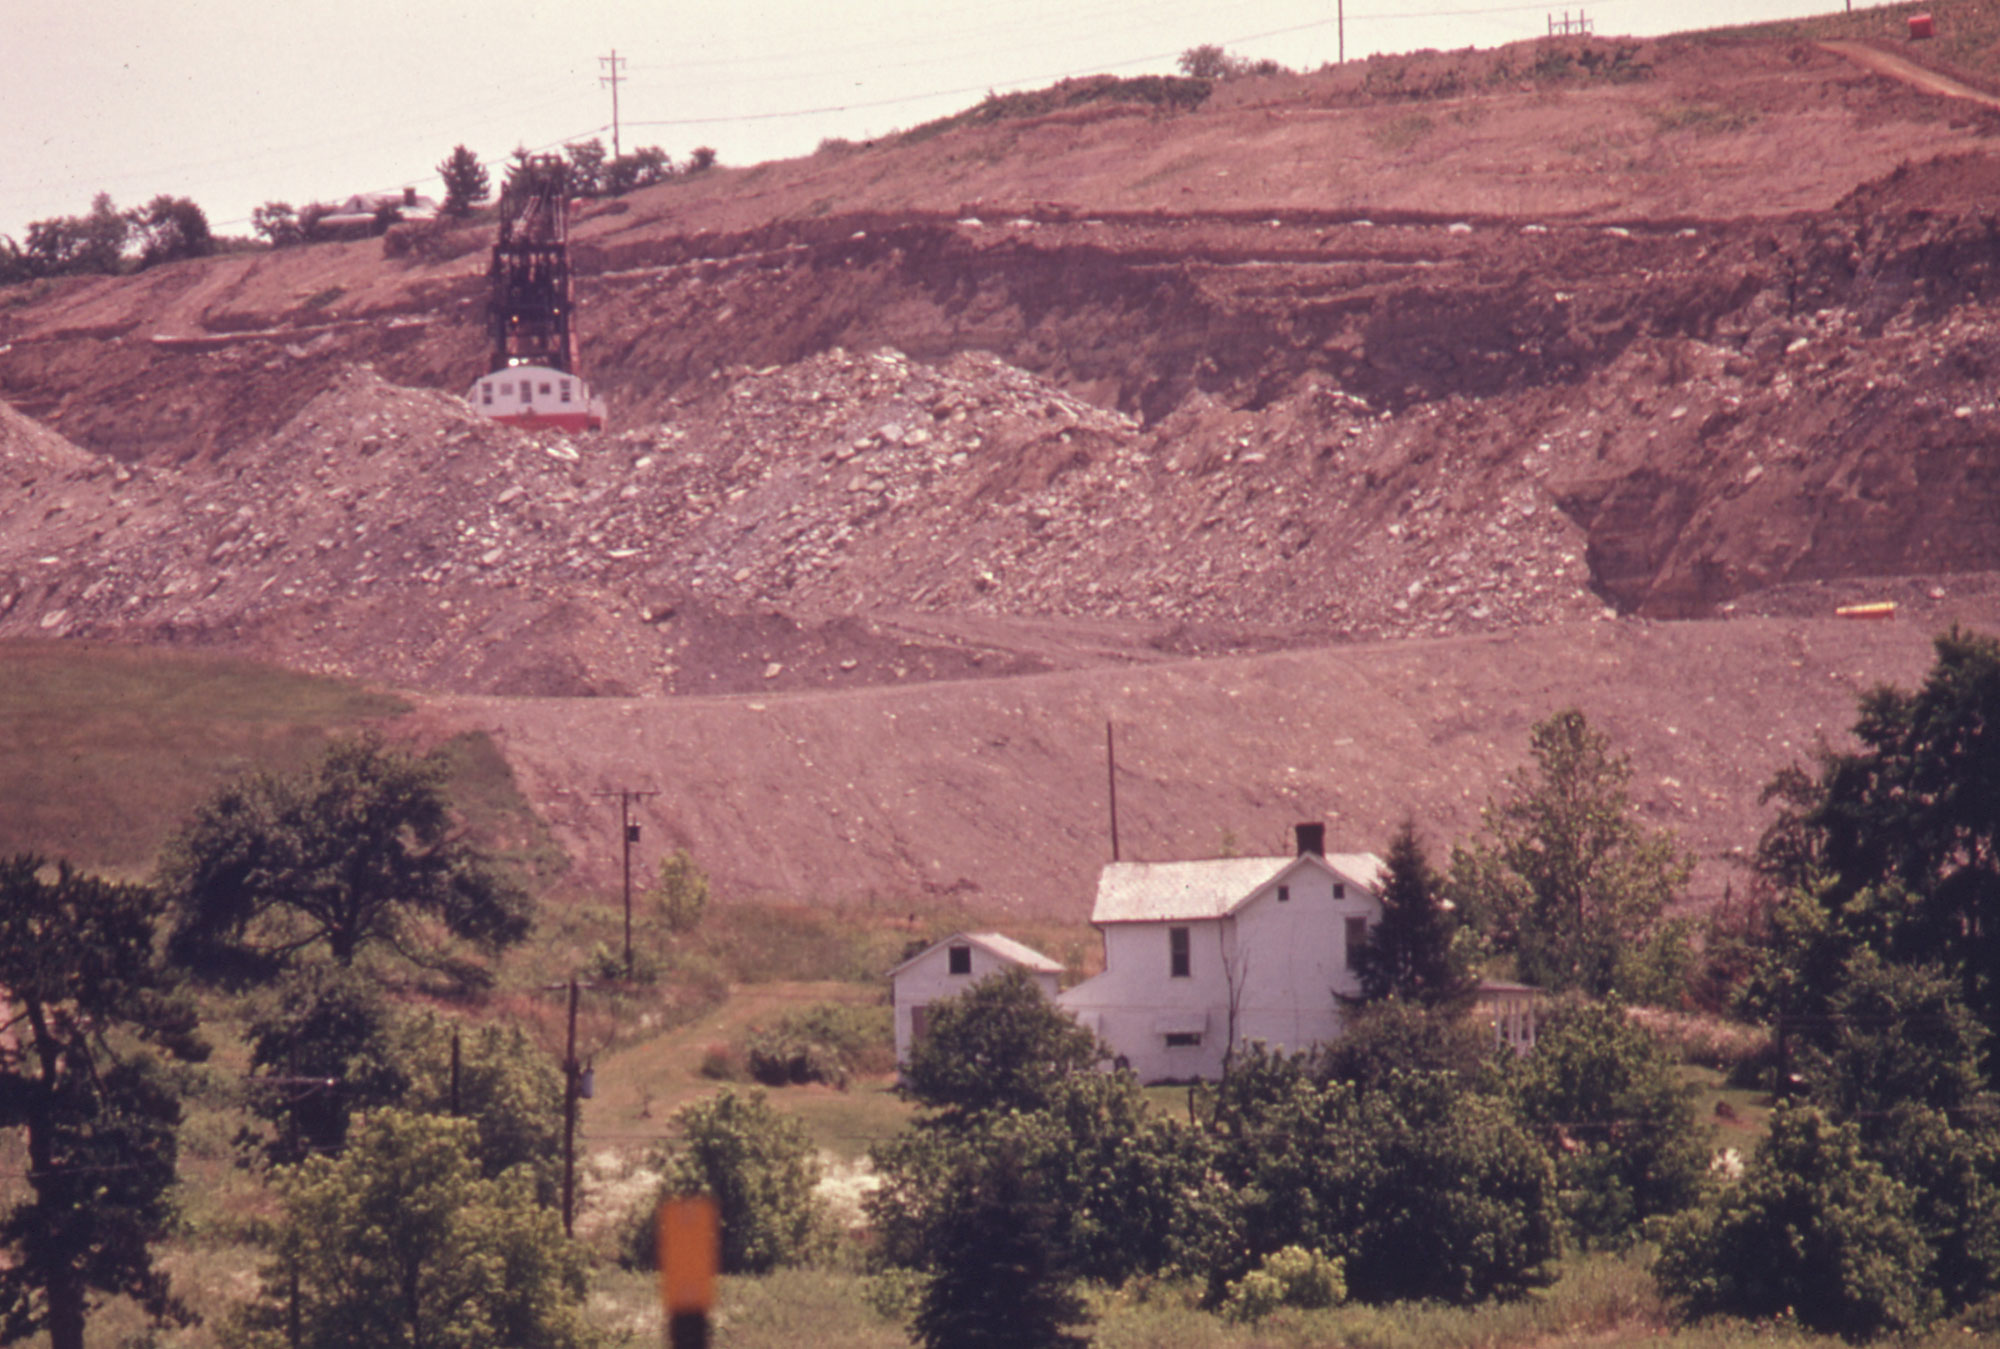
Strip mining coal near Morristown, eastern Ohio, 1974. Photo by Eric Caonius, EPA/DOCUMERICA (National Archives Indentifier 555604, unrestricted use).
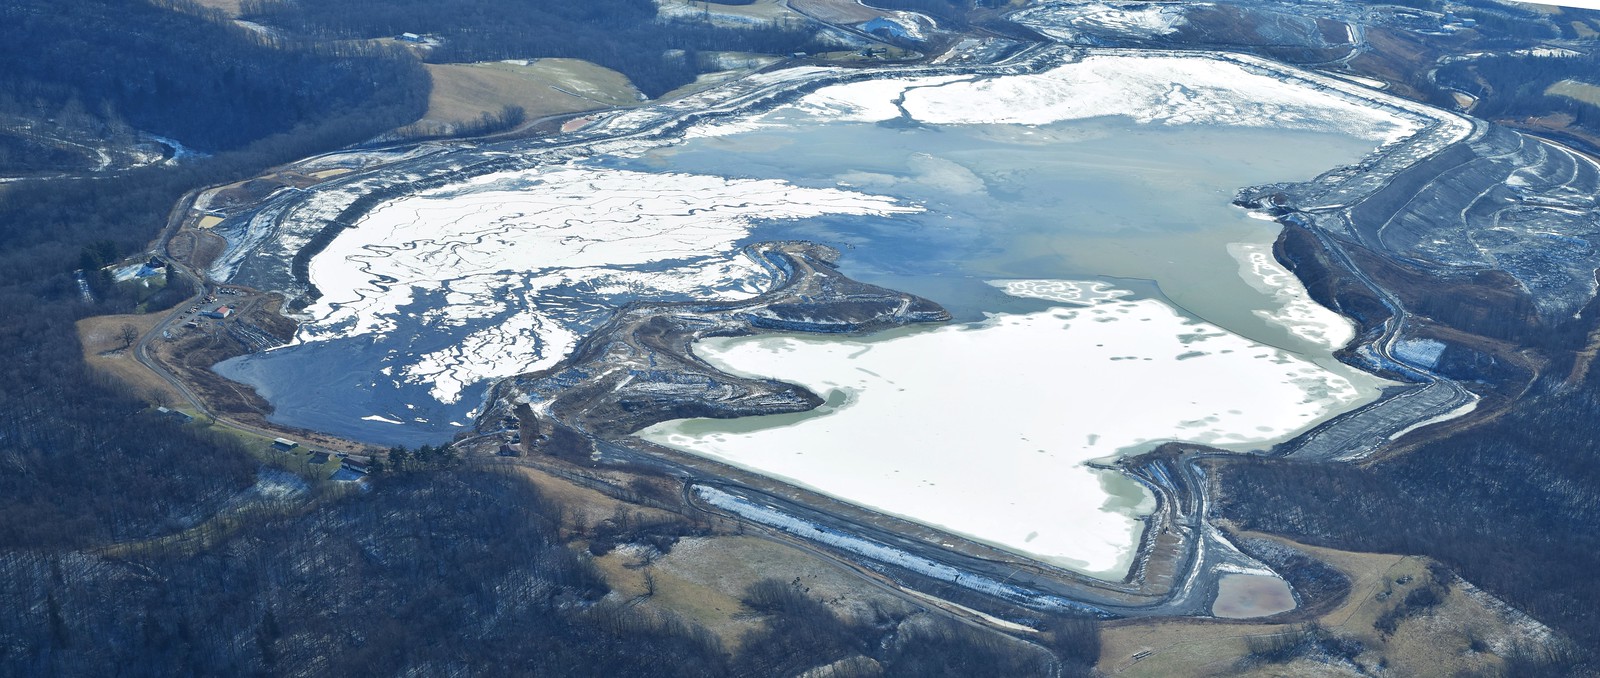
Coal slurry pond, Alledonia, Ohio, 2018. Photo by Jack Pearce (flickr, Creative Commons Attribution-NonCommercial-Noderivs 2.0 Generic license, image resized).
Acid mine drainage
Acid mine drainage is formed when water comes into contact with rocks containing pyrite (iron sulfide), typically at old mine sites. When oxygen is also present, the water and pyrite react, creating sulfuric acid and dissolved iron. This acidic solution can also leach heavy metals from rock, making it more toxic. Acid mine drainage is often a rusty orange color. This color is caused by the formation of iron solids.
Acid mine drainage is a problem in areas of the Midwest that historically had coal mines, particularly Illinois, Indiana, and Ohio. Many of these old mines were created before environmental laws required mine owners to remediate (essentially, restore) mine sites. Acid mine drainage from abandoned mine sites can flow into natural waterways, changing their chemistry and killing aquatic organisms. Although there is no easy solution to the problems posed by acid mine drainage, preventing water from flowing through old mines or capturing and treating acid mine drainage are two methods to limit its damage.
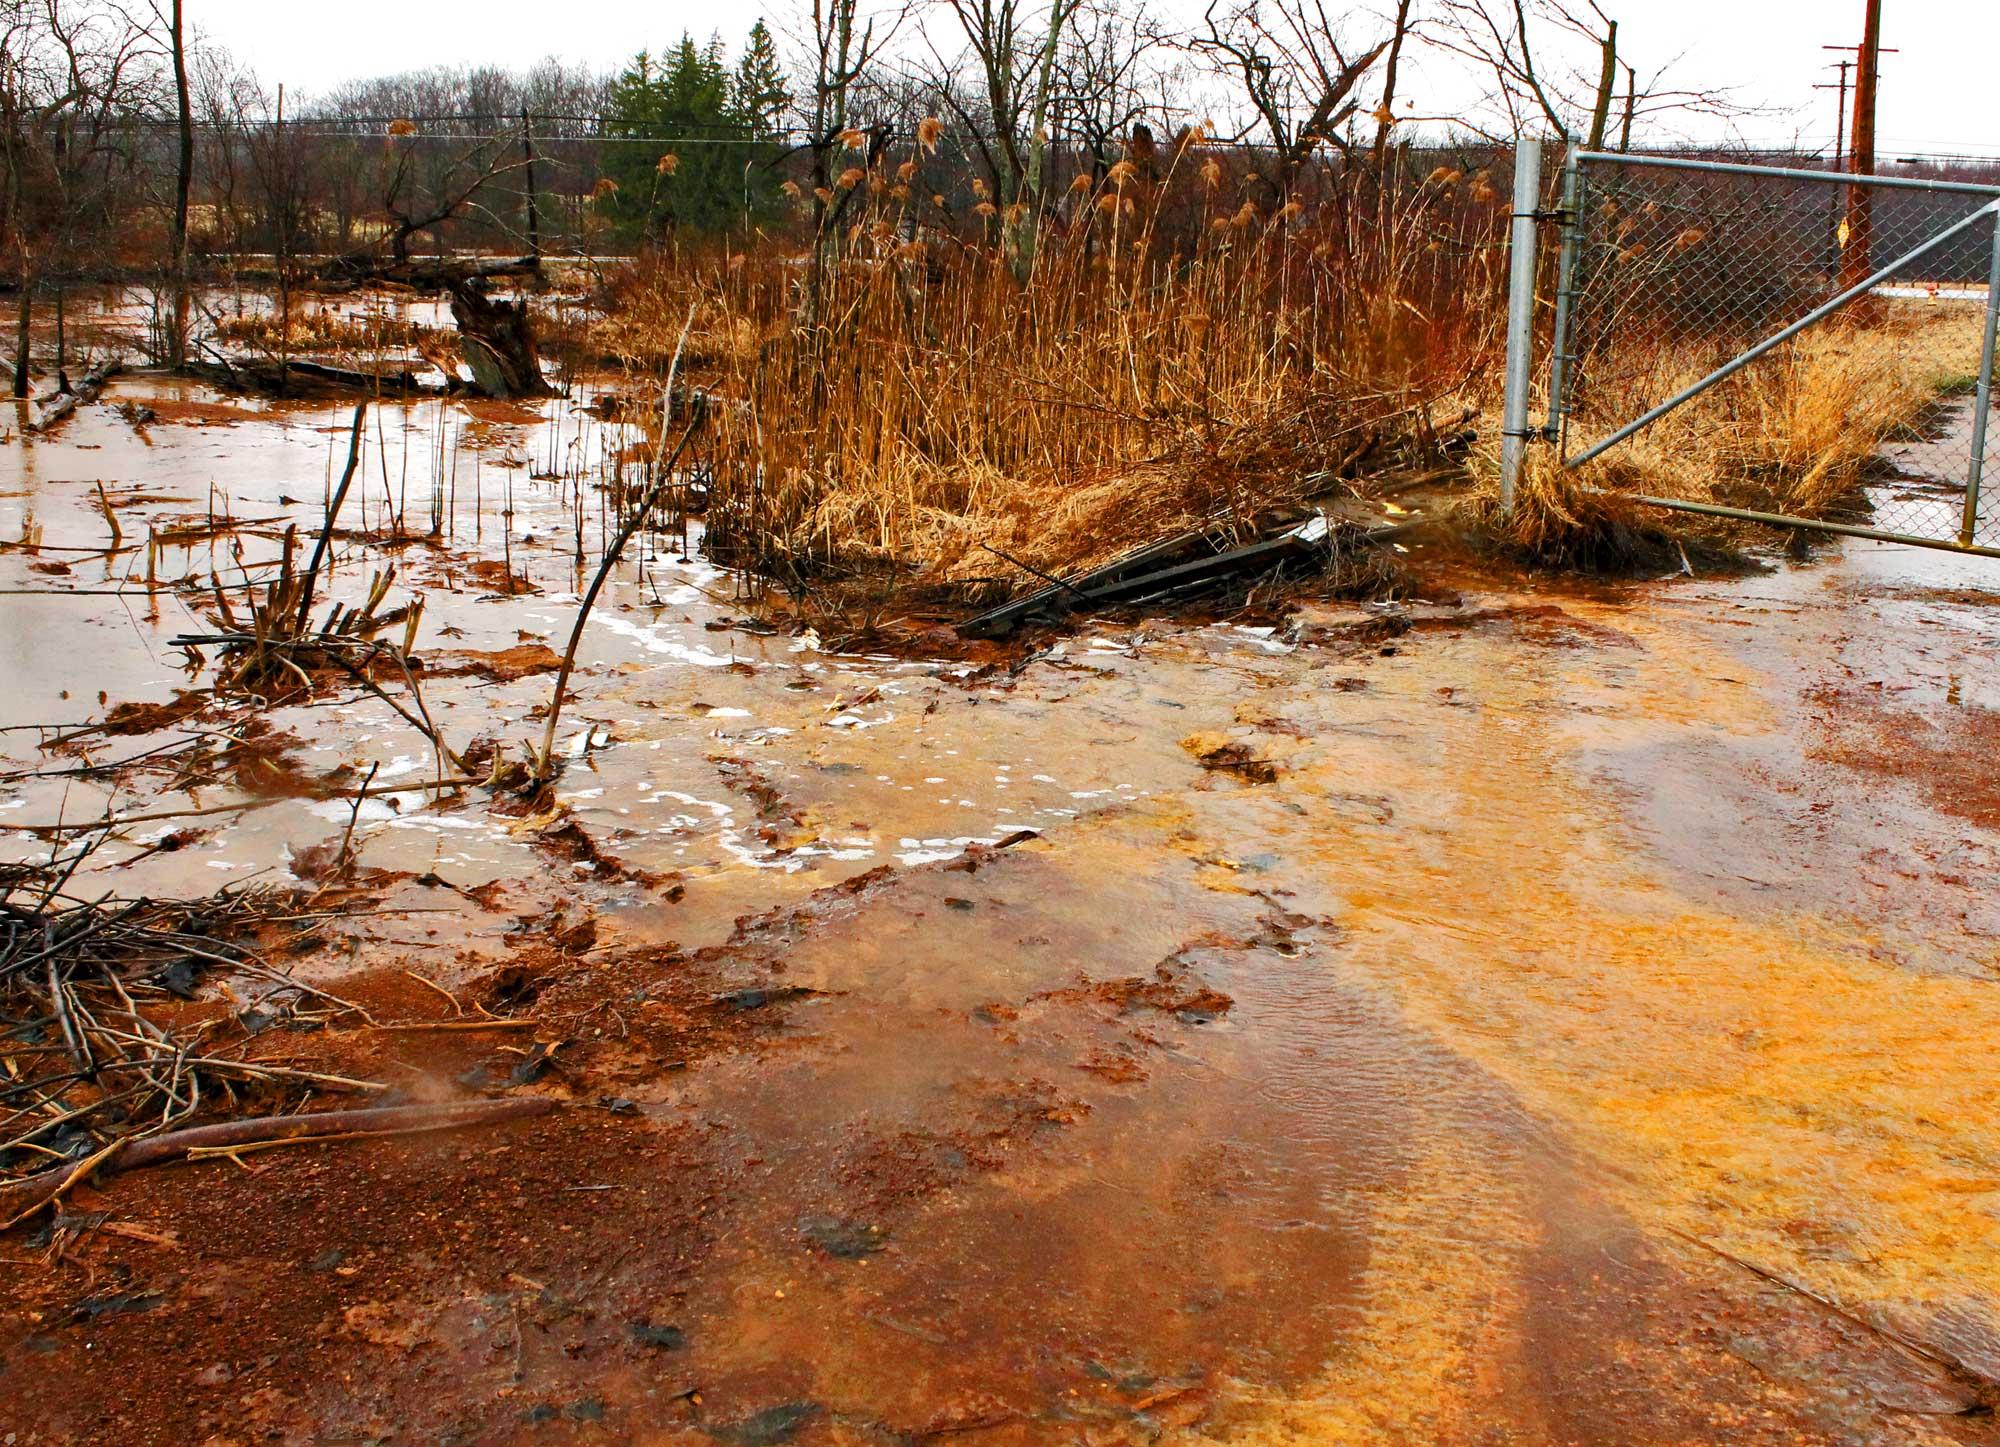
Acid mine drainage gives this water its rusty orange color, North Lima, Ohio, 2014. Photo by Jack Pearce (flickr, Creative Commons Attribution-ShareAlike 2.0 Generic license, image resized).
Wind energy
Outside of the Great Lakes themselves, Iowa and Minnesota have the most potential for wind energy development and, indeed, generate the most electricity from wind. More than 50% of Iowa's electricity is now generated from wind, whereas more than 20% of Minnesota's electricity is. Although it has less potential for wind power development than Iowa or Minnesota, Illinois generates more than 10% of its electricity from wind.
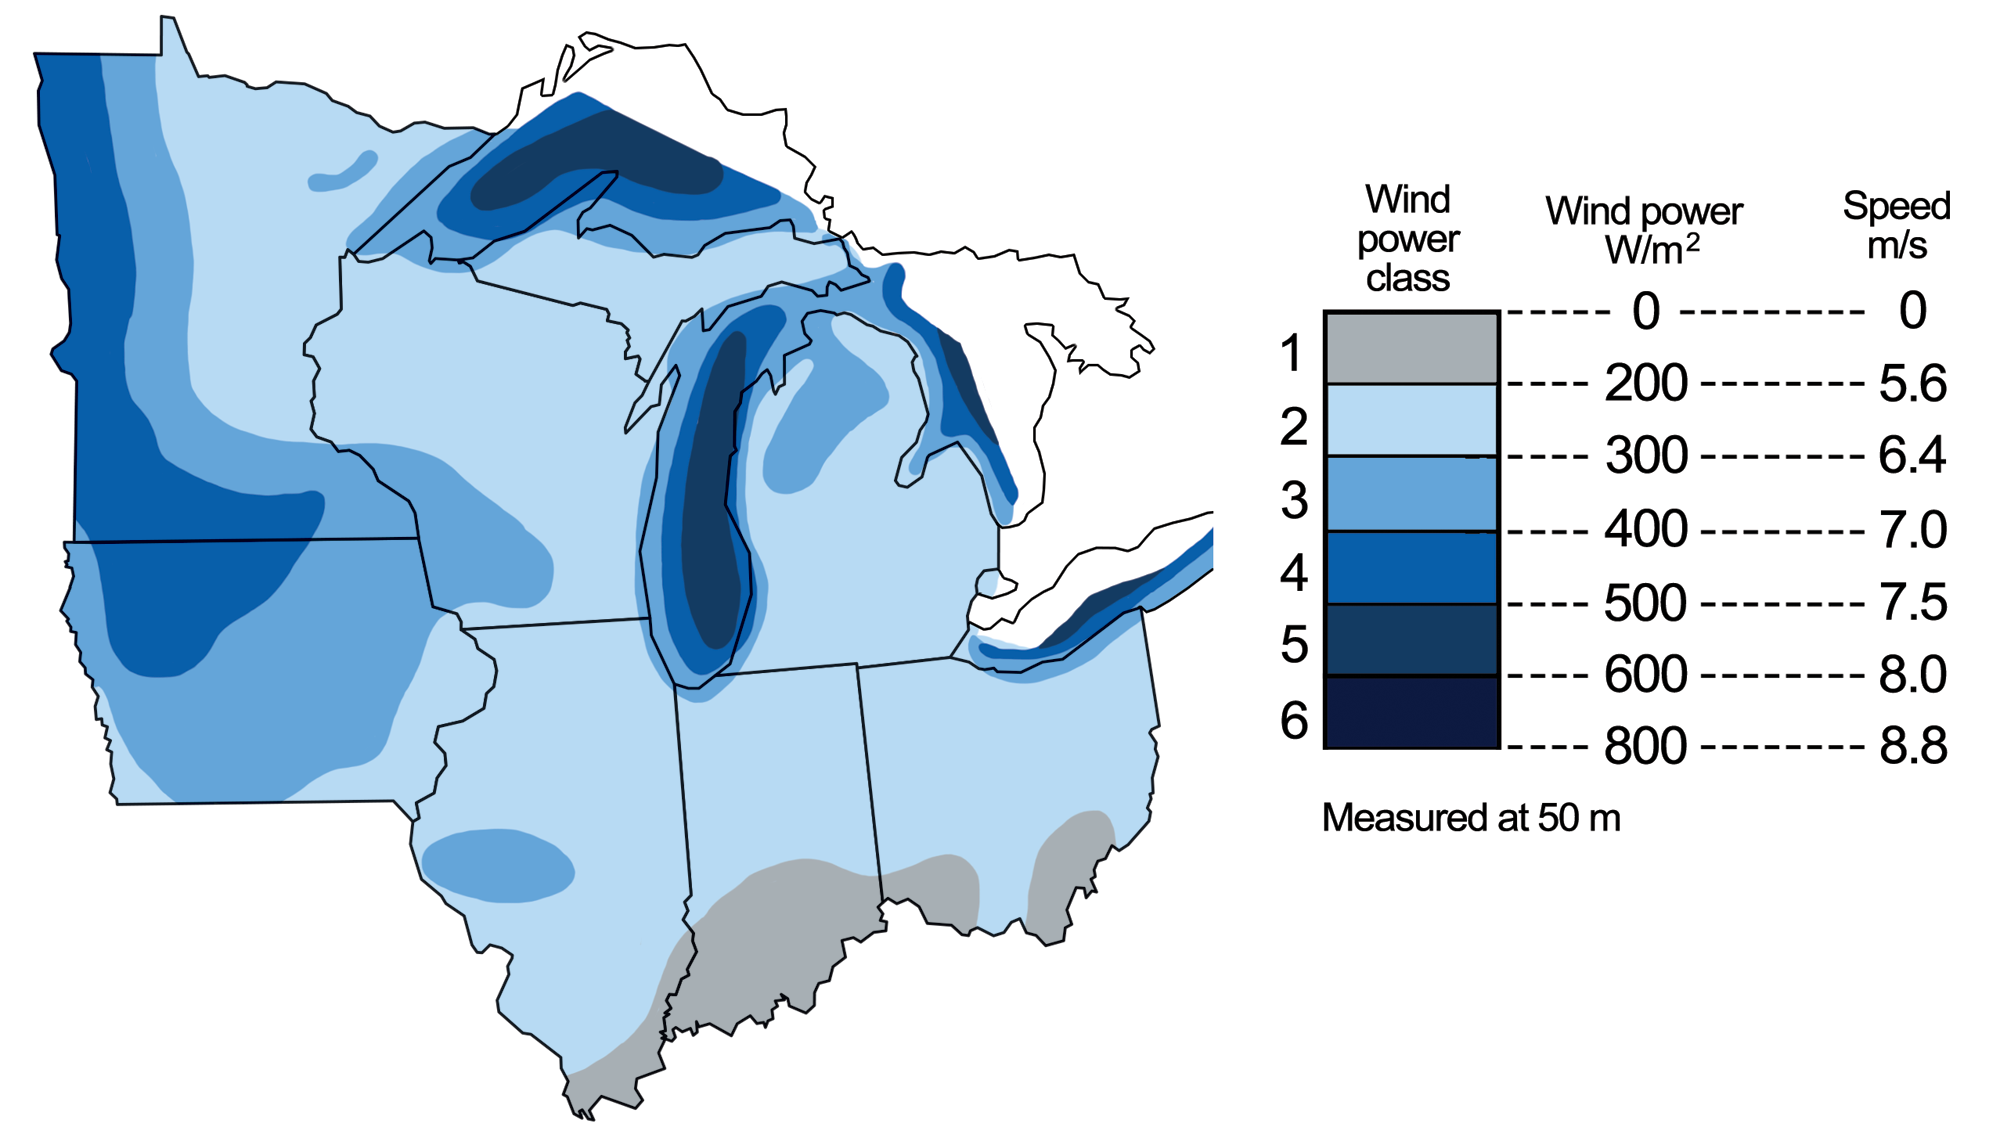
Wind energy potential in the midwestern U.S. Map modified by a map by Wade Greenberg-Brand, adapted from image by National Renewable Energy Laboratory, originally published in The Teacher-Friendly Guide to the Earth Science of the Midwestern US.
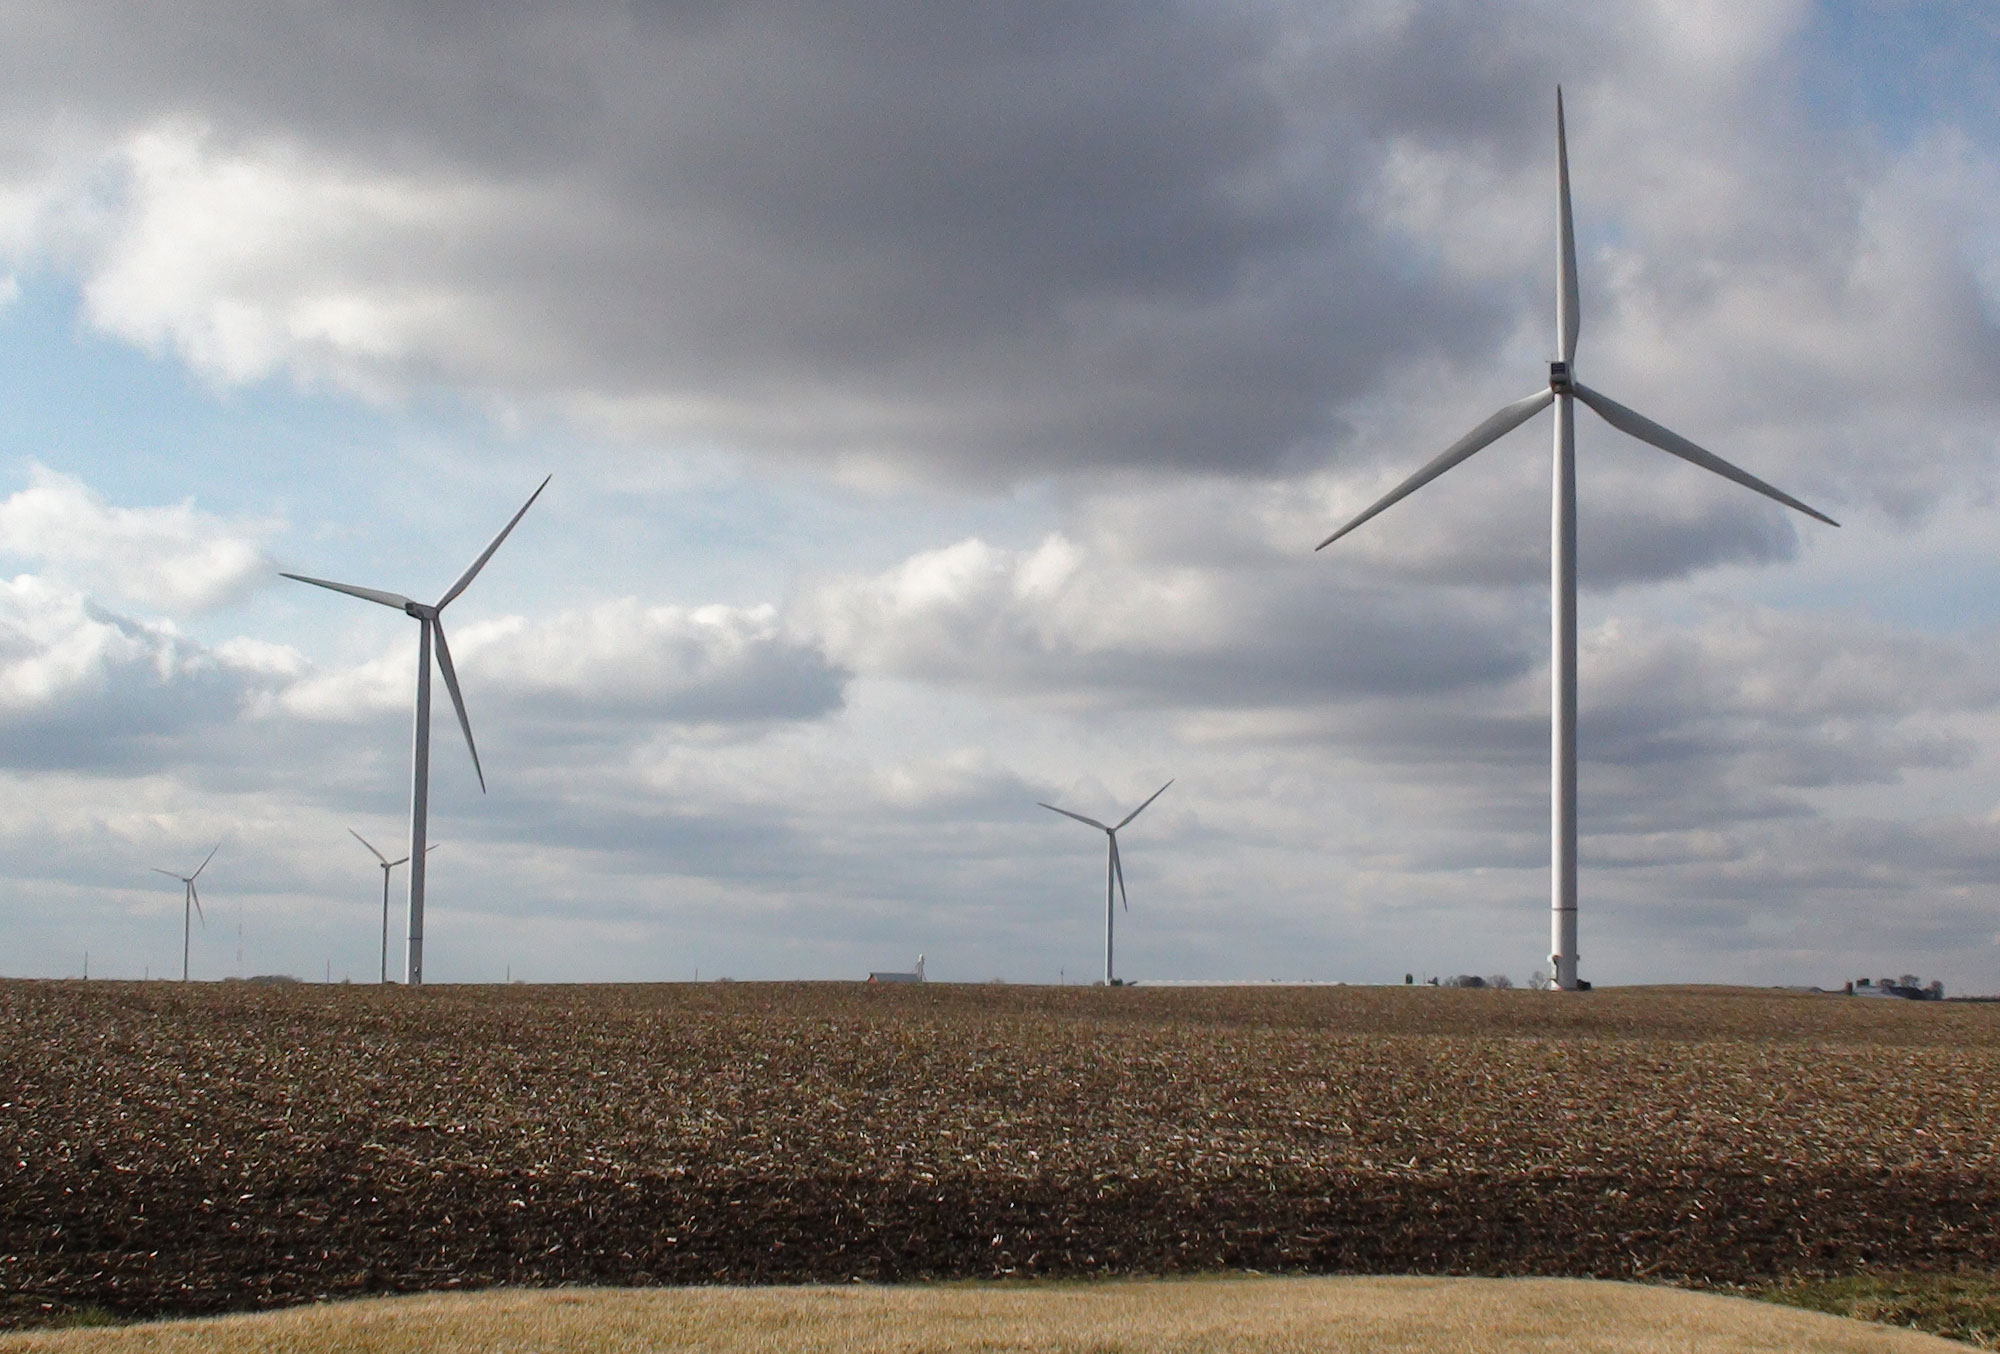
Wind turbines, Iowa. Photo by Voice of America (Wikimedia Commons, public domain).
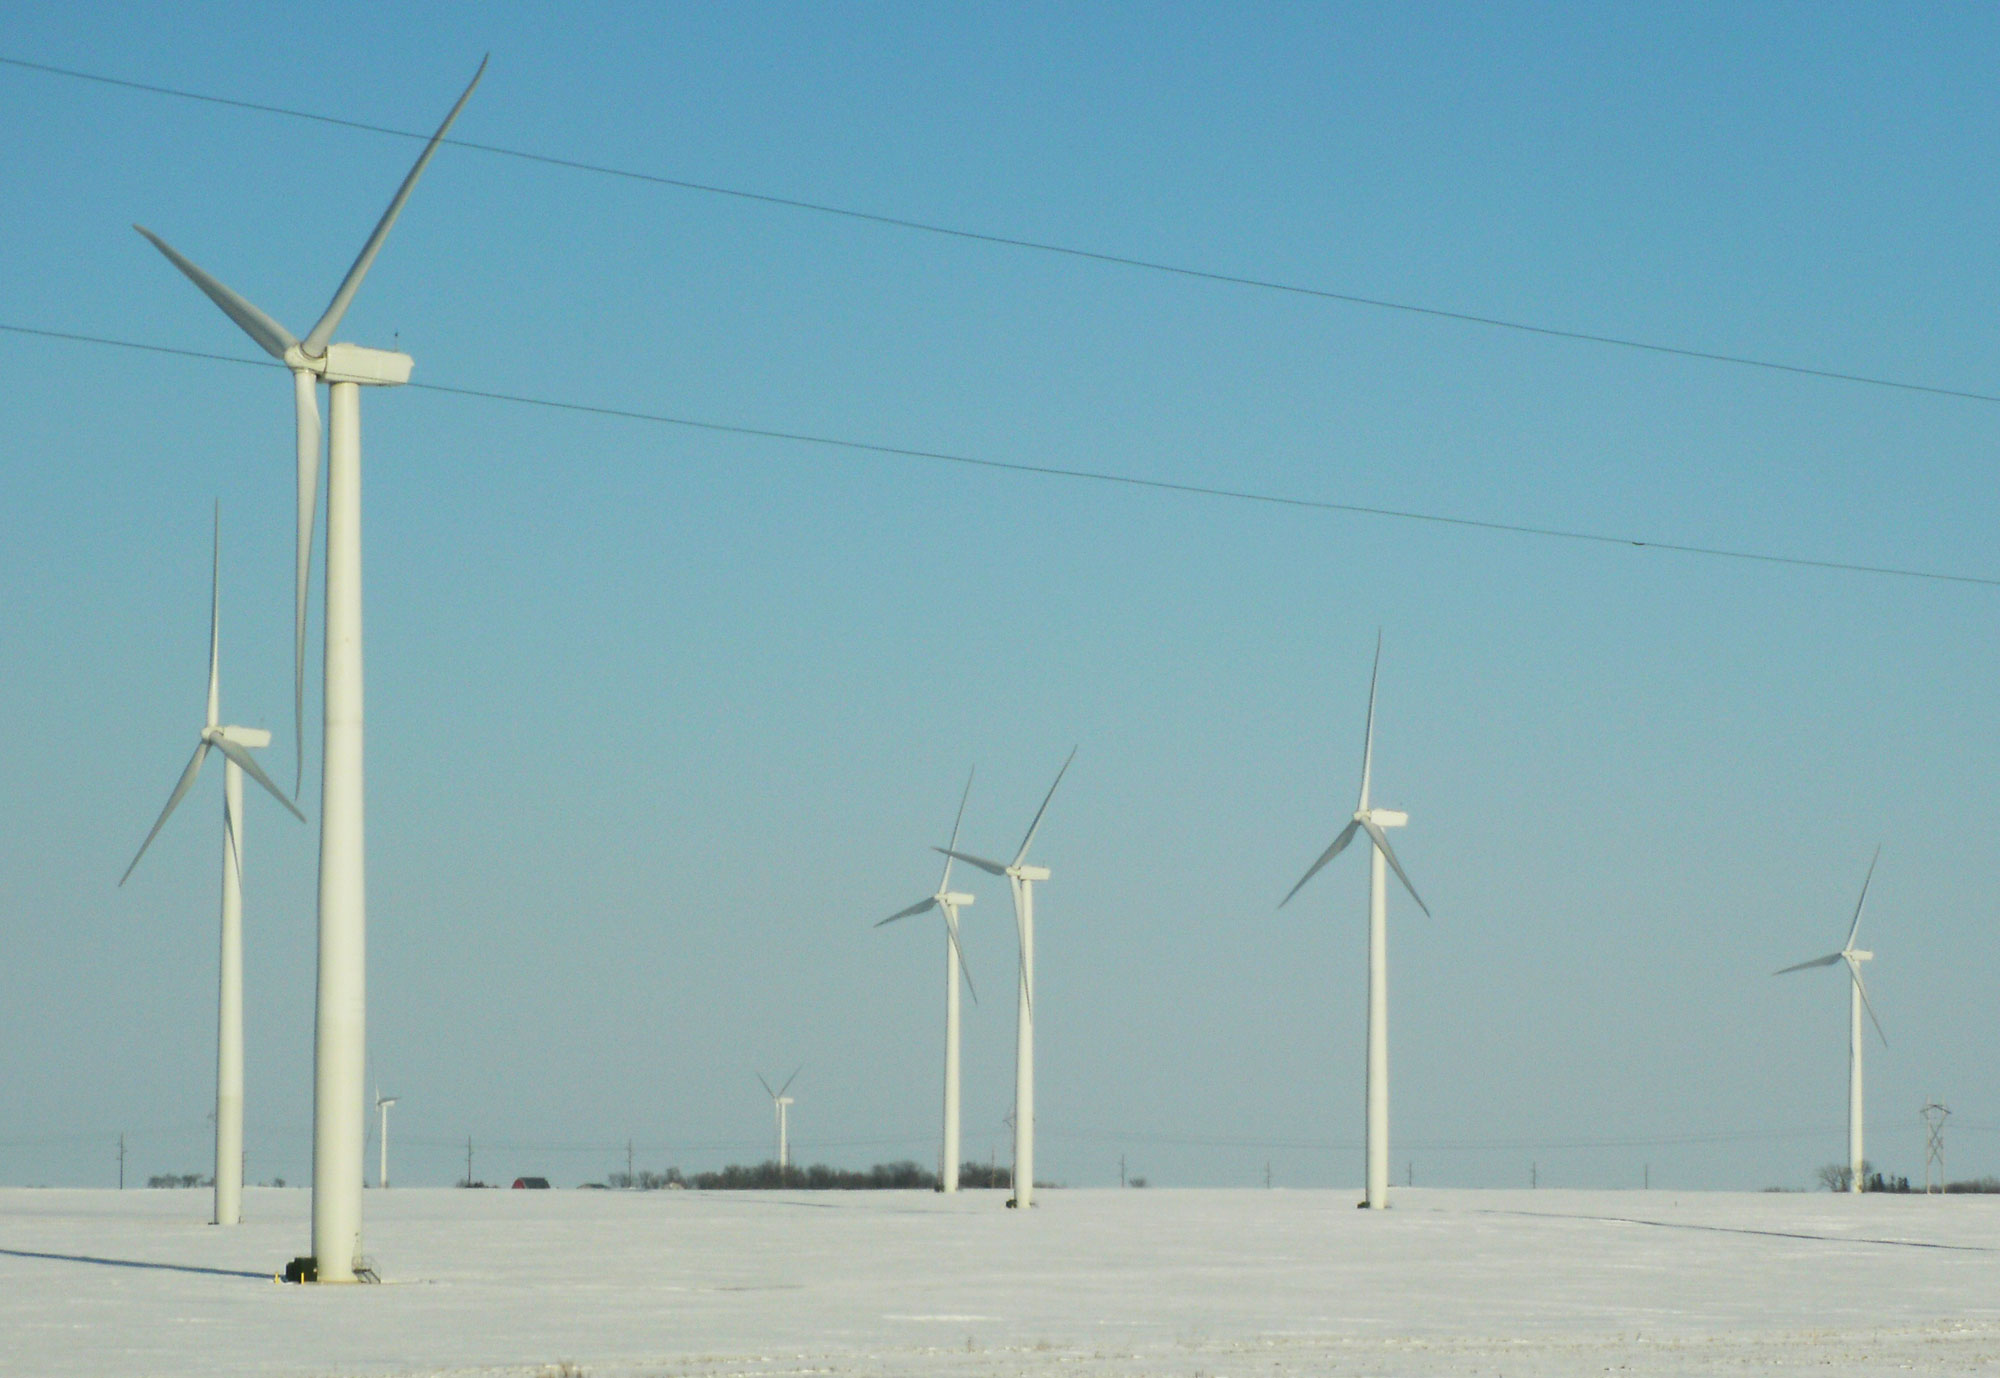
Wind turbines, Dexter, Minnesota, 2011. Photo by Rifeldeas (Wikimedia Commons, Creative Commons Attribution-ShareAlike 3.0 Unported license, image cropped and resized).
Biofuels
Biofuels (from biomass) represent a significant energy resource throughout the Midwest, with production and consumption rapidly rising. The midwestern states are major producers of both ethanol and biodiesel, and production of both has much more than doubled in the last ten years. Most gasoline in the U.S. is now blended with 10% ethanol (E10). Ethanol is not as energy dense as gasoline, so it provides about 6% of the energy in E10 gasoline. As biofuels are produced from many different crops and through a range of different processes, their environmental impact is difficult to measure.
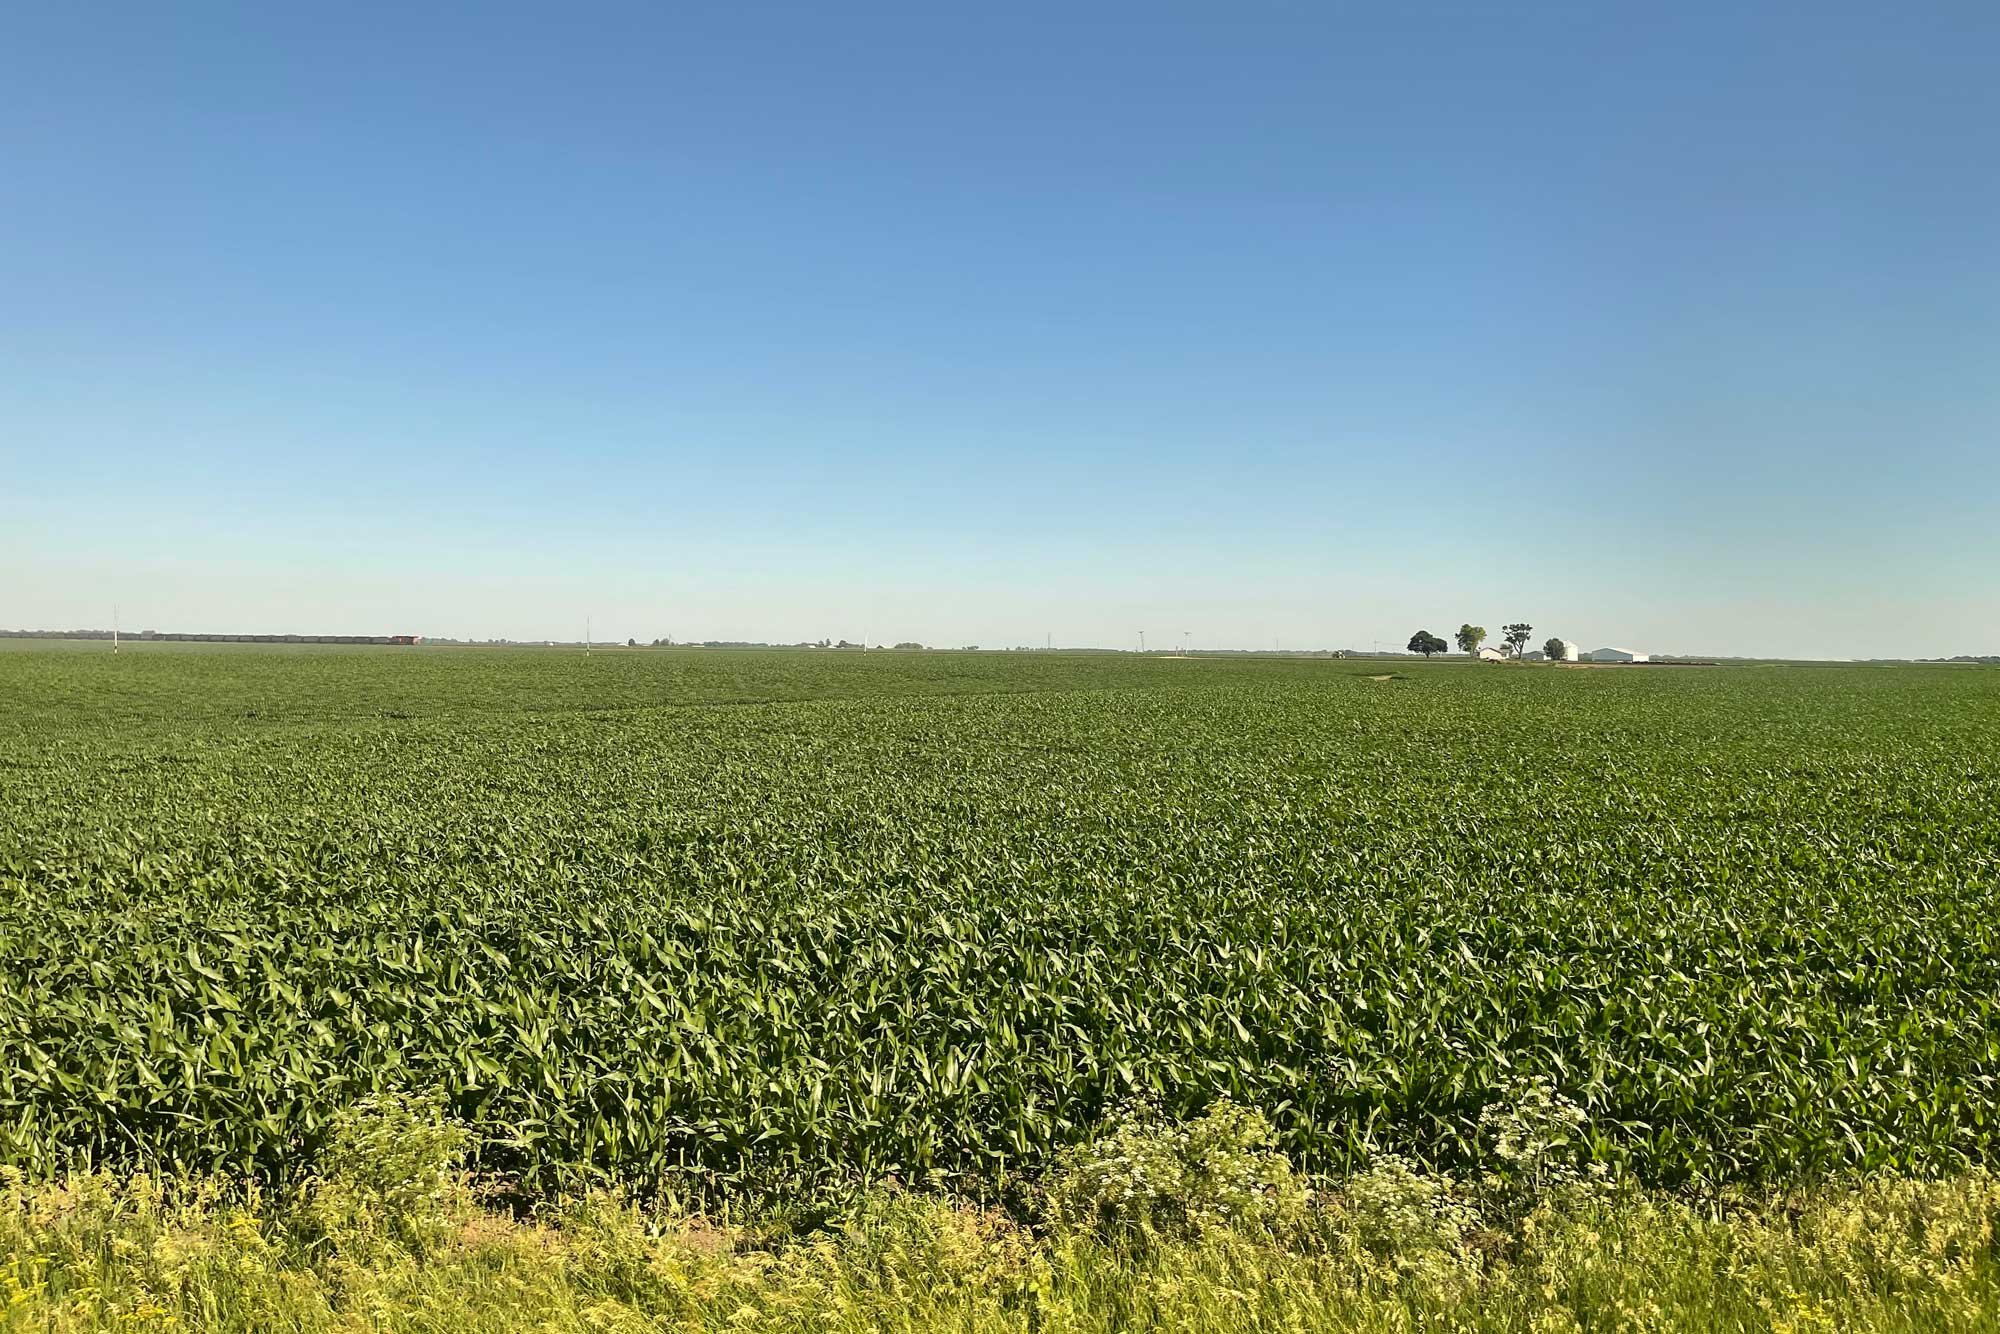
Cornfield, Warren County, Illiniois. Photo by Missvain/Sarah Stierch (Wikimedia Commons, Creative Commons Attribution 4.0 International license, image resized).
Nuclear power
Nuclear power is used to generate electricity in most midwestern states. Illinois has by far the most nuclear power plants, with a total of eleven; as of 2021, nuclear provided more than 50% of the electricity in Illinois. Michigan has four nuclear power plants, Minnesota has three, and Ohio and Wisconsin each have two. Iowa's sole nuclear power plant was shut down in 2020, and Indiana has none.
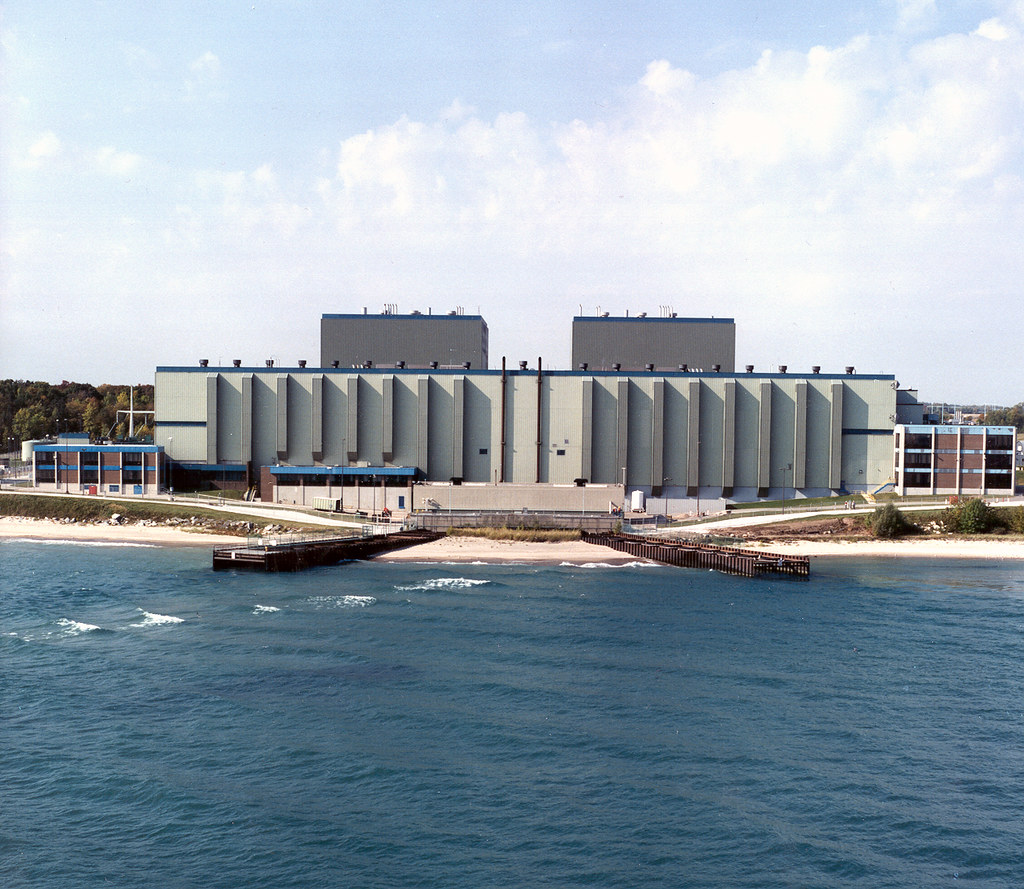
Point Beach Nuclear Plant, Manitowoc, Wisconsin. Photo copyright FPL (Nuclear Regulatory Commission on flickr, Creative Commons Attribution-NonCommercial-NoDerivs 2.0 Generic license).
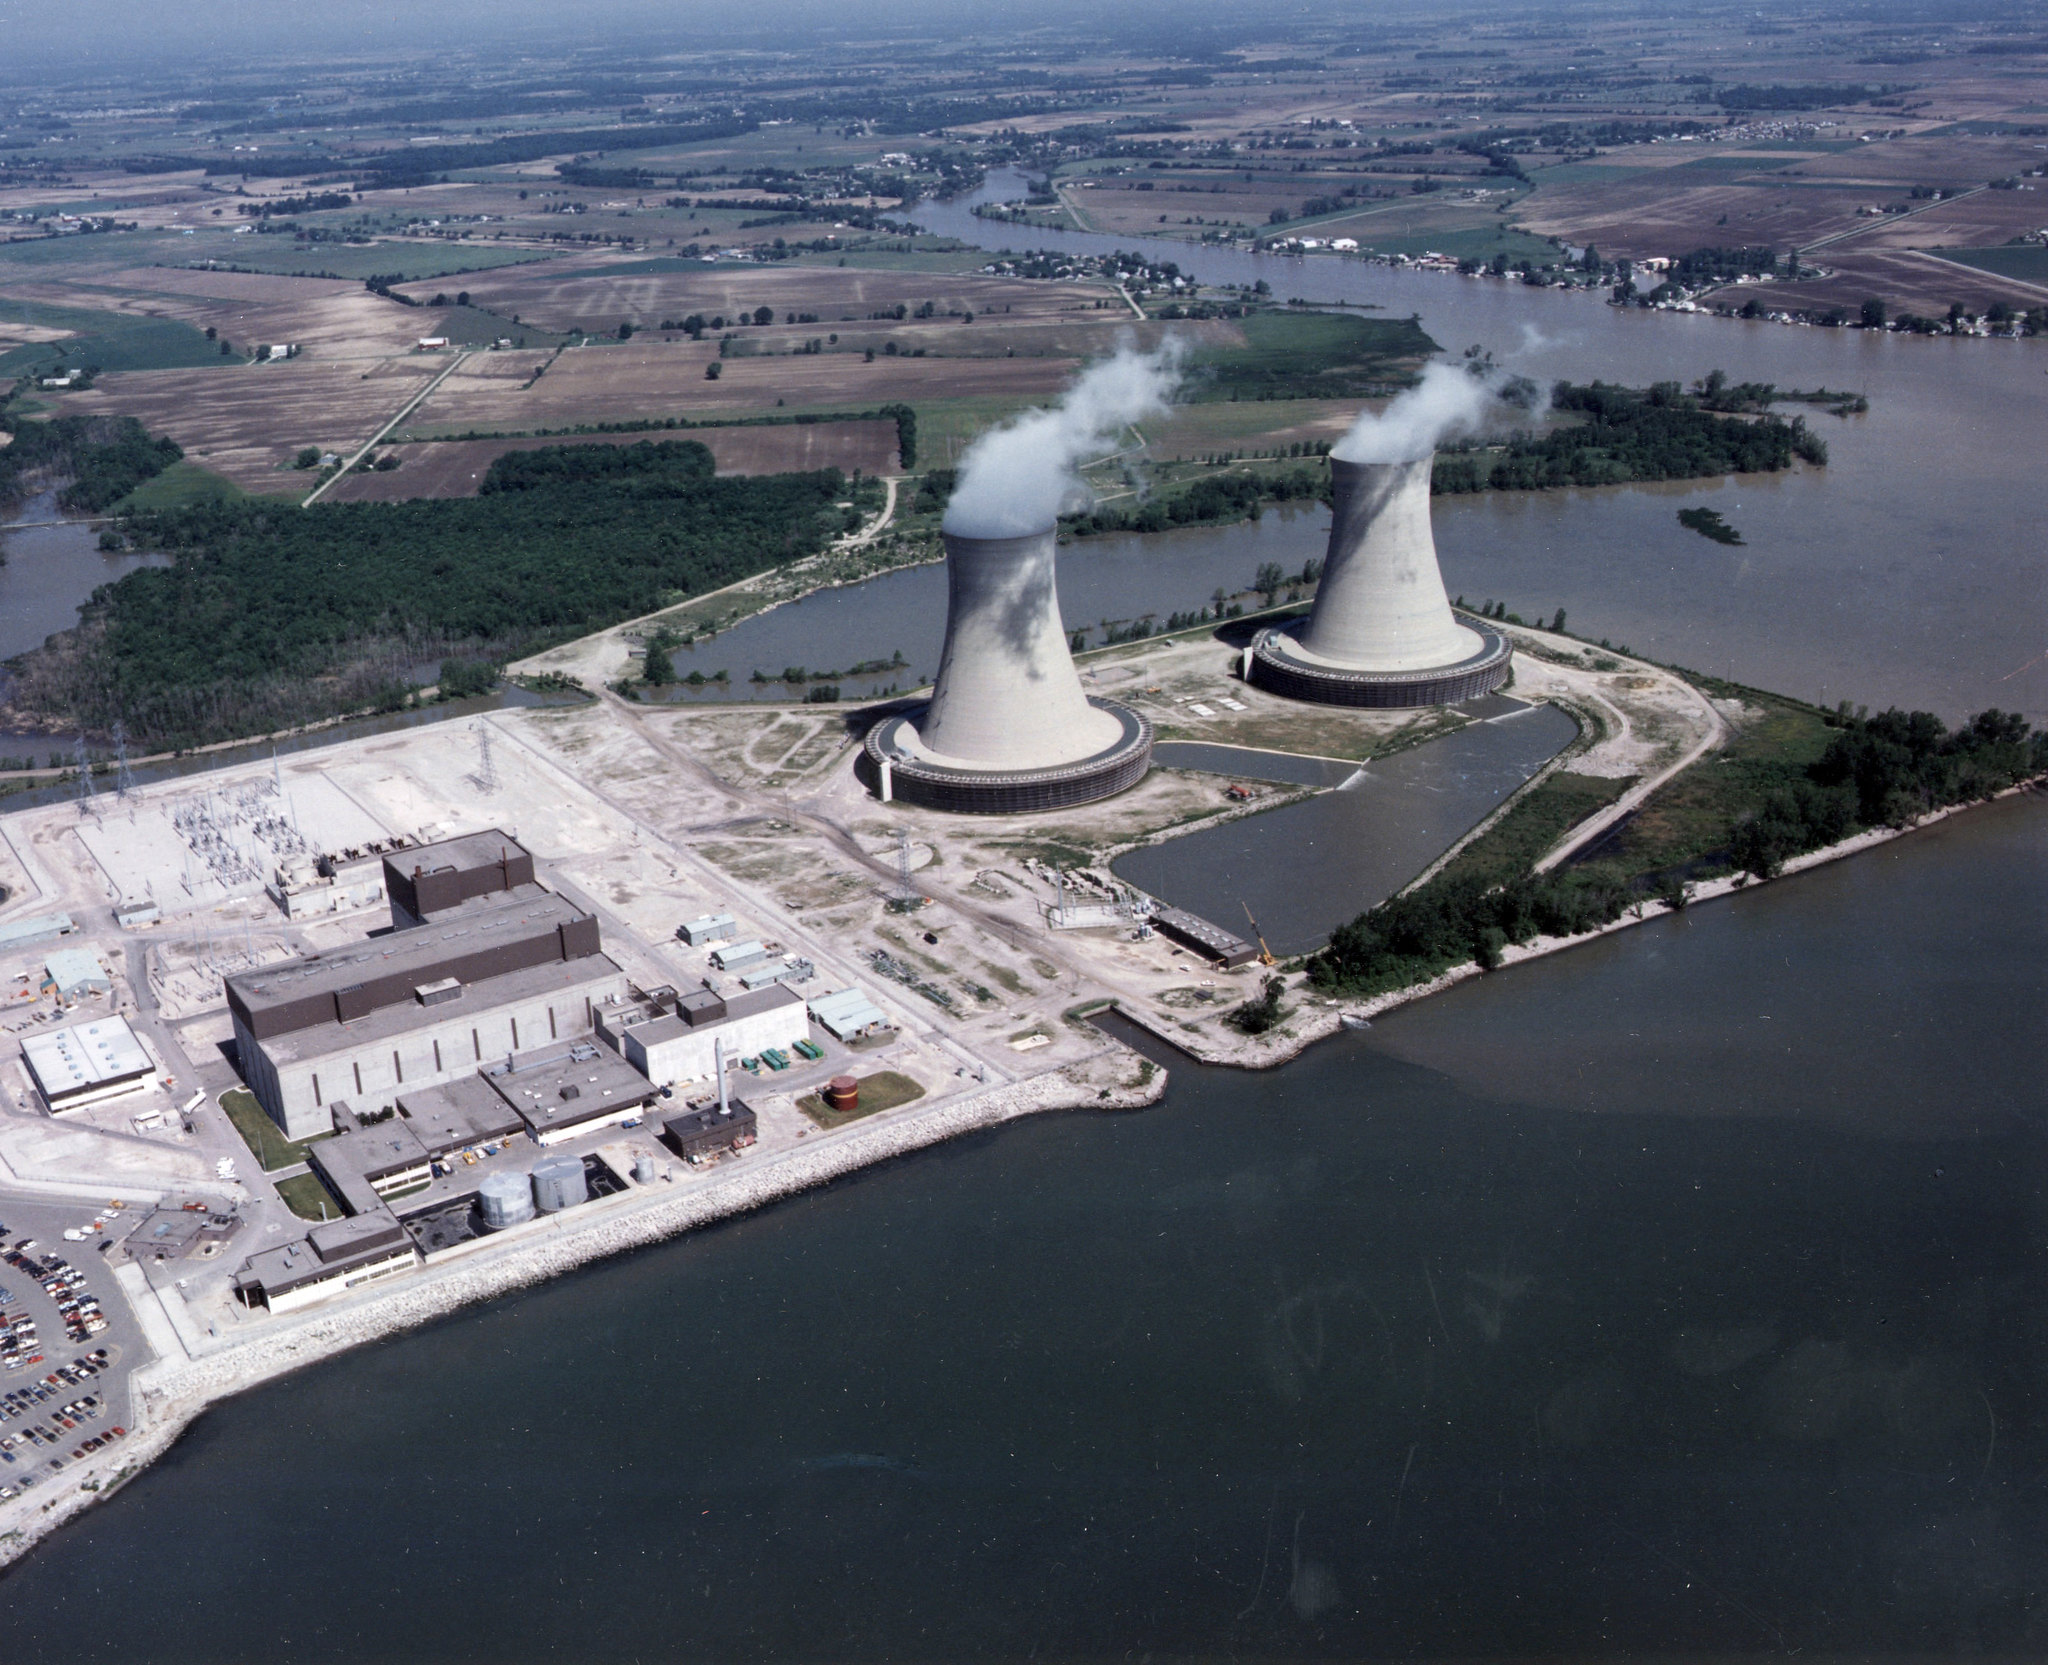
Enrico Fermi Nuclear Generating Station, Newport, Michigan. Photo copyright Detroit Edison Company (Nuclear Regulatory Commission on flickr, Creative Commons Attribution-NonCommercial-NoDerivs 2.0 Generic license).
Resources
Resources from the Paleontological Research Institution
Earth@Home: Earth Science of the Northeastern U.S. (energy in the Central Lowland and Inland Basin regions of Maryland, New York, Pennsylvania, and Vermont): https://earthathome.org/hoe/ne/energy/
Earth@Home: Earth Science of the South-central U.S.: Energy in the Central Lowland and Interior Highlands (energy in the Central Lowland region of Arkansas, Kansas, Oklahoma, and Texas): https://earthathome.org/hoe/sc/energy-cl-ih
Earth@Home: Earth Science of the Southeastern U.S.: Energy in the Inland Basin (energy in the Inland Basin region of Alabama, Georgia, Kentucky, Mississippi, Tennessee, Virginia, and West Virginia): https://earthathome.org/hoe/se/energy-ib
Earth@Home: Introduction to Energy: https://earthathome.org/hoe/energy