


Classroom exercise on cost-benefit assessment
A high school is in a region that is experiencing more intense heat waves, especially during June when classes are wrapping up and students are taking final exams. The school has inadequate cooling systems, and people are concerned about heat-related illness affecting the staff and students. Several students have already been taken to the hospital, suffering from heat stress.
The administration is considering several options to deal with extreme heat. Evaluate the costs and benefits of each option, and come up with a recommendation for what action(s) to take based on this analysis. You can add options that are not listed here.
Adaptation options:
- Install a building-wide central air conditioning system;
- Install window air conditioners in classrooms, staff offices, the library and gym, but not elsewhere in the building;
- Provide ice water stations in the hallways for students to use in between classes;
- Shorten winter break and spring break so that school can end earlier in May, when heat waves are less likely;
- Start school two hours earlier, to avoid the afternoon heat;
- Avoid the afternoon heat by ending the school day earlier, but add school on Saturday to make up for the lost time.

Image: Canva.com
Essential and non-essential uses of water
What are examples of essential and non-essential uses of water? Consider households, cities, farms, and non-agricultural businesses or industries (including energy producers). Have the students research the proportion of water use for residential, commercial, and agricultural purposes in their state.
One possible source of data is the U.S. Environmental Protection Agency. See their websites on water use and state water facts:
Image: Canva.com
Equality, equity, and justice: The 4th Box
This activity was created by the Interaction Institute for Social Change and the Center for Story-based Strategy, and it uses an artist's illustration of a metaphor for the concepts of equality, equity, and justice.
The activity is called The 4th Box, and it presents the illustration below which includes an an empty fourth box for participants to fill in with their own ideas. These ideas could focus on a story connecting the different boxes, the fence and the assumptions behind its presence, an illustration of today's situation, and many other concepts. A teaching toolkit is freely available from the Center for Story-based Strategy, in both English and Spanish. The toolkit contains suggestions for discussion topics and tips for facilitation.
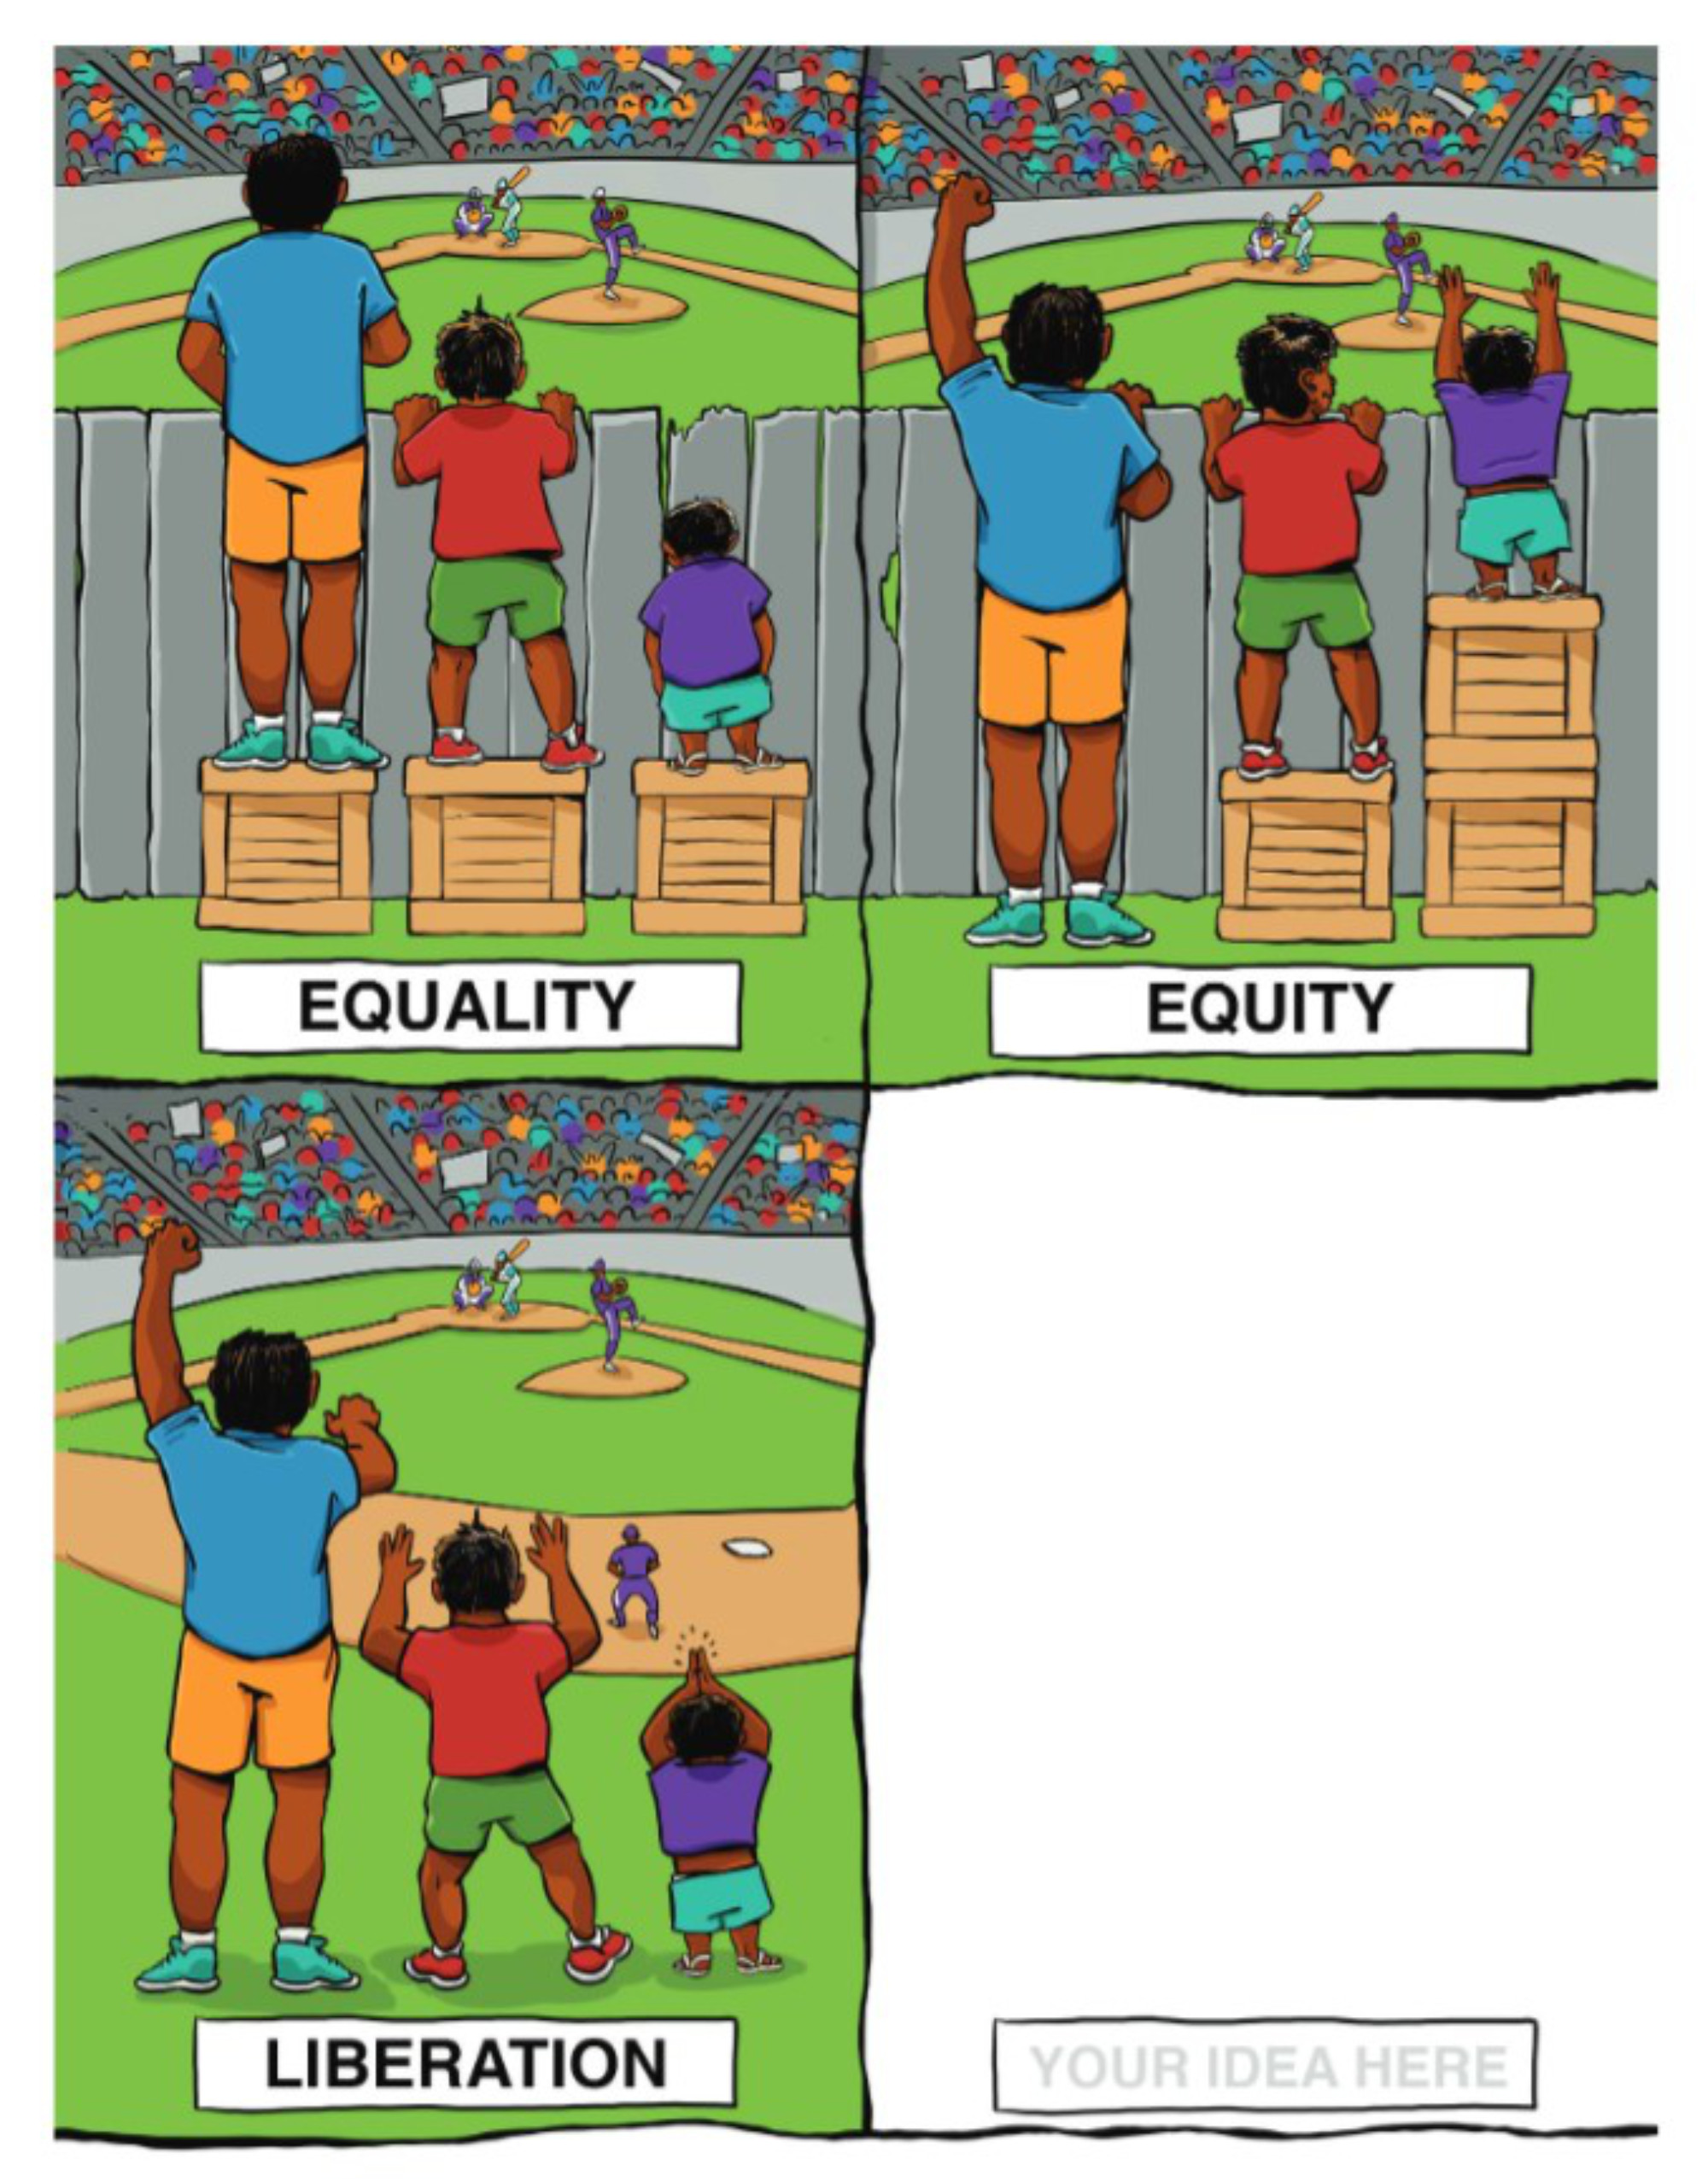
Image: A collaboration between Center for Story-based Strategy & Interaction Institute for Social Change. Artwork by Angus Maguire. CC BY-SA 4.0
Discussion: CO₂ emissions and global climate justice
The CO₂ emissions data in this exercise come from OurWorldInData.org, which uses data from the Global Carbon Project. The emissions are from fossil fuels and industry, but do not include emissions from land use change. Please note that the world's energy systems are changing very rapidly, so if you use this activity it is worthwhile to look up the latest data.
In 2017, the five countries (or groups of countries, in the case of the European Union) that emitted the most CO₂ were 1) China, 2) U.S.A., 3) the European Union, 4) India, and 5) Russia.
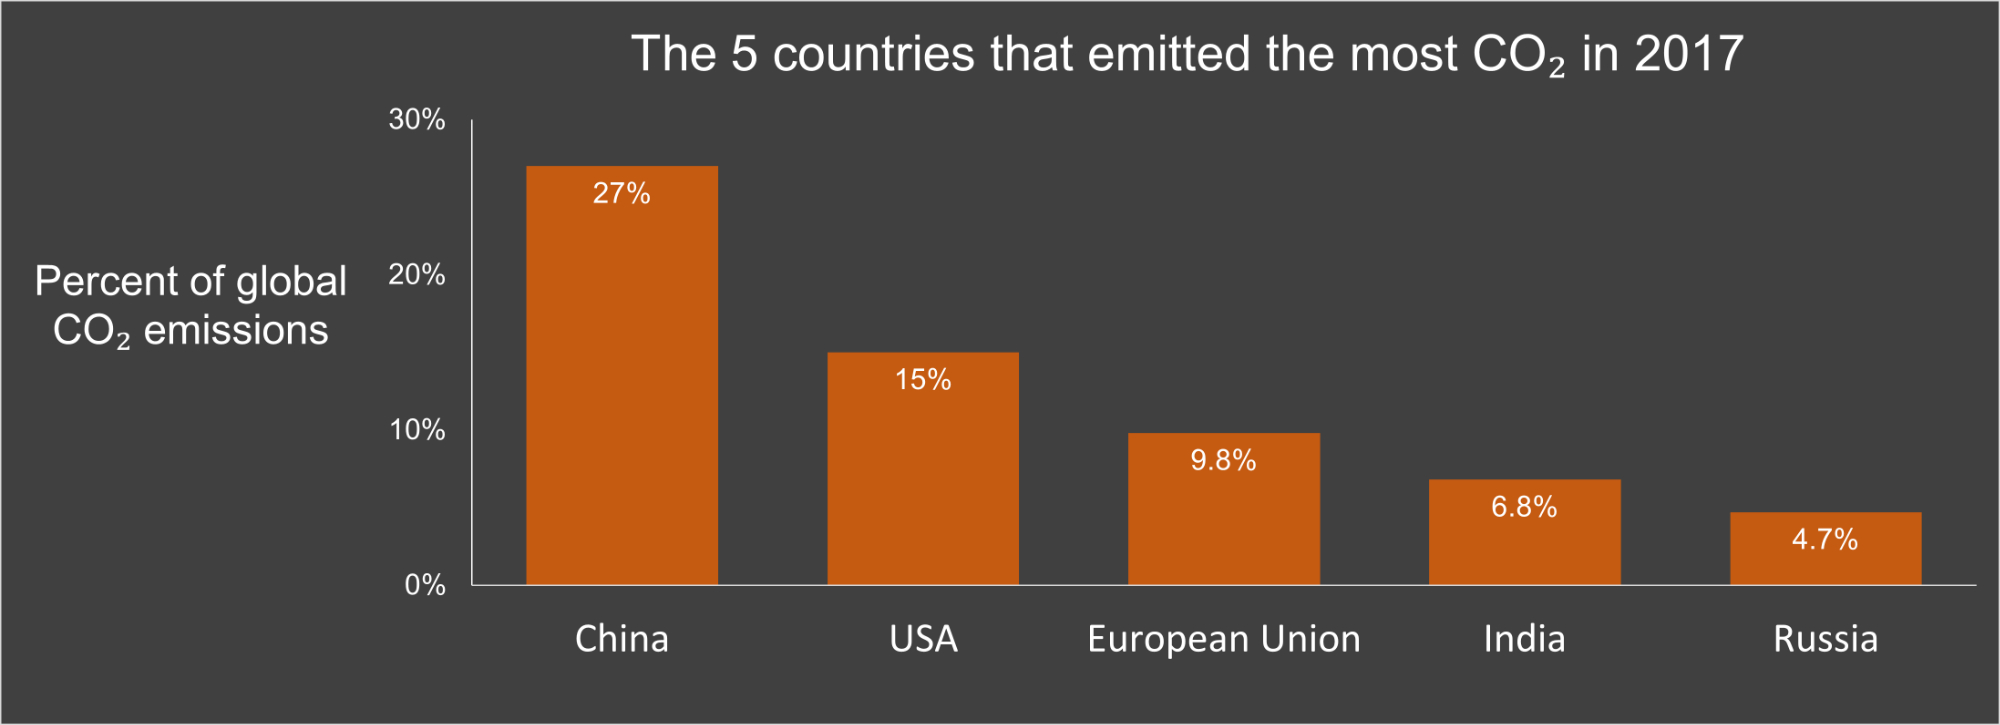
Figure created by Ingrid Zabel for PRI's Earth@Home project (CC BY-NC-SA 4.0 license), with data from OurWorldInData.org
Per capita emissions (amount of CO₂ emitted per person) by country from 2017 have a different profile: 1) Qatar, 2) Trinidad and Tobago, 3) Curacao, 4) Kuwait, and 5) Brunei. Why might this be? Consider the population sizes of these countries and their large industries.
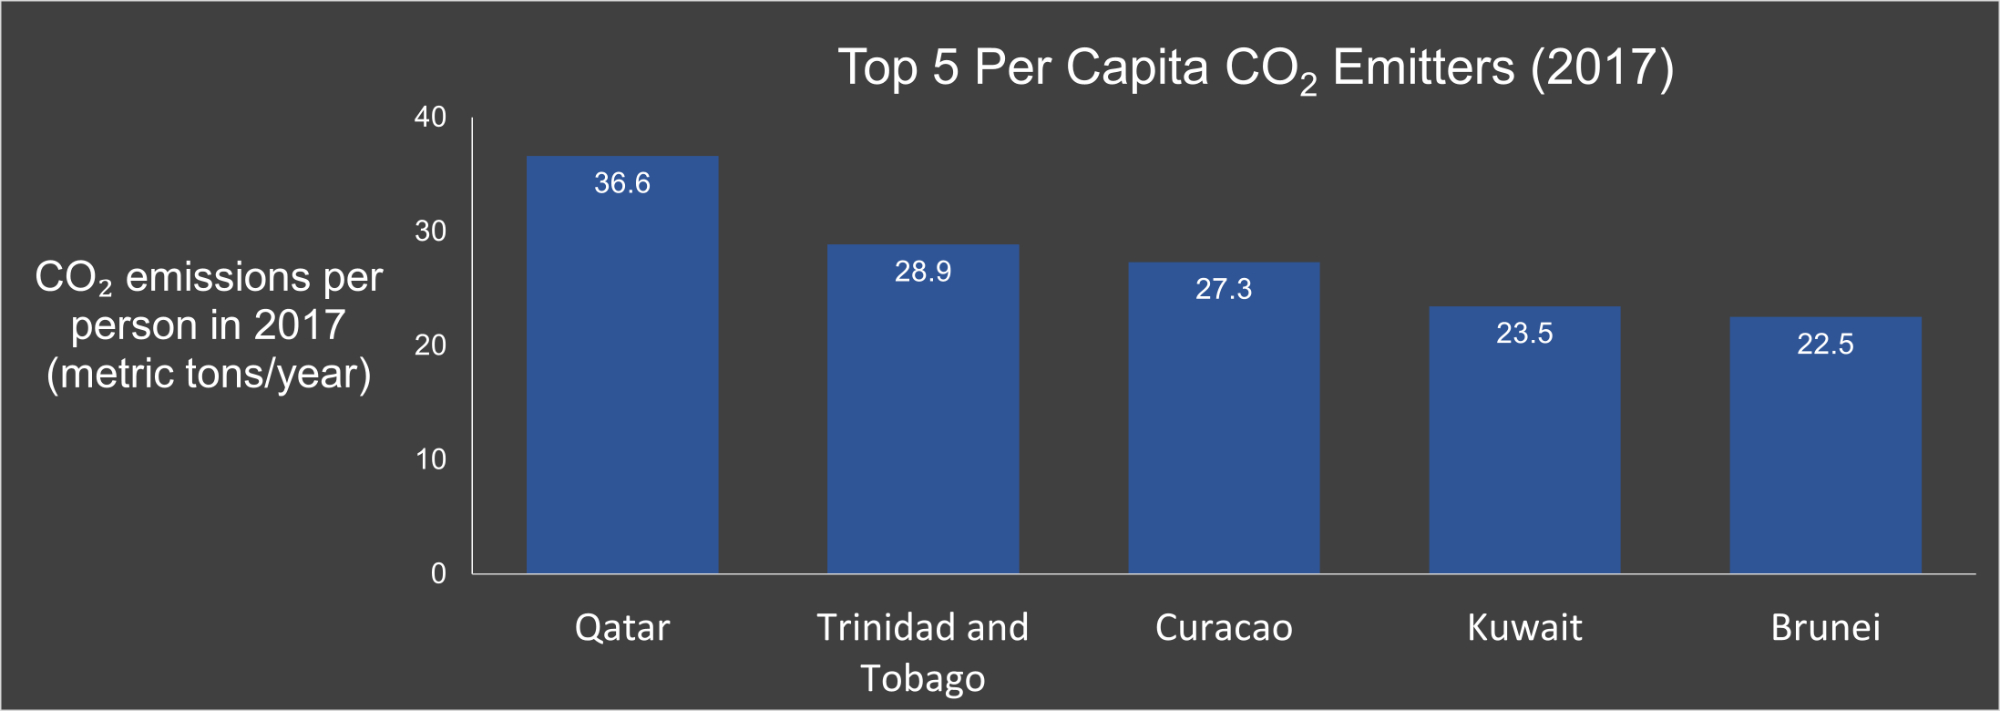
Figure created by Ingrid Zabel for PRI's Earth@Home project (CC BY-NC-SA 4.0 license), with data from OurWorldInData.org
For countries with large populations (over 25 million people), per capita CO₂ emissions from fossil fuels and industry are shown in the graph below and ranked as follows: 1) Saudi Arabia, 2) Australia, 3) U.S.A., 4) Canada, and 5) South Korea. China and India, two of the top 5 total emitters, had per capita emissions of 5.2 and 1.1 metric tons/person, respectively.
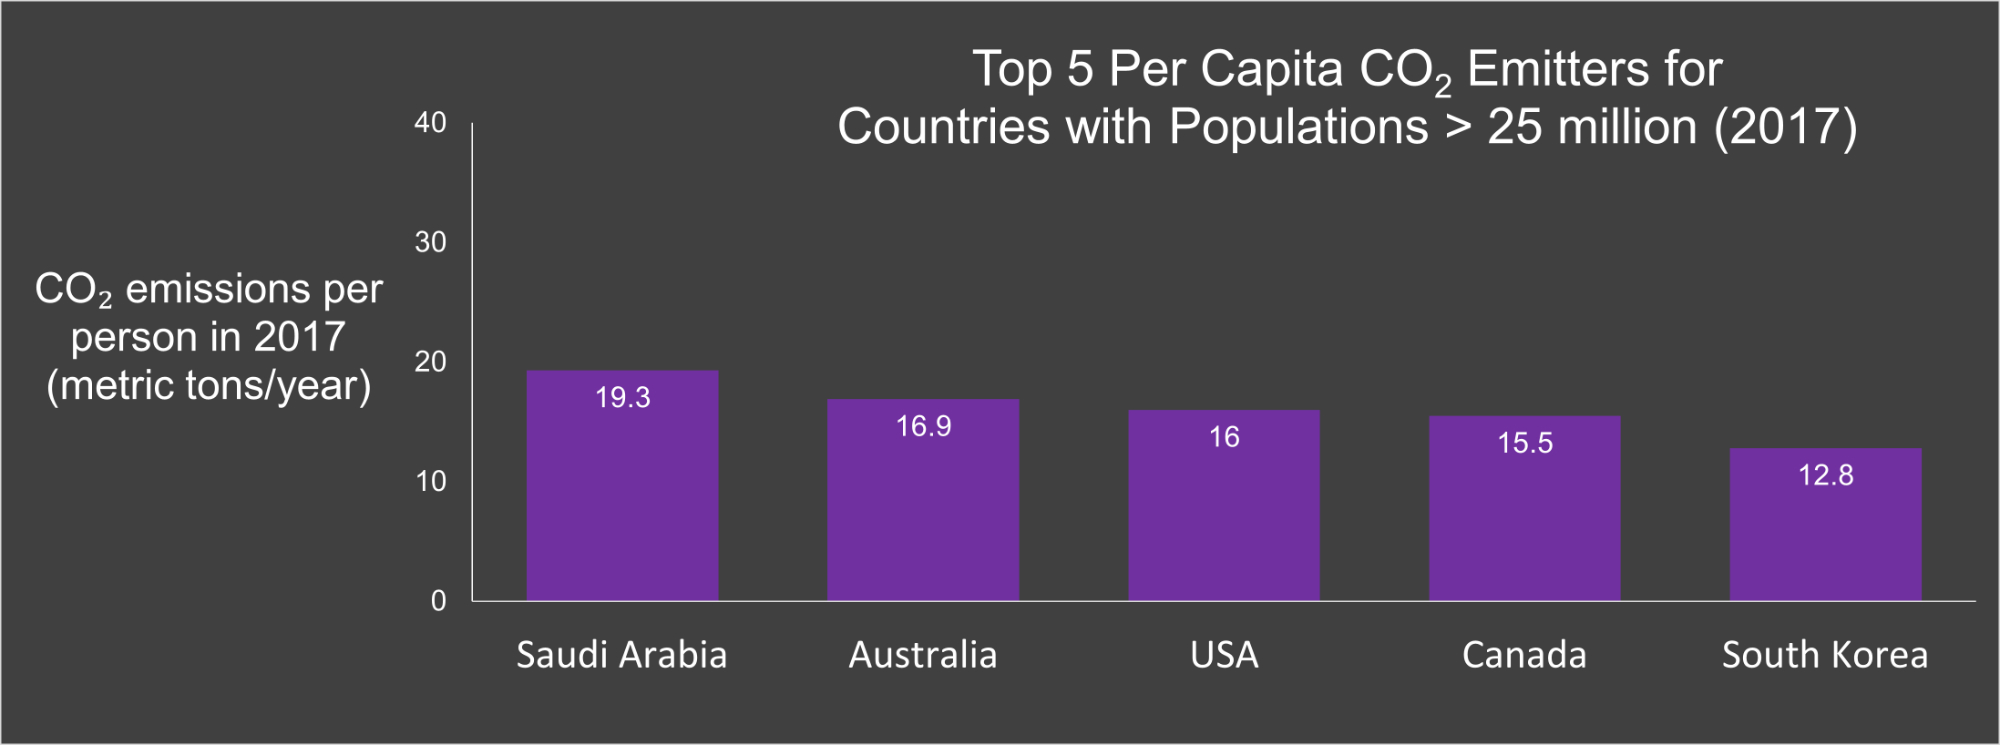
Figure created by Ingrid Zabel for PRI's Earth@Home project (CC BY-NC-SA 4.0 license), with data from OurWorldInData.org
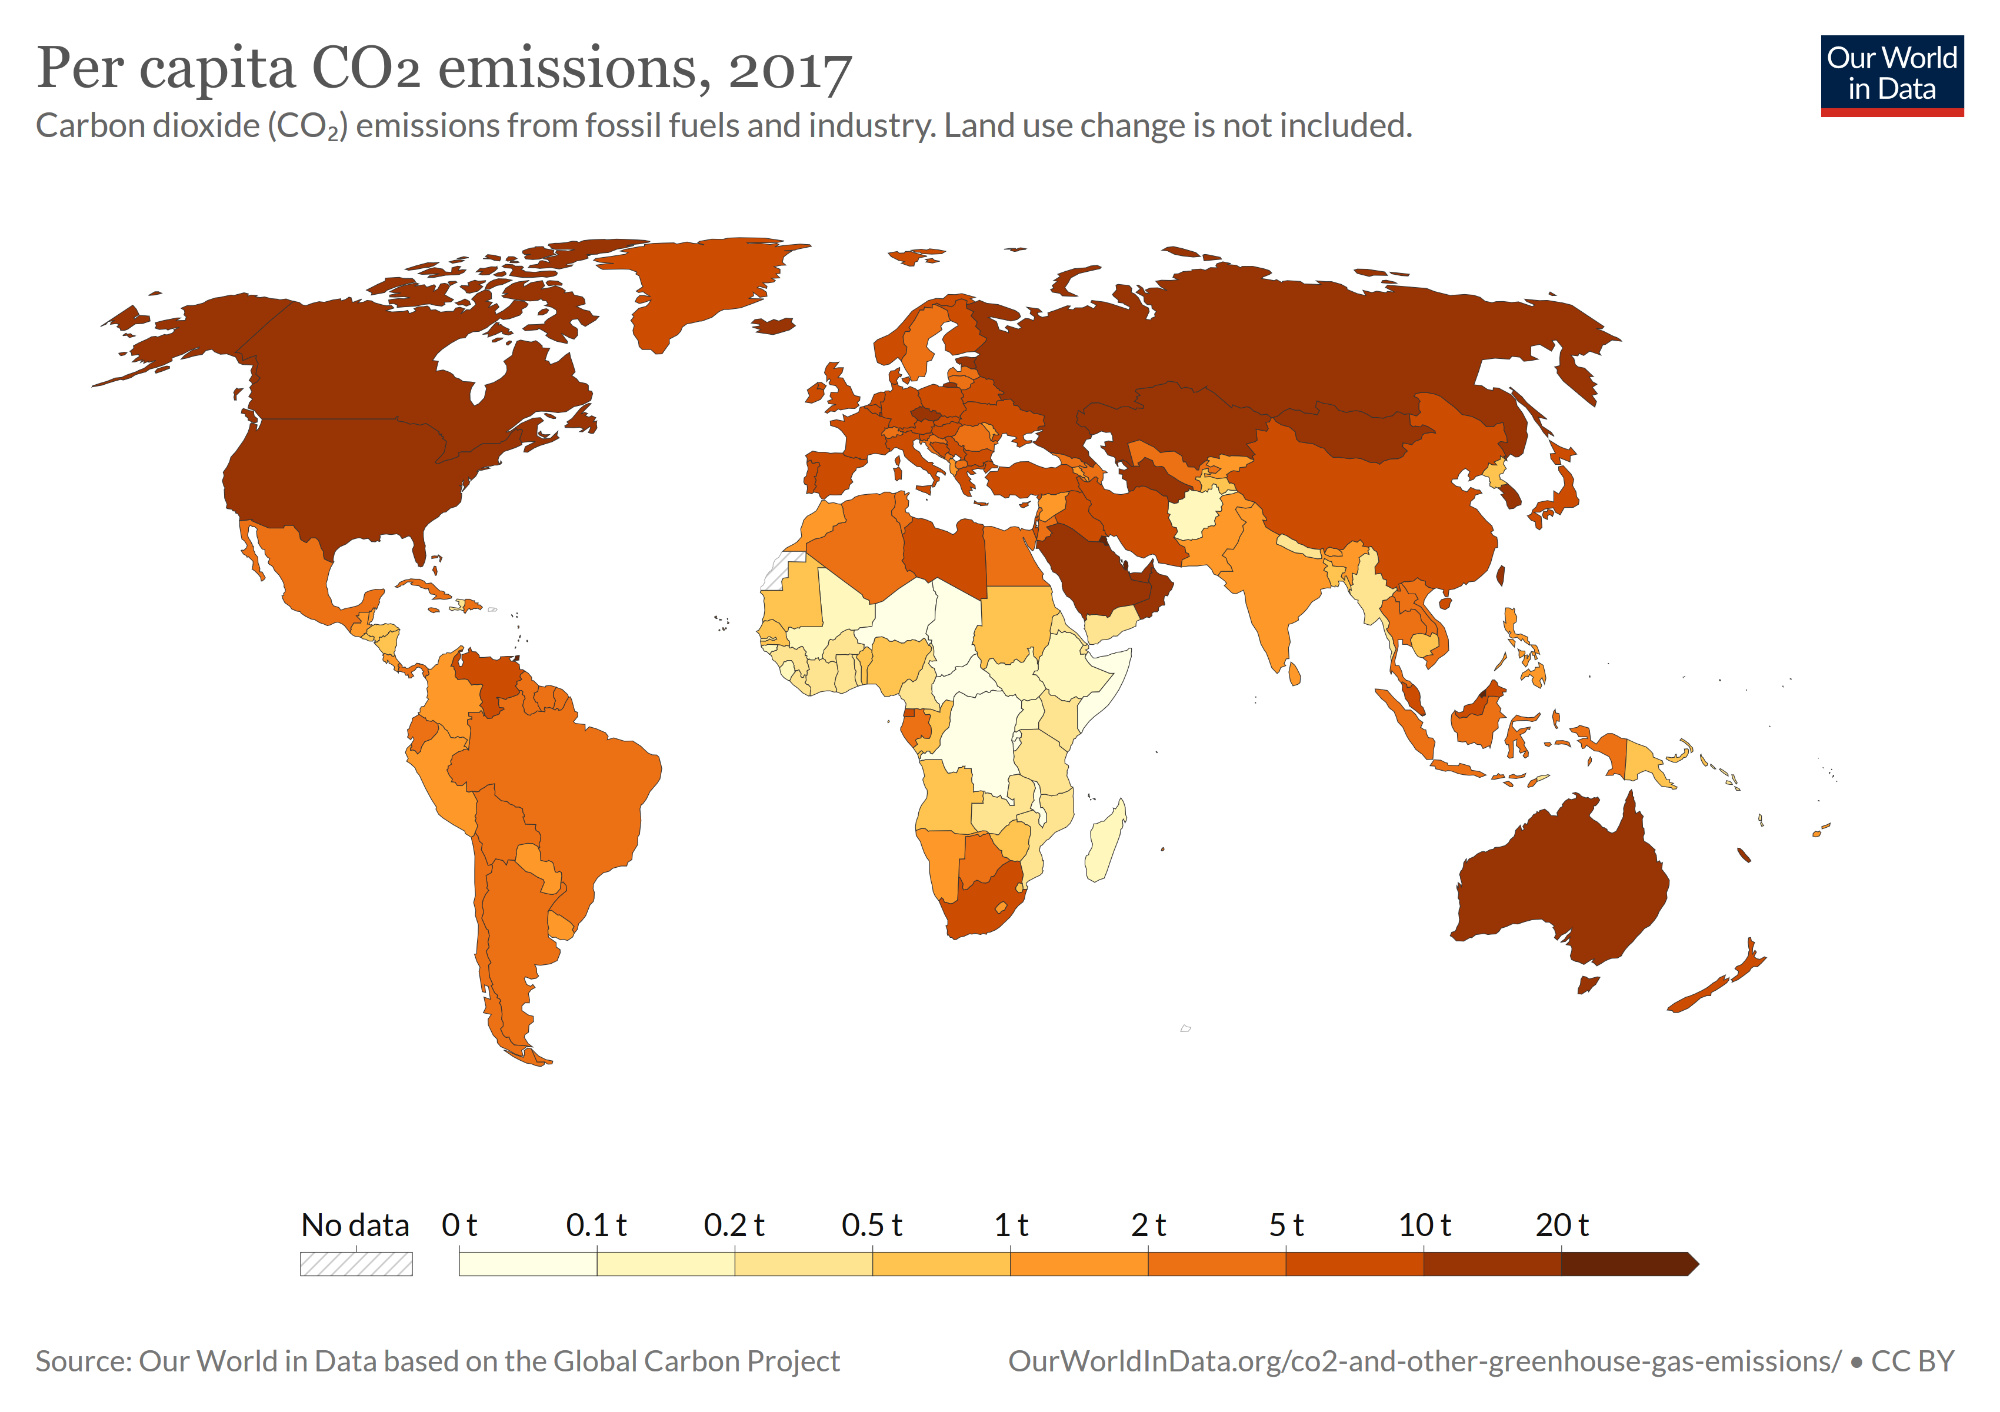
The countries with the lowest per capita emissions in 2017 are all in Africa, as shown in the graph below (note the change in vertical axis scale compared with the previous two graphs), and the world map below the graph. These countries are 1) Democratic Republic of Congo, 2) Somalia, 3) Central African Republic, 4) Burundi, and 5) Chad.
Putting this in perspective, per capita emissions in the U.S. are over 500 times larger than those of the Democratic Republic of Congo. Another way to look at this is that on average, an American’s release of CO₂ in a day is 0.04 metric tons (=16 metric tons/year ÷ 365 days/year). So it takes an American, on average, only one day to release the amount of CO₂ that the average Somalian releases in a year.
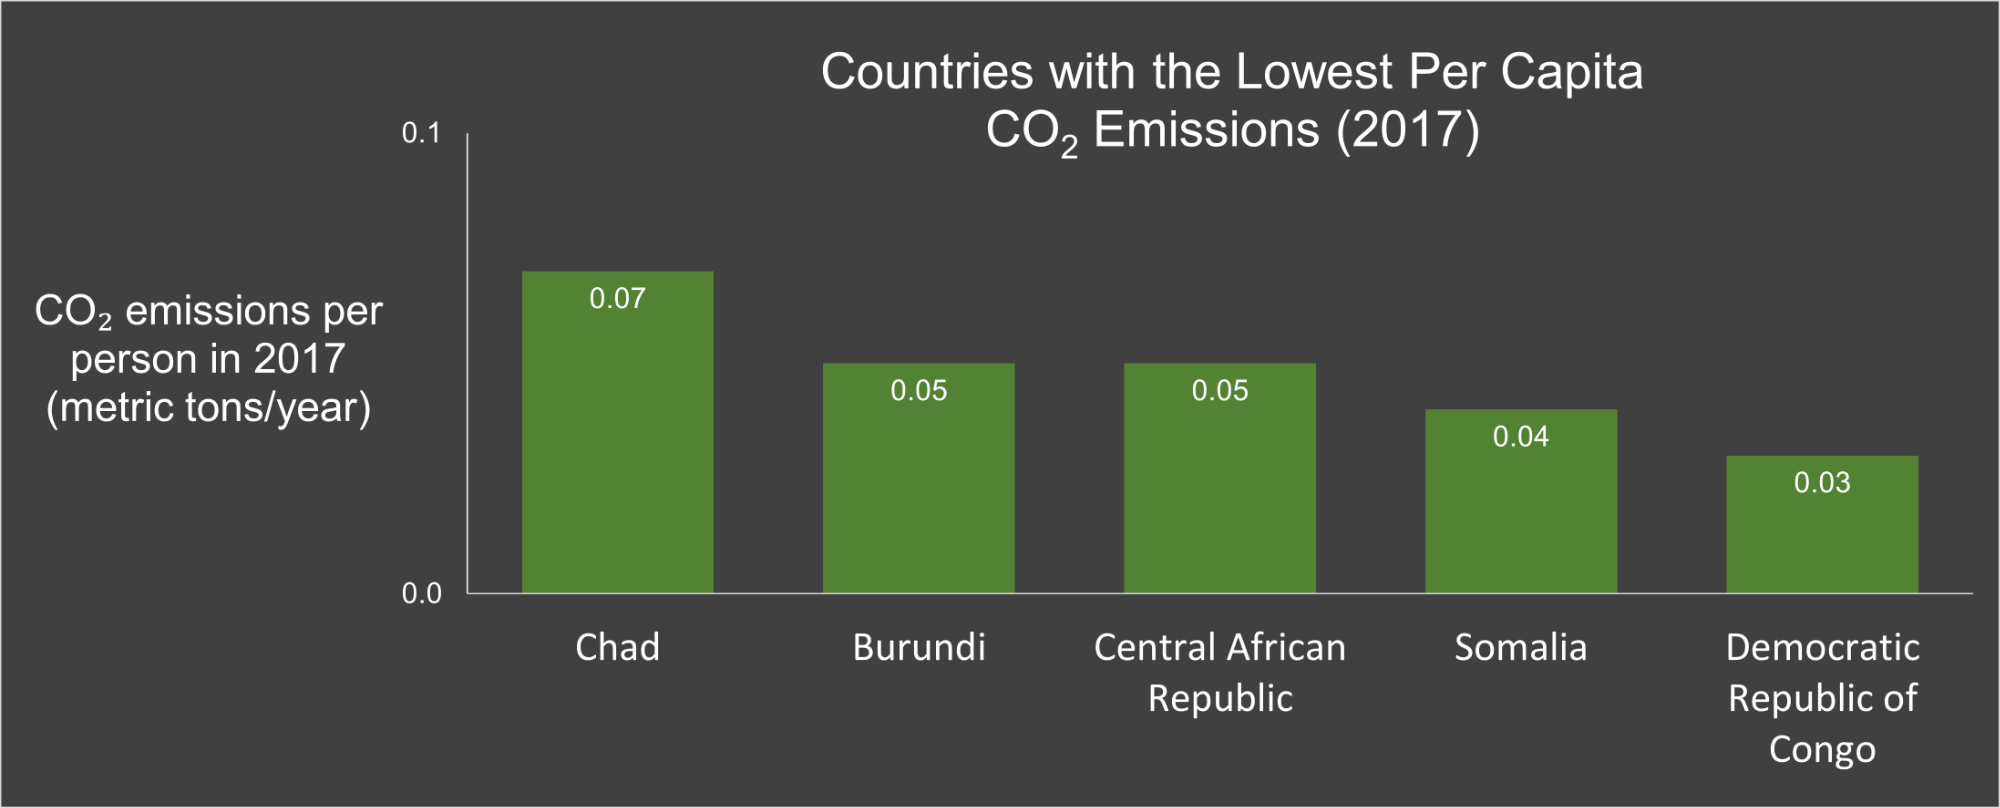
Figure created by Ingrid Zabel for PRI's Earth@Home project (CC BY-NC-SA 4.0 license), with data from OurWorldInData.org
Finally, the rankings for cumulative emissions from 1751 to 2017 are as follows: 1) U.S.A., 2) European Union, 3) China, 4) Russia, and 5) Japan. These countries have released the most CO₂ into the atmosphere since the beginning of the Industrial Revolution.
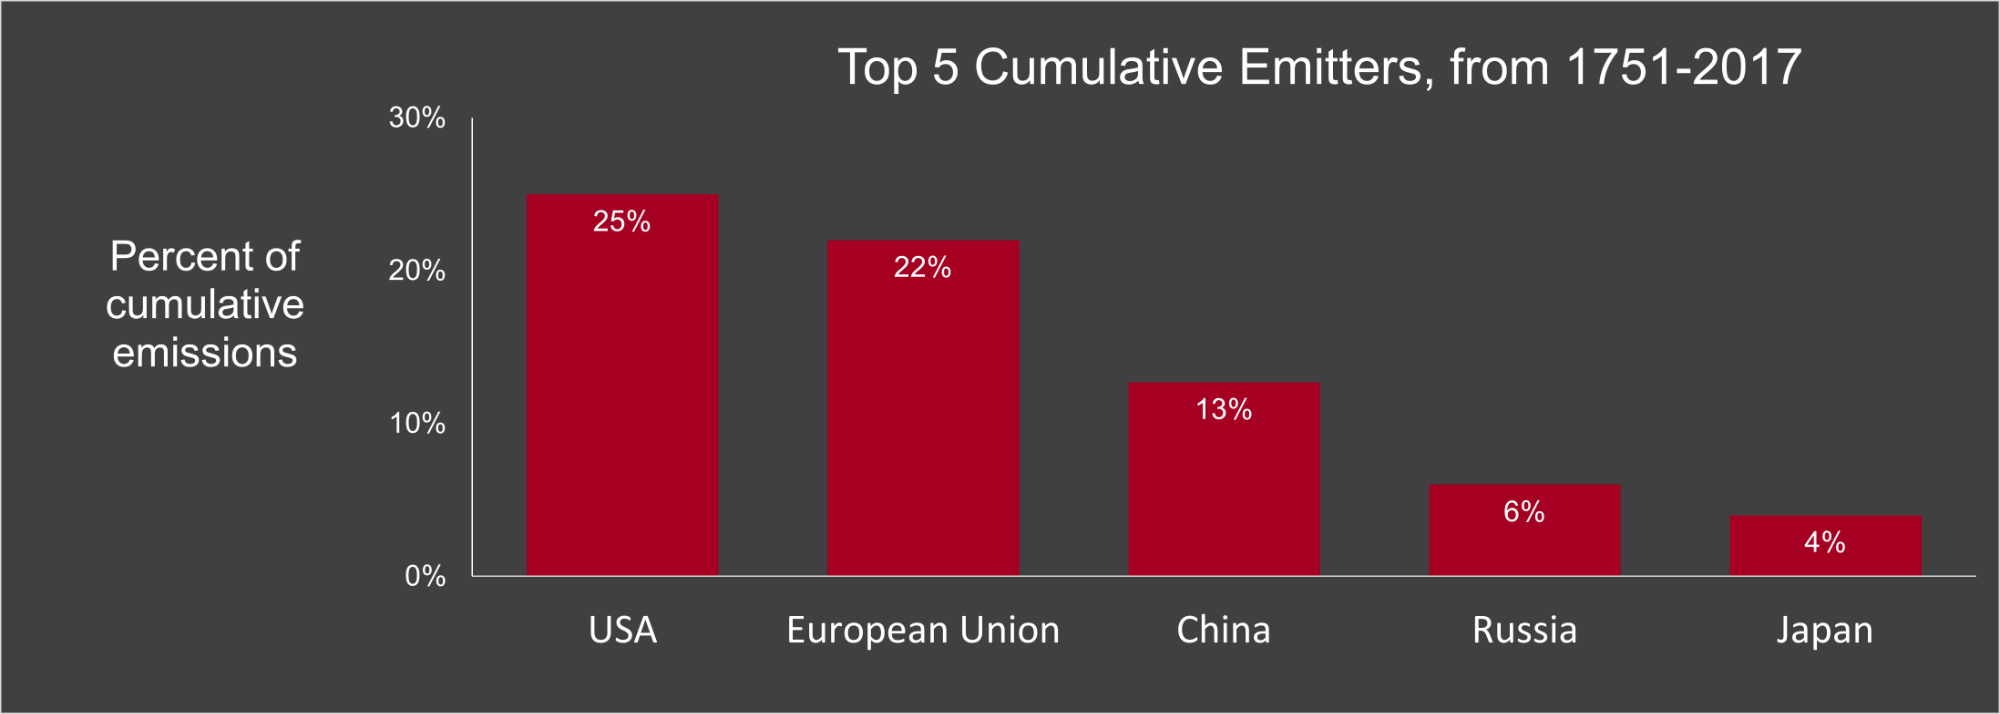
Figure created by Ingrid Zabel for PRI's Earth@Home project (CC BY-NC-SA 4.0 license), with data from OurWorldInData.org
Potential discussion questions:
- Given these numbers, what are the responsibilities of different countries for taking action to adapt to and mitigate climate change?
-
Should wealthier nations such as the U.S. pay to help poorer nations adapt to climate change? If so, what is a country’s balance between spending money to protect its own people and cities and spending money to help people elsewhere?
-
Do developed countries such as the U.S. and the European Union bear greater responsibility to address climate change since the current warming comes largely from CO₂ they have emitted in the past, or is China’s responsibility greater since it is the largest emitter recently (total, not per capita)?
-
What are individuals’ responsibilities to address climate change? An interesting question to consider is one posed by philosopher Dale Jamieson (see, for example, Jamieson's book Reason in a Dark Time (Oxford University Press, 2014).) He describes a person taking a long airplane flight, which results in a large amount of carbon emissions. These carbon emissions contribute to warming which can lead to extreme weather events that kill people. One could argue then that taking airplane flights can amount to committing murder, but very few people flying on airplanes feel like they are murderers. How does our sense of morality fit with our actions that are causing climate change?
Discussion: just adaptation solutions
This chapter showed two examples of just adaptation solutions: community gardens and energy-efficient affordable housing. What other solutions can you think of? Consider solutions at different levels: individual, private companies, non-profit organizations, public/government.